(Friday market open) Jobs growth remained robust in February but down from January’s swollen levels, and there were some market-friendly nuggets in the Department of Labor’s Nonfarm Payrolls report released early Friday. This could be a day when the internals of the report matter more than the headline, judging from the initial market reaction.
February jobs growth of 311,000 was still historically strong but down from a revised 504,000 in January. It was way above Wall Street’s expectations of 205,000, however. The continued healthy gains signal the Federal Reserve could have more work to do as it tries to cool down the hot labor market, which contributes to inflation growth.
On the positive side, if you’re the Fed, average hourly wages rose 0.2%, a bit below the average 0.3% estimate and below 0.3% in January, which may be a positive omen considering the Fed wants to see the labor market soften. And the government’s downward revisions to December and January’s reports took those reports down by a total of 34,000 positions. The unemployment rate ticked up to 3.6% from 3.4% as labor market participation picked up slightly. That also may provide support for the markets, which are trading gingerly amid rate concerns.
Stock index futures, which had been down overnight following yesterday’s steep losses driven by softness in the banking sector, began to recover a bit ahead of the opening bell. And chances of the Fed raising rates by 50 basis points fell below 44%, according to the CME FedWatch Tool, after touching 75% on Thursday. Treasury yields—which had been rallying amid ideas the Fed could raise rates by 50 basis points instead of 25, stepped back.

Just in
The labor market remains hot—that’s one takeaway from today’s monthly payrolls report. Growth of 311,000 is historically strong any way you look at it. Before the pandemic, average monthly job gains had been below 200,000.
However, it’s important to break jobs growth down by sector. Leisure and hospitality, an industry hit heavily by job losses during COVID-19, saw more than 100,000 jobs added during February. These tend to be lower-paying jobs, which might be one reason wage growth came in softer overall in the report.
But the manufacturing sector has been weak for several months, judging by previously released data, and that appears to be showing up in the jobs data. This could signal the kind of cooling the Fed has been looking for, though it’s important to remember this is just one report. There was little growth in manufacturing positions during February, the government said. Transportation and warehousing saw a drop in positions, though growth in construction jobs was relatively solid at 24,000.
Morning rush
The 10-year Treasury note yield (TNX) continued to fall, dropping 16 basis points to 3.78%.
The U.S. Dollar Index ($DXY), which is very sensitive to possible rate hikes, fell to 104.8.
The Cboe Volatility Index® (VIX) futures remained elevated at 22.91.
WTI Crude Oil (/CL) continued its sharp descent, recently trading at $75.02 per barrel.
VIX jumped 18% on Thursday as stocks cratered. It’s another reminder of how quickly things can get volatile on Wall Street, especially with the interest rate situation so unsettled.
Eye on the Fed
Immediately following this morning’s jobs report, the probability of a 50-basis-point Federal Reserve rate hike March 21–22 fell to 44%, compared with 75% on Thursday, according to the CME FedWatch Tool. While jobs data can influence the impact of the Fed’s decision, next week’s inflation and Retail Sales data also likely will shape the central bank’s thinking on rates heading into its meeting later this month.
Speaking of the Fed meeting, Monday begins a “quiet period” during which Fed speakers will stand down before they gather to make a rate decision the following week. Their absence could help ease volatility slightly, as the market won’t have any Fed speaker headlines to react to.
What to Watch
There’s no break from the data next week. Three critical reports arrive just a week ahead of the March 21–22 Federal Open Market Committee (FOMC) meeting, and all of them carry possible rate implications.
Consumer Price Index (CPI): Tuesday morning serves up February’s CPI report. Back in January, headline CPI rose 0.5% month-over-month and core CPI, which strips out food and energy, climbed 0.4%. Both were in line with analysts’ expectations but up sharply from December’s upwardly revised readings. Housing costs continued to accelerate, climbing 0.8% in January, but vehicle and medical care costs fell.
For February, consensus is 0.4% month-over-month growth for headline and core CPI, according to Trading Economics. However, some analysts think headline could be as high as 0.6%, something that likely would catch a fisheye from the Fed.
The data calendar accelerates Wednesday morning with February’s Producer Price Index (PPI) and Retail Sales data. The first will help investors determine whether price pressure is easing in the wholesale market, a key element for companies trying to protect their margins. Headline and core PPI rose 0.7% and 0.5% in January, both increasing from December’s readings and both posting their biggest gains in months.
Keep in mind, however, that January was a single month in time and may not have been representative of trends. It could be interesting to see if the government revises downward any of its January data, much of which puzzled market participants with its aggressive demeanor.
Retail Sales also overachieved in January, climbing 3% month-over-month (2.3% if you strip out automobile sales). Remember that Retail Sales aren’t adjusted for inflation, so rising prices of goods can influence the final numbers. Food prices continue to rise, but that didn’t prevent consumers from spending 7.2% more on food and drinking establishment purchases in January than they had the previous month. Even with inflation factored in, that was a massive jump.
We’ll preview analysts’ consensus views on PPI and Retail Sales in Monday’s Daily Market Update.
Later next week, watch for important data from Europe, including the latest inflation, wage growth, and trade numbers. Trade data from Europe could be worth a close look because countries like Germany and the U.K. are major exporters to China. The data could provide insight into China’s demand as it reopens.
Stocks in Spotlight
Oracle (ORCL) shares fell nearly 4% in premarket trading after the company’s quarterly revenue missed Wall Street’s expectations. Earnings per share (EPS) did beat the average analyst projection. ORCL’s release stressed the company’s “strong quarterly earnings growth” driven by 48% constant-currency growth for total revenue of ORCL’s two cloud businesses: infrastructure and applications.
Speedy delivery: The market isn’t exactly bursting with earnings news in this lull between reporting seasons, but there are a few outliers sharing quarterly data over the next few weeks. This coming Thursday brings FedEx (FDX), which has been dedicating itself to cutting costs and raising prices as executives warned of “volume softness.” Wall Street seems to like the strategy, as FDX shares are up more than 20% year-to-date, far outpacing the broader market. The stock price remains near its 2023 peak, which is unusual considering most major stocks have retreated from the levels they reached during the January rally.
Market minutes
Here’s how the major indexes performed Thursday:
- The Dow Jones Industrial Average® ($DJI) fell 544 points, or 1.66%, to 32,255.
- The Nasdaq Composite® ($COMP) slid 2.05% to 11,338.
- The Russell 2000®(RUT) dropped 2.81% to 1,827.
- The S&P 500® index (SPX) lost 74 points, or 1.85%, to 3,918.
Major stock indexes lost significant ground Thursday as investor caution resurfaced ahead of jobs data that could help determine the Federal Reserve’s rate path. Concerns in the financial sector also spooked markets.
- Thursday’s selling undid all the advances the SPX had made since a short rally began a week ago. That rally had already been losing air following hawkish comments earlier this week from Fed Chairman Jerome Powell. The SPX closed well below its 200-day moving average of 3,94
- Sector-wise, it was another day of nearly across-the-board losses, with only utilities peaking above the unchanged level at times. Financials have taken a beating this week and continued to Thursday, hurt in part by ideas that higher rates could send the economy into recession. The RUT, with its heavy exposure to regional banks and to the domestic economy, suffered the worst losses among major indexes yesterday.
- It’s interesting to note that falling Treasury yields didn’t help the stock market Thursday. That led some analysts to suggest perhaps rising Treasury prices, which move the opposite direction of yields, may have reflected investors buying fixed income in a “flight to safety” as stocks swooned. No investment is truly safe, of course.
- One interesting and perhaps ironic observation: The bond market and financials stocks appear to be pricing in a possible recession even as the Fed keeps hammering on inflation. Of course, you could argue the Fed has no choice. Maintaining price stability is one of the Fed’s key responsibilities, and it appears it will continue pounding the table on inflation even if the economy begins to slow. Today’s jobs report and next week’s inflation data may not change that, even if it appears softer than the January numbers.
Washington watch: It’s been a while since much happened in Congress to influence the markets, but several issues are simmering beneath the surface that could ultimately have an impact, especially the debt ceiling. The new Congress has started moving into the legislative process, with nearly 1,400 bills introduced in the House of Representatives and more than 600 in the Senate. For a sense of what the policy landscape looks like, check out the latest WashingtonWise podcast from Charles Schwab.
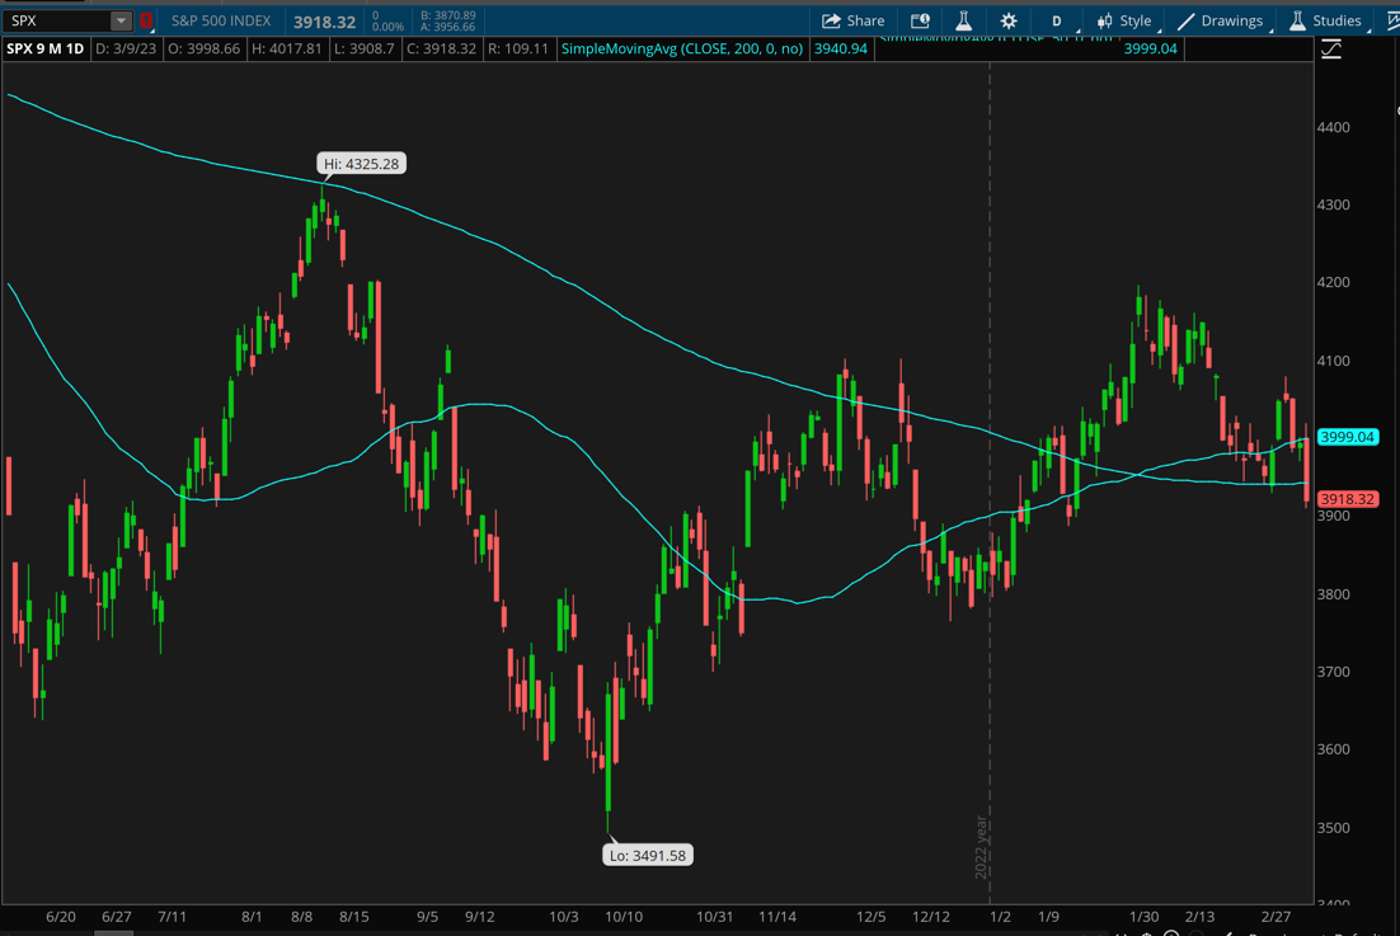
CHART OF THE DAY: BREAKDOWN. The new uptrend in the S&P 500 (SPX—candlesticks) is already starting to fall apart based on yesterday’s selloff. The SPX had been trading above both its 50-day moving average (top blue line) and its 200-day moving average (bottom blue line). It fell below both on Thursday. Data source: S&P Dow Jones Indices. Chart source: The thinkorswim® platform. For illustrative purposes only. Past performance does not guarantee future results.
Thinking cap
Ideas to mull as you trade or invest
Labor pains: In another sign that the labor market may finally be cooling, U.S.-based employers cut more than 77,000 jobs in February, the most for the month since 2009, but down from around 103,000 in January, according to Challenger, Gray, and Christmas. Technology companies cut the most jobs of any sector monitored by the firm. The tech sector has announced 35% of all job cuts in 2023. “Certainly, employers are paying attention to rate increase plans from the Fed,” said Andrew Challenger, Senior Vice President of Challenger, Gray & Christmas, Inc. ’Many have been planning for a downturn for months, cutting costs elsewhere. If things continue to cool, layoffs are typically the last piece in company cost-cutting strategies.”
Demand barometer: While you can monitor data to get a sense of economic demand from major economies, it’s also important to keep an eye on certain key industrial commodities. Crude oil comes immediately to mind, with prices for that key product rattling back and forth in a tight range most of the year near the long-term average. Another important benchmark is copper, an important component of many technology and electric vehicle products. Unfortunately, copper futures (/HG) aren’t providing much in the way of clues this year, recently trading about 7% below their January peak but up 25% from last July’s low. Just a year ago, /HG reached its highest level in decades, as all commodities surged following Russia’s invasion of Ukraine. Copper prices remain elevated, but pressure could come from concerns about central bank rate tightening (which tends to suppress economic activity) and China’s modest economic growth forecast, Trading Economics pointed out. /HG recently eased to $4.03 a pound, not far off recent two-month lows. For clues on copper’s path, remember to keep an eye on gold, which often trades in the opposite direction of its fellow metal.
Pay up: How many times have you been at a theme park and found out that for a slightly higher price you could get into shorter lines for your rides? Well, as margin pressure steepens, many companies are trying that old tactic of encouraging customers to pay more for a premium version, the New York Times reported recently. The notion of “premiumization” was raised in nearly 60 earnings calls and investor meetings over the three weeks leading up to last Friday, the paper said. This is an indication of a changing economy where inflation and consumer spending are expected to moderate, according to the article, making it more difficult for firms to sustain large price increases “without some justification.” The premiumization trend cuts across many industries, from donuts to theme parks to automobiles to industrial spray products. Recently, Walt Disney (DIS) acknowledged it may have pushed too hard on prices at its theme parks, for example. However, executives on the company’s recent earnings call pointed out that “per capita guest spend” at its domestic parks showed strong growth.
Calendar
March 13: No major data or earnings
March 14: February Consumer Price Index (CPI) and Core CPI
March 15: February Retail Sales and February Producer Price Index (PPI).
March 16: February Housing Starts and Building Permits and expected earnings from Dollar General (DG) and FedEx (FDX).
March 17: February Industrial Production, February Leading Indicators, and March Preliminary University of Michigan Consumer Sentiment.
TD Ameritrade® commentary for educational purposes only. Member SIPC.
Image sourced from Shutterstock
This post contains sponsored advertising content. This content is for informational purposes only and not intended to be investing advice.
© 2025 Benzinga.com. Benzinga does not provide investment advice. All rights reserved.
Trade confidently with insights and alerts from analyst ratings, free reports and breaking news that affects the stocks you care about.

