
FB Financial (NYSE:FBK) has been analyzed by 3 analysts in the last three months, revealing a diverse range of perspectives from bullish to bearish.
The table below offers a condensed view of their recent ratings, showcasing the changing sentiments over the past 30 days and comparing them to the preceding months.
| Bullish | Somewhat Bullish | Indifferent | Somewhat Bearish | Bearish | |
|---|---|---|---|---|---|
| Total Ratings | 0 | 1 | 1 | 1 | 0 |
| Last 30D | 0 | 0 | 1 | 1 | 0 |
| 1M Ago | 0 | 1 | 0 | 0 | 0 |
| 2M Ago | 0 | 0 | 0 | 0 | 0 |
| 3M Ago | 0 | 0 | 0 | 0 | 0 |
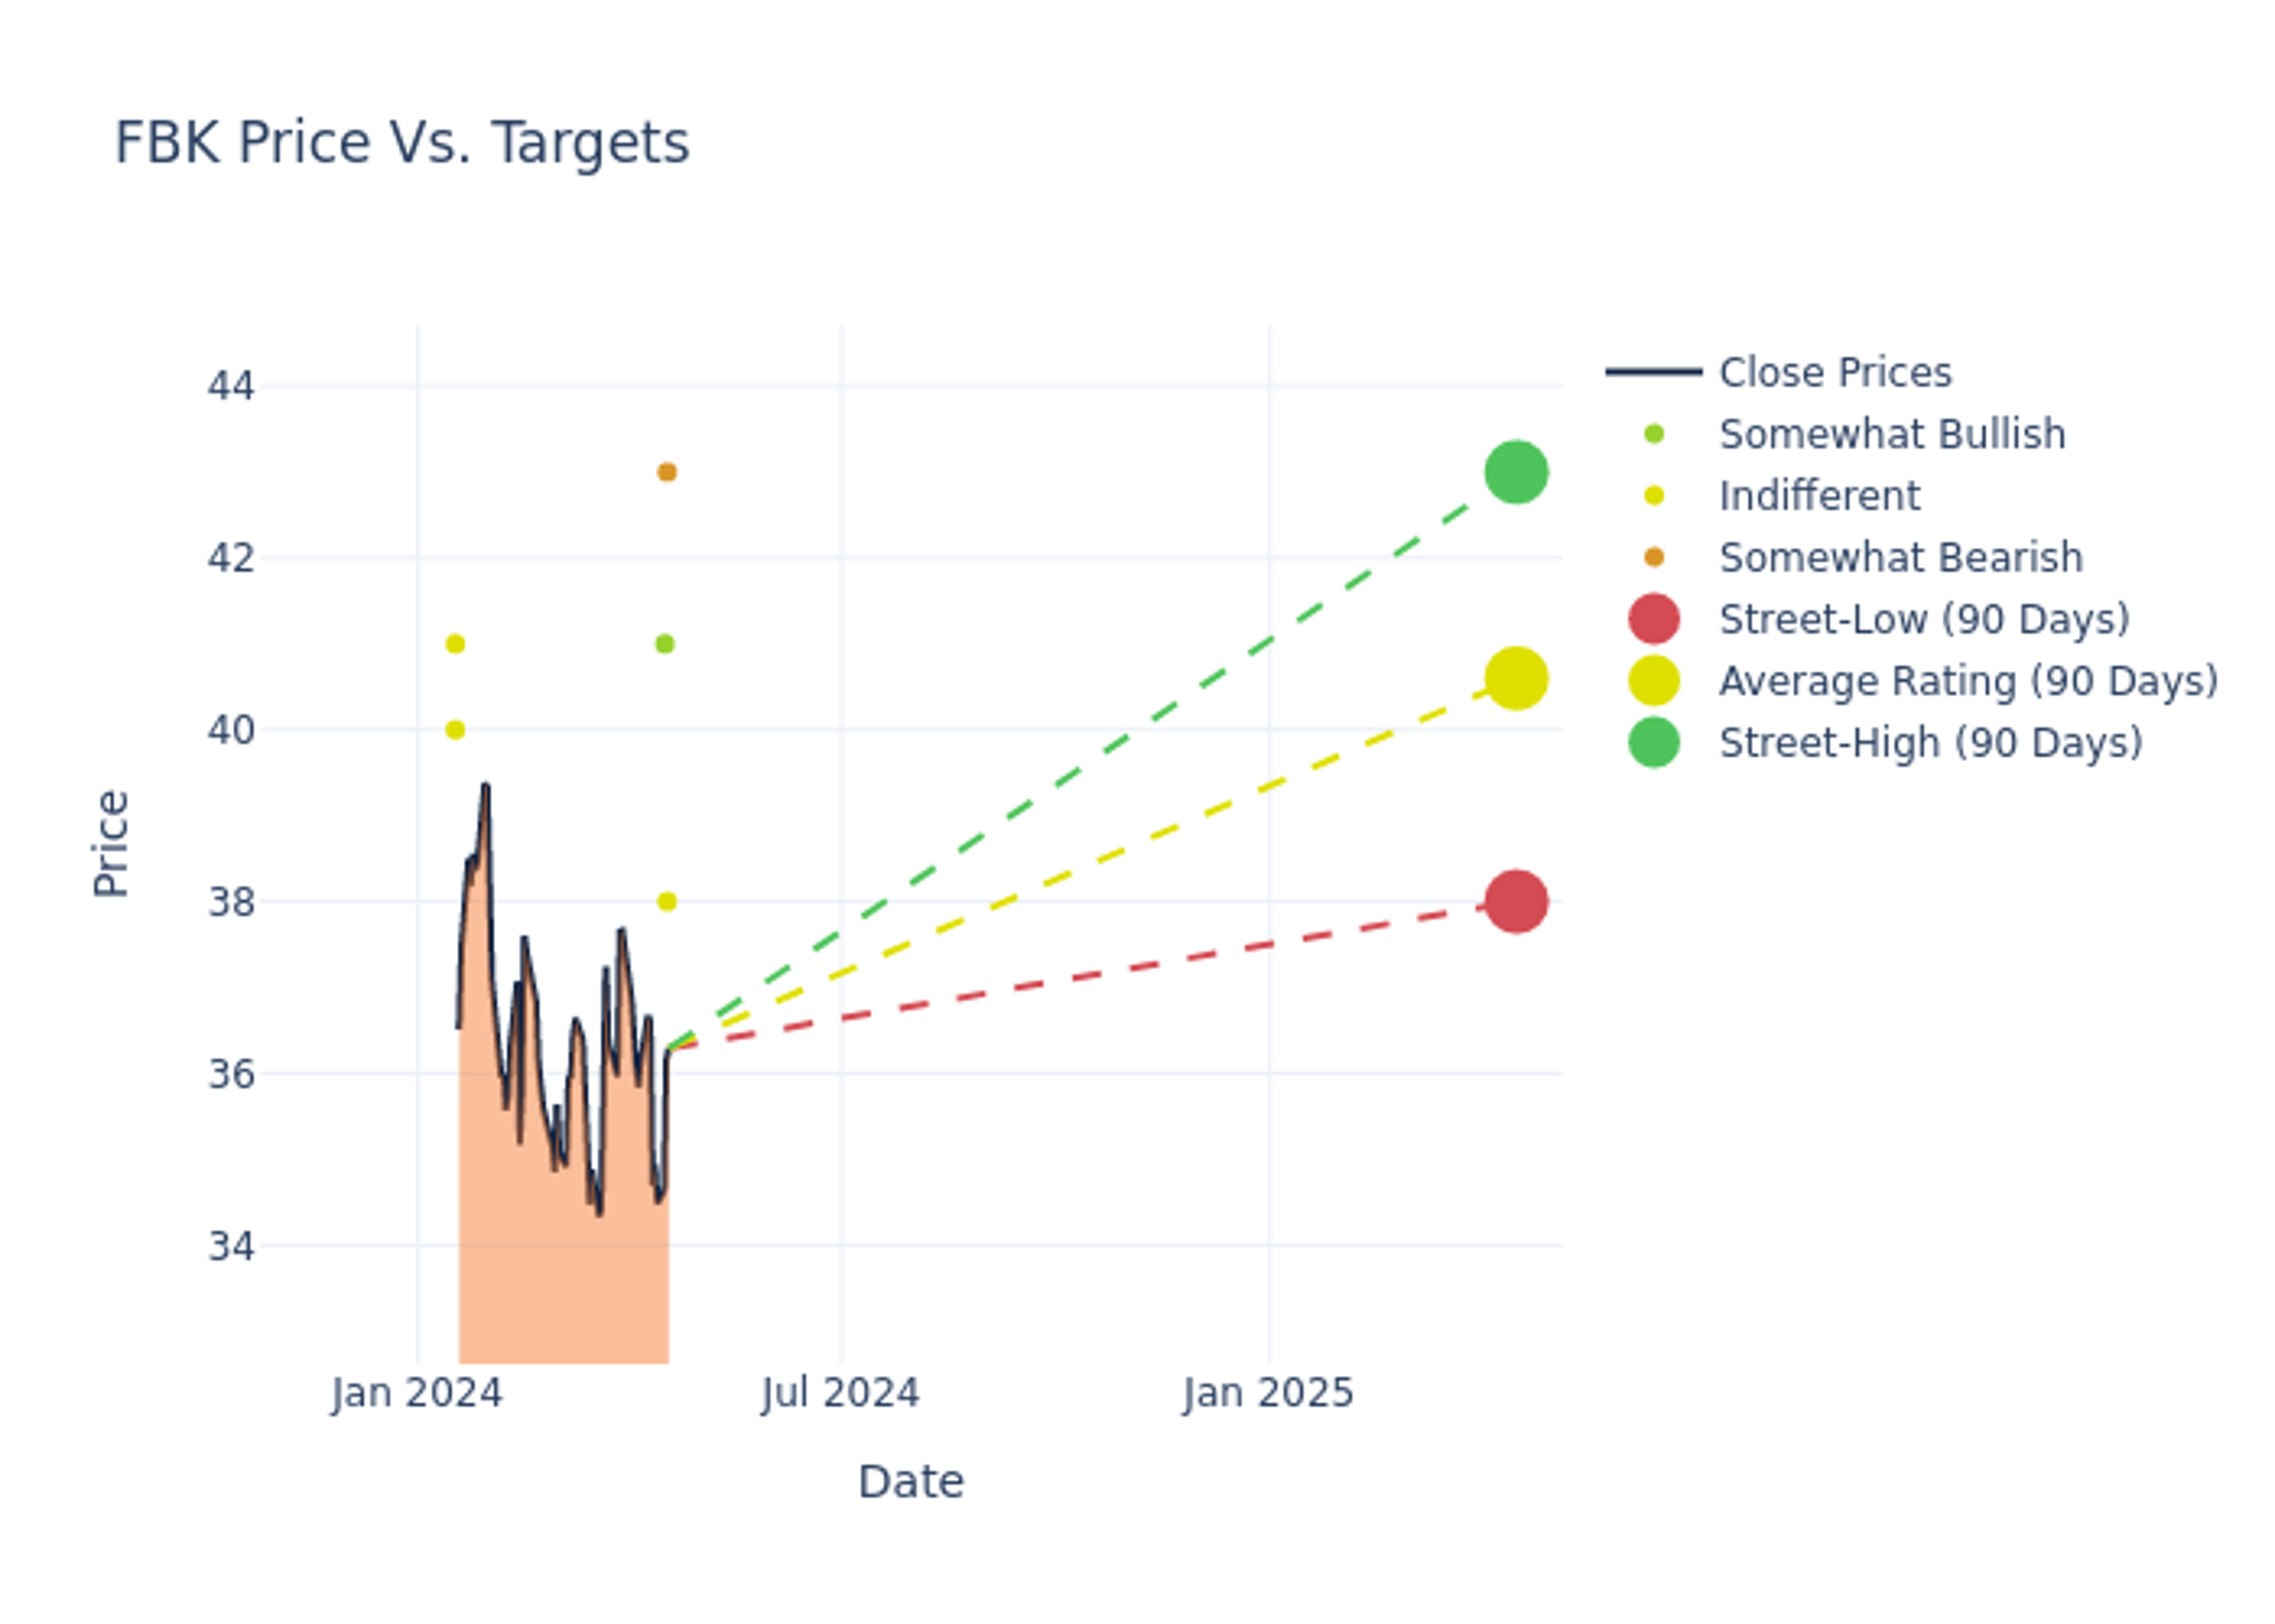
Analysts' evaluations of 12-month price targets offer additional insights, showcasing an average target of $40.67, with a high estimate of $43.00 and a low estimate of $38.00. A 0.8% drop is evident in the current average compared to the previous average price target of $41.00.

Interpreting Analyst Ratings: A Closer Look
An in-depth analysis of recent analyst actions unveils how financial experts perceive FB Financial. The following summary outlines key analysts, their recent evaluations, and adjustments to ratings and price targets.
| Analyst | Analyst Firm | Action Taken | Rating | Current Price Target | Prior Price Target |
|---|---|---|---|---|---|
| Catherine Mealor | Keefe, Bruyette & Woods | Maintains | Market Perform | $38.00 | - |
| Steven Alexopoulos | JP Morgan | Raises | Underweight | $43.00 | $41.00 |
| Stephen Scouten | Piper Sandler | Announces | Overweight | $41.00 | - |
Key Insights:
- Action Taken: In response to dynamic market conditions and company performance, analysts update their recommendations. Whether they 'Maintain', 'Raise', or 'Lower' their stance, it signifies their reaction to recent developments related to FB Financial. This insight gives a snapshot of analysts' perspectives on the current state of the company.
- Rating: Gaining insights, analysts provide qualitative assessments, ranging from 'Outperform' to 'Underperform'. These ratings reflect expectations for the relative performance of FB Financial compared to the broader market.
- Price Targets: Analysts set price targets as an estimate of a stock's future value. Comparing the current and prior price targets provides insight into how analysts' expectations have changed over time. This information can be valuable for investors seeking to understand consensus views on the stock's potential future performance.
Navigating through these analyst evaluations alongside other financial indicators can contribute to a holistic understanding of FB Financial's market standing. Stay informed and make data-driven decisions with our Ratings Table.
Stay up to date on FB Financial analyst ratings.
If you are interested in following small-cap stock news and performance you can start by tracking it here.
All You Need to Know About FB Financial
FB Financial Corp is a bank holding company. The company through its wholly-owned bank subsidiary provides commercial and consumer banking services to clients in select markets in Tennessee, North Alabama, and North Georgia. The company segment includes Banking and Mortgage. It generates revenue from the Banking segment which provides a full range of deposit and lending products and services to corporate, commercial, and consumer customers. The Mortgage segment includes the servicing of residential mortgage loans and the packaging and securitization of loans to governmental agencies.
FB Financial's Financial Performance
Market Capitalization Analysis: The company exhibits a lower market capitalization profile, positioning itself below industry averages. This suggests a smaller scale relative to peers.
Revenue Challenges: FB Financial's revenue growth over 3 months faced difficulties. As of 31 December, 2023, the company experienced a decline of approximately -9.02%. This indicates a decrease in top-line earnings. As compared to its peers, the revenue growth lags behind its industry peers. The company achieved a growth rate lower than the average among peers in Financials sector.
Net Margin: The company's net margin is a standout performer, exceeding industry averages. With an impressive net margin of 25.23%, the company showcases strong profitability and effective cost control.
Return on Equity (ROE): FB Financial's financial strength is reflected in its exceptional ROE, which exceeds industry averages. With a remarkable ROE of 2.08%, the company showcases efficient use of equity capital and strong financial health.
Return on Assets (ROA): FB Financial's financial strength is reflected in its exceptional ROA, which exceeds industry averages. With a remarkable ROA of 0.23%, the company showcases efficient use of assets and strong financial health.
Debt Management: The company maintains a balanced debt approach with a debt-to-equity ratio below industry norms, standing at 0.32.
Analyst Ratings: Simplified
Experts in banking and financial systems, analysts specialize in reporting for specific stocks or defined sectors. Their comprehensive research involves attending company conference calls and meetings, analyzing financial statements, and engaging with insiders to generate what are known as analyst ratings for stocks. Typically, analysts assess and rate each stock once per quarter.
Analysts may supplement their ratings with predictions for metrics like growth estimates, earnings, and revenue, offering investors a more comprehensive outlook. However, investors should be mindful that analysts, like any human, can have subjective perspectives influencing their forecasts.
This article was generated by Benzinga's automated content engine and reviewed by an editor.
© 2025 Benzinga.com. Benzinga does not provide investment advice. All rights reserved.