
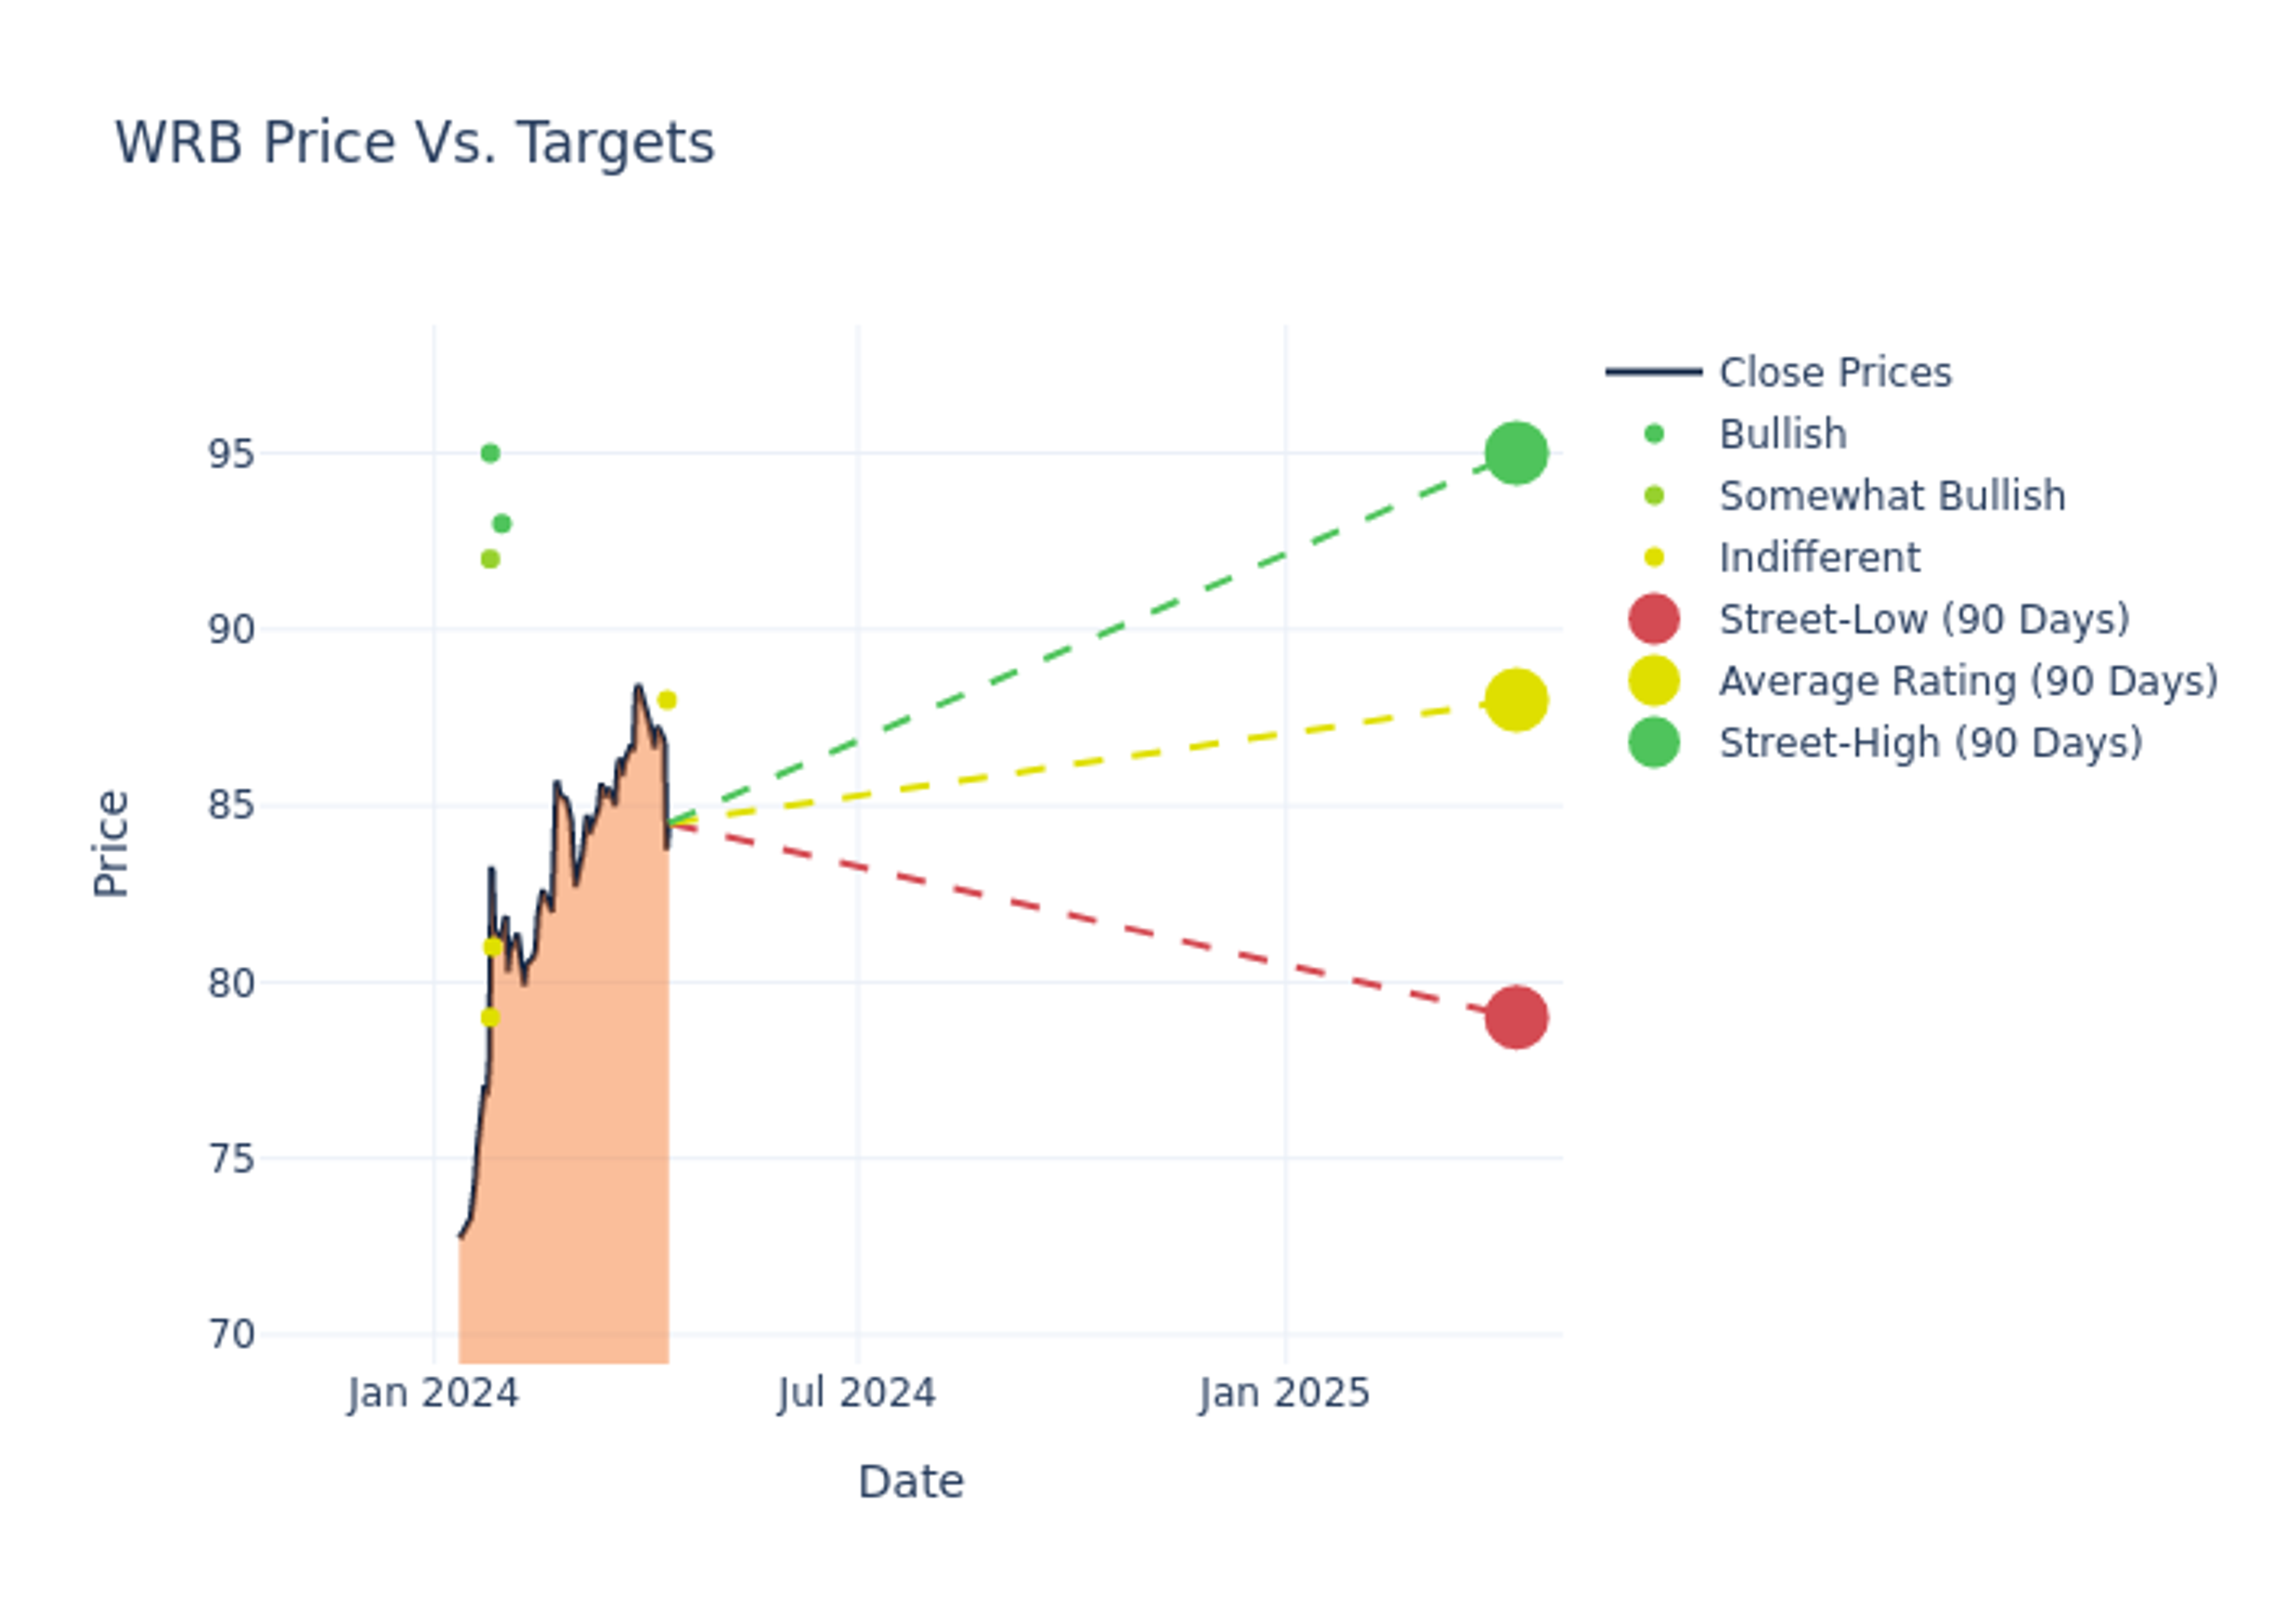
Throughout the last three months, 8 analysts have evaluated WR Berkley (NYSE:WRB), offering a diverse set of opinions from bullish to bearish.
The table below provides a snapshot of their recent ratings, showcasing how sentiments have evolved over the past 30 days and comparing them to the preceding months.
| Bullish | Somewhat Bullish | Indifferent | Somewhat Bearish | Bearish | |
|---|---|---|---|---|---|
| Total Ratings | 2 | 2 | 4 | 0 | 0 |
| Last 30D | 0 | 0 | 1 | 0 | 0 |
| 1M Ago | 0 | 0 | 0 | 0 | 0 |
| 2M Ago | 0 | 0 | 1 | 0 | 0 |
| 3M Ago | 2 | 2 | 2 | 0 | 0 |
The 12-month price targets assessed by analysts reveal further insights, featuring an average target of $86.62, a high estimate of $95.00, and a low estimate of $79.00. Surpassing the previous average price target of $79.50, the current average has increased by 8.96%.

Analyzing Analyst Ratings: A Detailed Breakdown
The standing of WR Berkley among financial experts is revealed through an in-depth exploration of recent analyst actions. The summary below outlines key analysts, their recent evaluations, and adjustments to ratings and price targets.
| Analyst | Analyst Firm | Action Taken | Rating | Current Price Target | Prior Price Target |
|---|---|---|---|---|---|
| Meyer Shields | Keefe, Bruyette & Woods | Raises | Market Perform | $88.00 | $85.00 |
| Meyer Shields | Keefe, Bruyette & Woods | Raises | Market Perform | $85.00 | $80.00 |
| Brian Meredith | UBS | Raises | Buy | $93.00 | $81.00 |
| Michael Zaremski | BMO Capital | Raises | Market Perform | $81.00 | $71.00 |
| Mark Hughes | Truist Securities | Raises | Buy | $95.00 | $83.00 |
| Elyse Greenspan | Wells Fargo | Raises | Overweight | $92.00 | $84.00 |
| Scott Heleniak | RBC Capital | Raises | Sector Perform | $79.00 | $73.00 |
| Meyer Shields | Keefe, Bruyette & Woods | Raises | Outperform | $80.00 | $79.00 |
Key Insights:
- Action Taken: Responding to changing market dynamics and company performance, analysts update their recommendations. Whether they 'Maintain', 'Raise', or 'Lower' their stance, it signifies their response to recent developments related to WR Berkley. This offers insight into analysts' perspectives on the current state of the company.
- Rating: Analysts unravel qualitative evaluations for stocks, ranging from 'Outperform' to 'Underperform'. These ratings offer insights into expectations for the relative performance of WR Berkley compared to the broader market.
- Price Targets: Analysts gauge the dynamics of price targets, providing estimates for the future value of WR Berkley's stock. This comparison reveals trends in analysts' expectations over time.
Navigating through these analyst evaluations alongside other financial indicators can contribute to a holistic understanding of WR Berkley's market standing. Stay informed and make data-driven decisions with our Ratings Table.
Stay up to date on WR Berkley analyst ratings.
About WR Berkley
W.R. Berkley is an insurance holding company with a host of subsidiaries that primarily underwrite commercial casualty insurance. The firm specializes in niche products that include various excess and surplus lines, workers' compensation insurance, self-insurance consulting, reinsurance, and regional commercial lines for small and midsize businesses.
Key Indicators: WR Berkley's Financial Health
Market Capitalization Analysis: With a profound presence, the company's market capitalization is above industry averages. This reflects substantial size and strong market recognition.
Revenue Growth: WR Berkley's remarkable performance in 3 months is evident. As of 31 December, 2023, the company achieved an impressive revenue growth rate of 6.99%. This signifies a substantial increase in the company's top-line earnings. When compared to others in the Financials sector, the company faces challenges, achieving a growth rate lower than the average among peers.
Net Margin: WR Berkley's net margin is below industry standards, pointing towards difficulties in achieving strong profitability. With a net margin of 12.46%, the company may encounter challenges in effective cost control.
Return on Equity (ROE): WR Berkley's ROE is below industry averages, indicating potential challenges in efficiently utilizing equity capital. With an ROE of 5.53%, the company may face hurdles in achieving optimal financial returns.
Return on Assets (ROA): WR Berkley's ROA is below industry standards, pointing towards difficulties in efficiently utilizing assets. With an ROA of 1.08%, the company may encounter challenges in delivering satisfactory returns from its assets.
Debt Management: With a high debt-to-equity ratio of 0.38, WR Berkley faces challenges in effectively managing its debt levels, indicating potential financial strain.
How Are Analyst Ratings Determined?
Within the domain of banking and financial systems, analysts specialize in reporting for specific stocks or defined sectors. Their work involves attending company conference calls and meetings, researching company financial statements, and communicating with insiders to publish "analyst ratings" for stocks. Analysts typically assess and rate each stock once per quarter.
Some analysts publish their predictions for metrics such as growth estimates, earnings, and revenue to provide additional guidance with their ratings. When using analyst ratings, it is important to keep in mind that stock and sector analysts are also human and are only offering their opinions to investors.
This article was generated by Benzinga's automated content engine and reviewed by an editor.
© 2025 Benzinga.com. Benzinga does not provide investment advice. All rights reserved.