
Ratings for Wells Fargo (NYSE:WFC) were provided by 12 analysts in the past three months, showcasing a mix of bullish and bearish perspectives.
In the table below, you'll find a summary of their recent ratings, revealing the shifting sentiments over the past 30 days and comparing them to the previous months.
| Bullish | Somewhat Bullish | Indifferent | Somewhat Bearish | Bearish | |
|---|---|---|---|---|---|
| Total Ratings | 3 | 2 | 7 | 0 | 0 |
| Last 30D | 0 | 0 | 1 | 0 | 0 |
| 1M Ago | 2 | 1 | 4 | 0 | 0 |
| 2M Ago | 0 | 0 | 0 | 0 | 0 |
| 3M Ago | 1 | 1 | 2 | 0 | 0 |
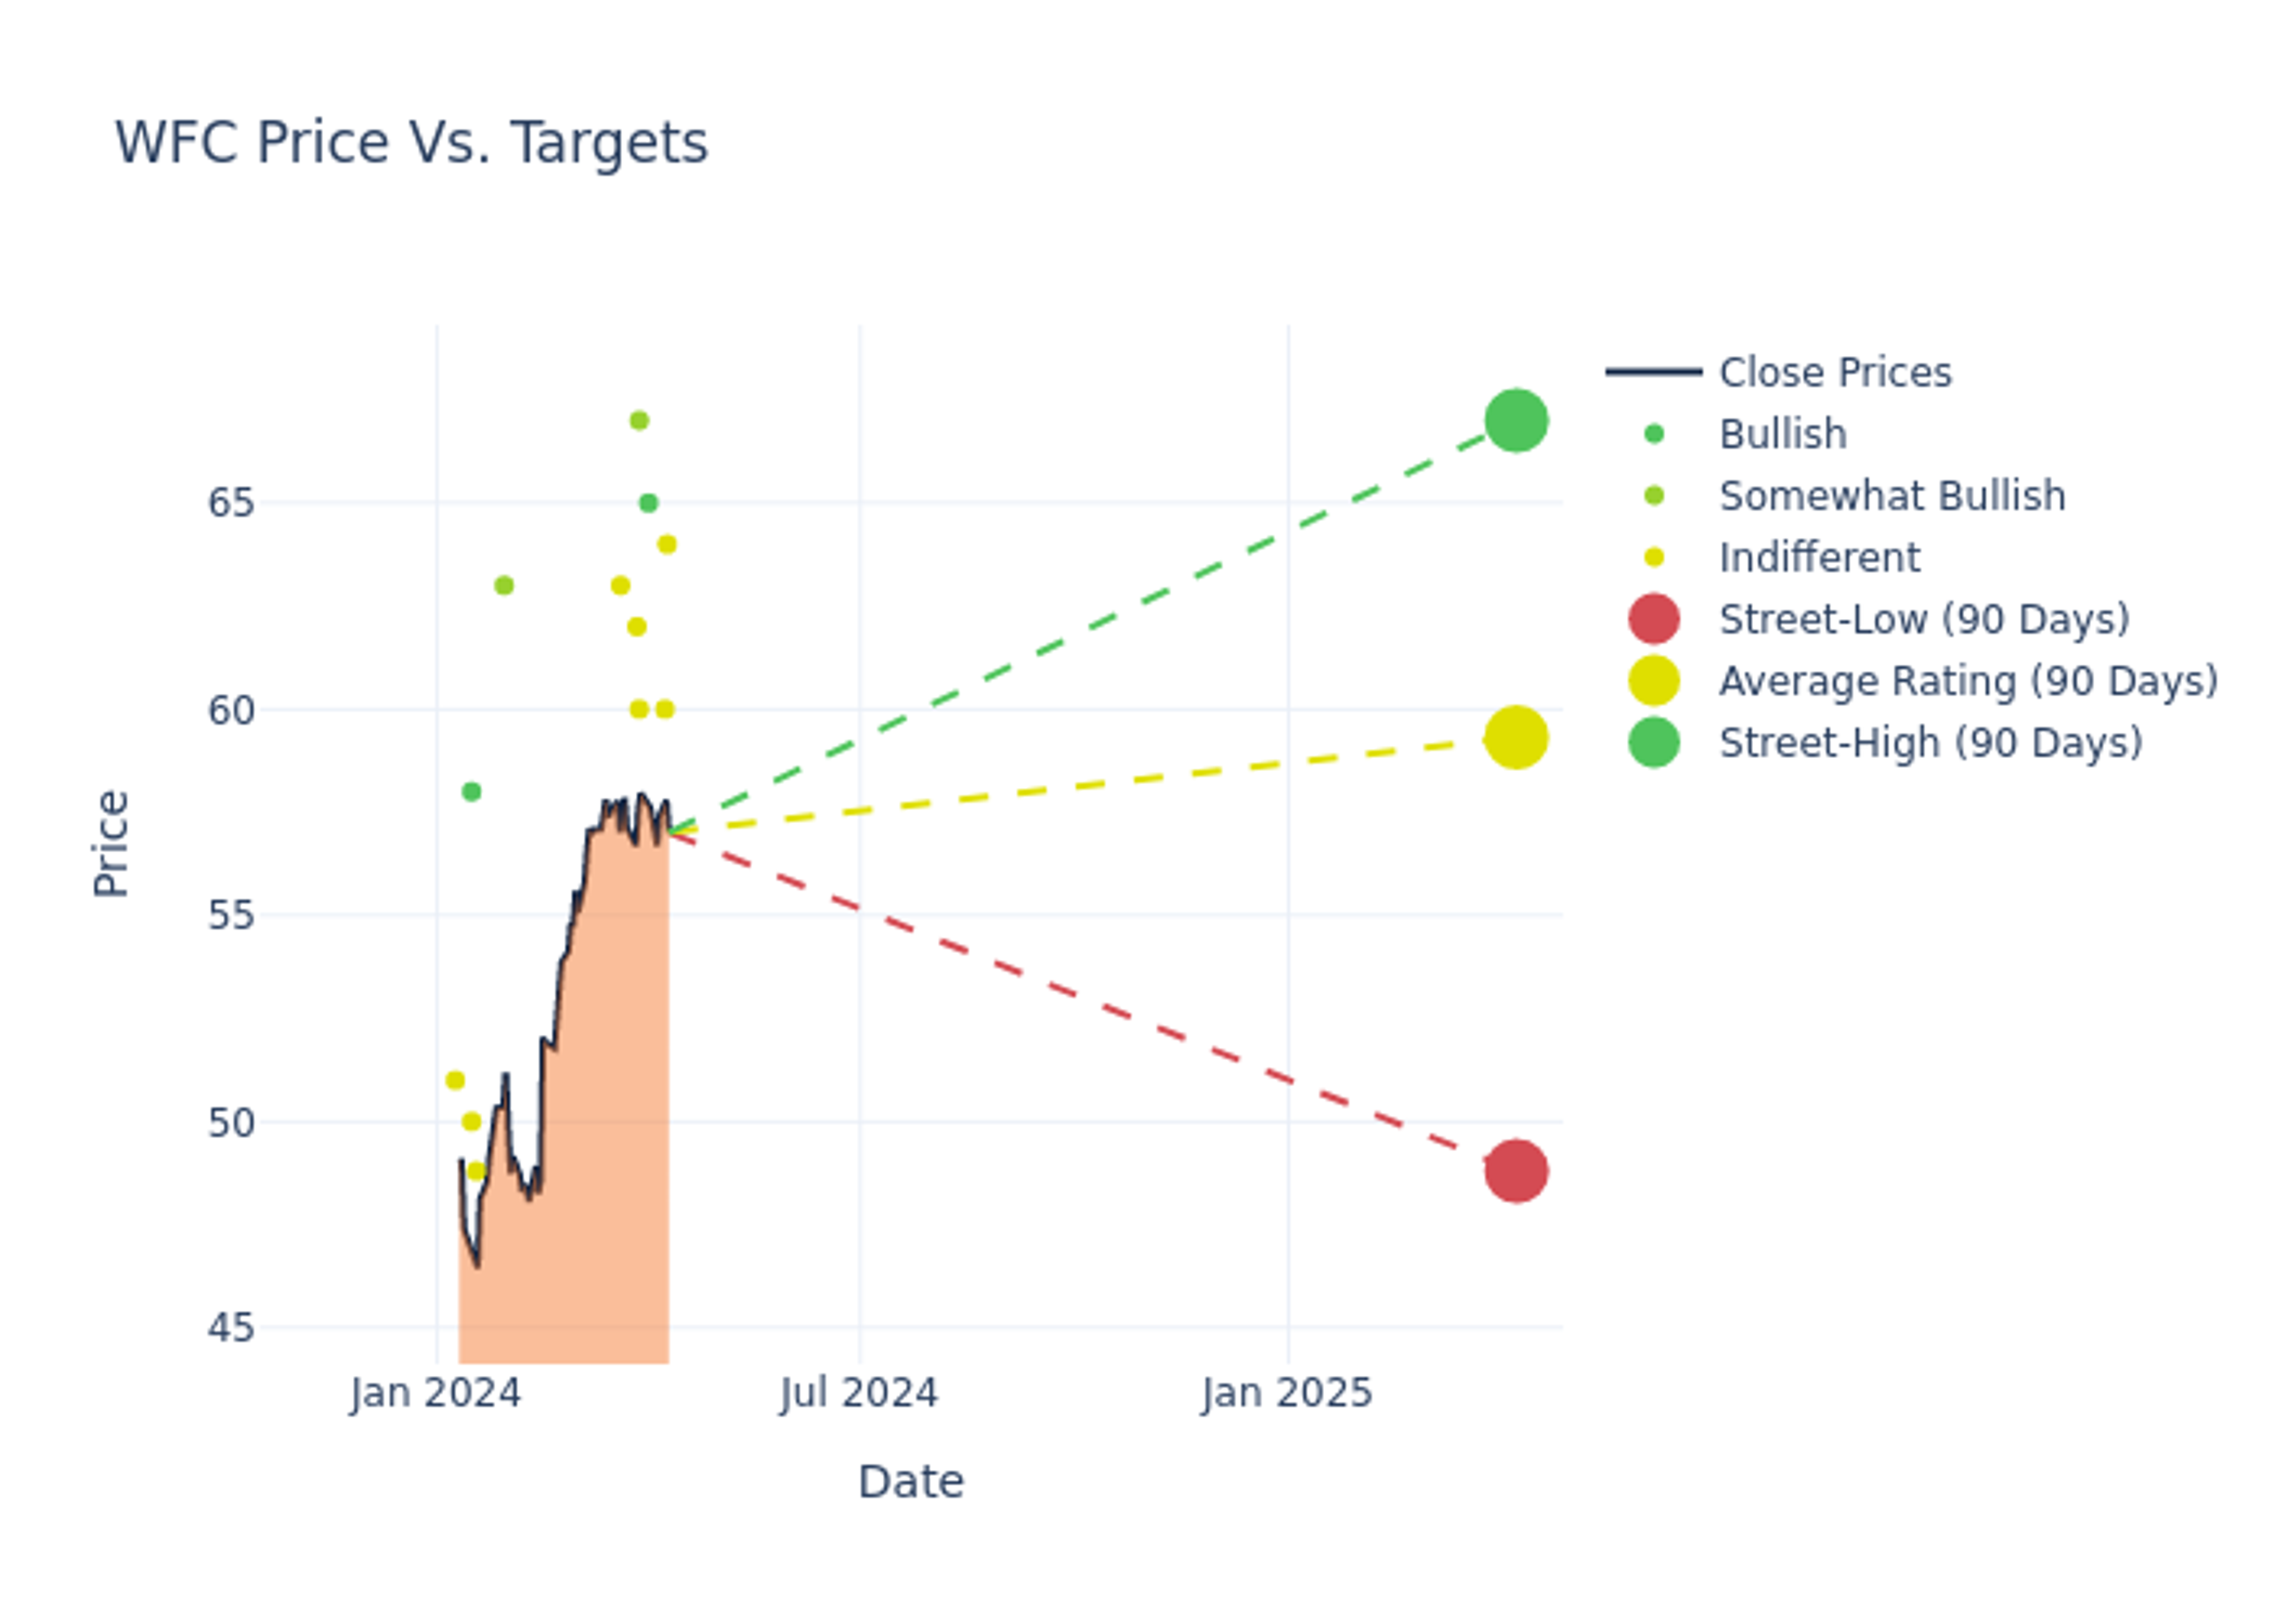
Analysts' evaluations of 12-month price targets offer additional insights, showcasing an average target of $60.4, with a high estimate of $67.00 and a low estimate of $48.80. This current average reflects an increase of 7.0% from the previous average price target of $56.45.

Investigating Analyst Ratings: An Elaborate Study
The perception of Wells Fargo by financial experts is analyzed through recent analyst actions. The following summary presents key analysts, their recent evaluations, and adjustments to ratings and price targets.
| Analyst | Analyst Firm | Action Taken | Rating | Current Price Target | Prior Price Target |
|---|---|---|---|---|---|
| David Rochester | Compass Point | Maintains | Neutral | $64.00 | $64.00 |
| Ken Usdin | Jefferies | Raises | Hold | $60.00 | $52.00 |
| Richard Ramsden | Goldman Sachs | Raises | Buy | $65.00 | $57.00 |
| John Pancari | Evercore ISI Group | Raises | Outperform | $67.00 | $58.00 |
| Saul Martinez | HSBC | Raises | Hold | $60.00 | $55.00 |
| David Konrad | Keefe, Bruyette & Woods | Raises | Market Perform | $62.00 | $56.00 |
| Keith Horowitz | Citigroup | Raises | Neutral | $63.00 | $57.00 |
| David Rochester | Compass Point | Raises | Buy | $64.00 | $62.00 |
| Betsy Graseck | Morgan Stanley | Raises | Overweight | $63.00 | $54.00 |
| Dick Bove | Odeon Capital | Announces | Hold | $48.80 | - |
| Scott Siefers | Piper Sandler | Lowers | Neutral | $50.00 | $51.00 |
| David Long | Raymond James | Raises | Strong Buy | $58.00 | $55.00 |
Key Insights:
- Action Taken: Analysts adapt their recommendations to changing market conditions and company performance. Whether they 'Maintain', 'Raise' or 'Lower' their stance, it reflects their response to recent developments related to Wells Fargo. This information provides a snapshot of how analysts perceive the current state of the company.
- Rating: Offering a comprehensive view, analysts assess stocks qualitatively, spanning from 'Outperform' to 'Underperform'. These ratings convey expectations for the relative performance of Wells Fargo compared to the broader market.
- Price Targets: Analysts explore the dynamics of price targets, providing estimates for the future value of Wells Fargo's stock. This examination reveals shifts in analysts' expectations over time.
Understanding these analyst evaluations alongside key financial indicators can offer valuable insights into Wells Fargo's market standing. Stay informed and make well-considered decisions with our Ratings Table.
Stay up to date on Wells Fargo analyst ratings.
Delving into Wells Fargo's Background
Wells Fargo is one of the largest banks in the United States, with approximately $1.9 trillion in balance sheet assets. The company has four primary segments: consumer banking, commercial banking, corporate and investment banking, and wealth and investment management. It is almost entirely focused on the U.S.
Financial Insights: Wells Fargo
Market Capitalization Highlights: Above the industry average, the company's market capitalization signifies a significant scale, indicating strong confidence and market prominence.
Revenue Growth: Wells Fargo's remarkable performance in 3 months is evident. As of 31 December, 2023, the company achieved an impressive revenue growth rate of 2.22%. This signifies a substantial increase in the company's top-line earnings. As compared to its peers, the revenue growth lags behind its industry peers. The company achieved a growth rate lower than the average among peers in Financials sector.
Net Margin: Wells Fargo's net margin is below industry standards, pointing towards difficulties in achieving strong profitability. With a net margin of 15.43%, the company may encounter challenges in effective cost control.
Return on Equity (ROE): Wells Fargo's ROE lags behind industry averages, suggesting challenges in maximizing returns on equity capital. With an ROE of 1.93%, the company may face hurdles in achieving optimal financial performance.
Return on Assets (ROA): Wells Fargo's ROA falls below industry averages, indicating challenges in efficiently utilizing assets. With an ROA of 0.16%, the company may face hurdles in generating optimal returns from its assets.
Debt Management: Wells Fargo's debt-to-equity ratio is below the industry average at 1.32, reflecting a lower dependency on debt financing and a more conservative financial approach.
Analyst Ratings: What Are They?
Analysts work in banking and financial systems and typically specialize in reporting for stocks or defined sectors. Analysts may attend company conference calls and meetings, research company financial statements, and communicate with insiders to publish "analyst ratings" for stocks. Analysts typically rate each stock once per quarter.
Some analysts publish their predictions for metrics such as growth estimates, earnings, and revenue to provide additional guidance with their ratings. When using analyst ratings, it is important to keep in mind that stock and sector analysts are also human and are only offering their opinions to investors.
This article was generated by Benzinga's automated content engine and reviewed by an editor.
© 2025 Benzinga.com. Benzinga does not provide investment advice. All rights reserved.