
Providing a diverse range of perspectives from bullish to bearish, 9 analysts have published ratings on Stryker (NYSE:SYK) in the last three months.
The table below summarizes their recent ratings, showcasing the evolving sentiments within the past 30 days and comparing them to the preceding months.
| Bullish | Somewhat Bullish | Indifferent | Somewhat Bearish | Bearish | |
|---|---|---|---|---|---|
| Total Ratings | 4 | 4 | 1 | 0 | 0 |
| Last 30D | 1 | 0 | 0 | 0 | 0 |
| 1M Ago | 0 | 0 | 0 | 0 | 0 |
| 2M Ago | 0 | 1 | 0 | 0 | 0 |
| 3M Ago | 3 | 3 | 1 | 0 | 0 |
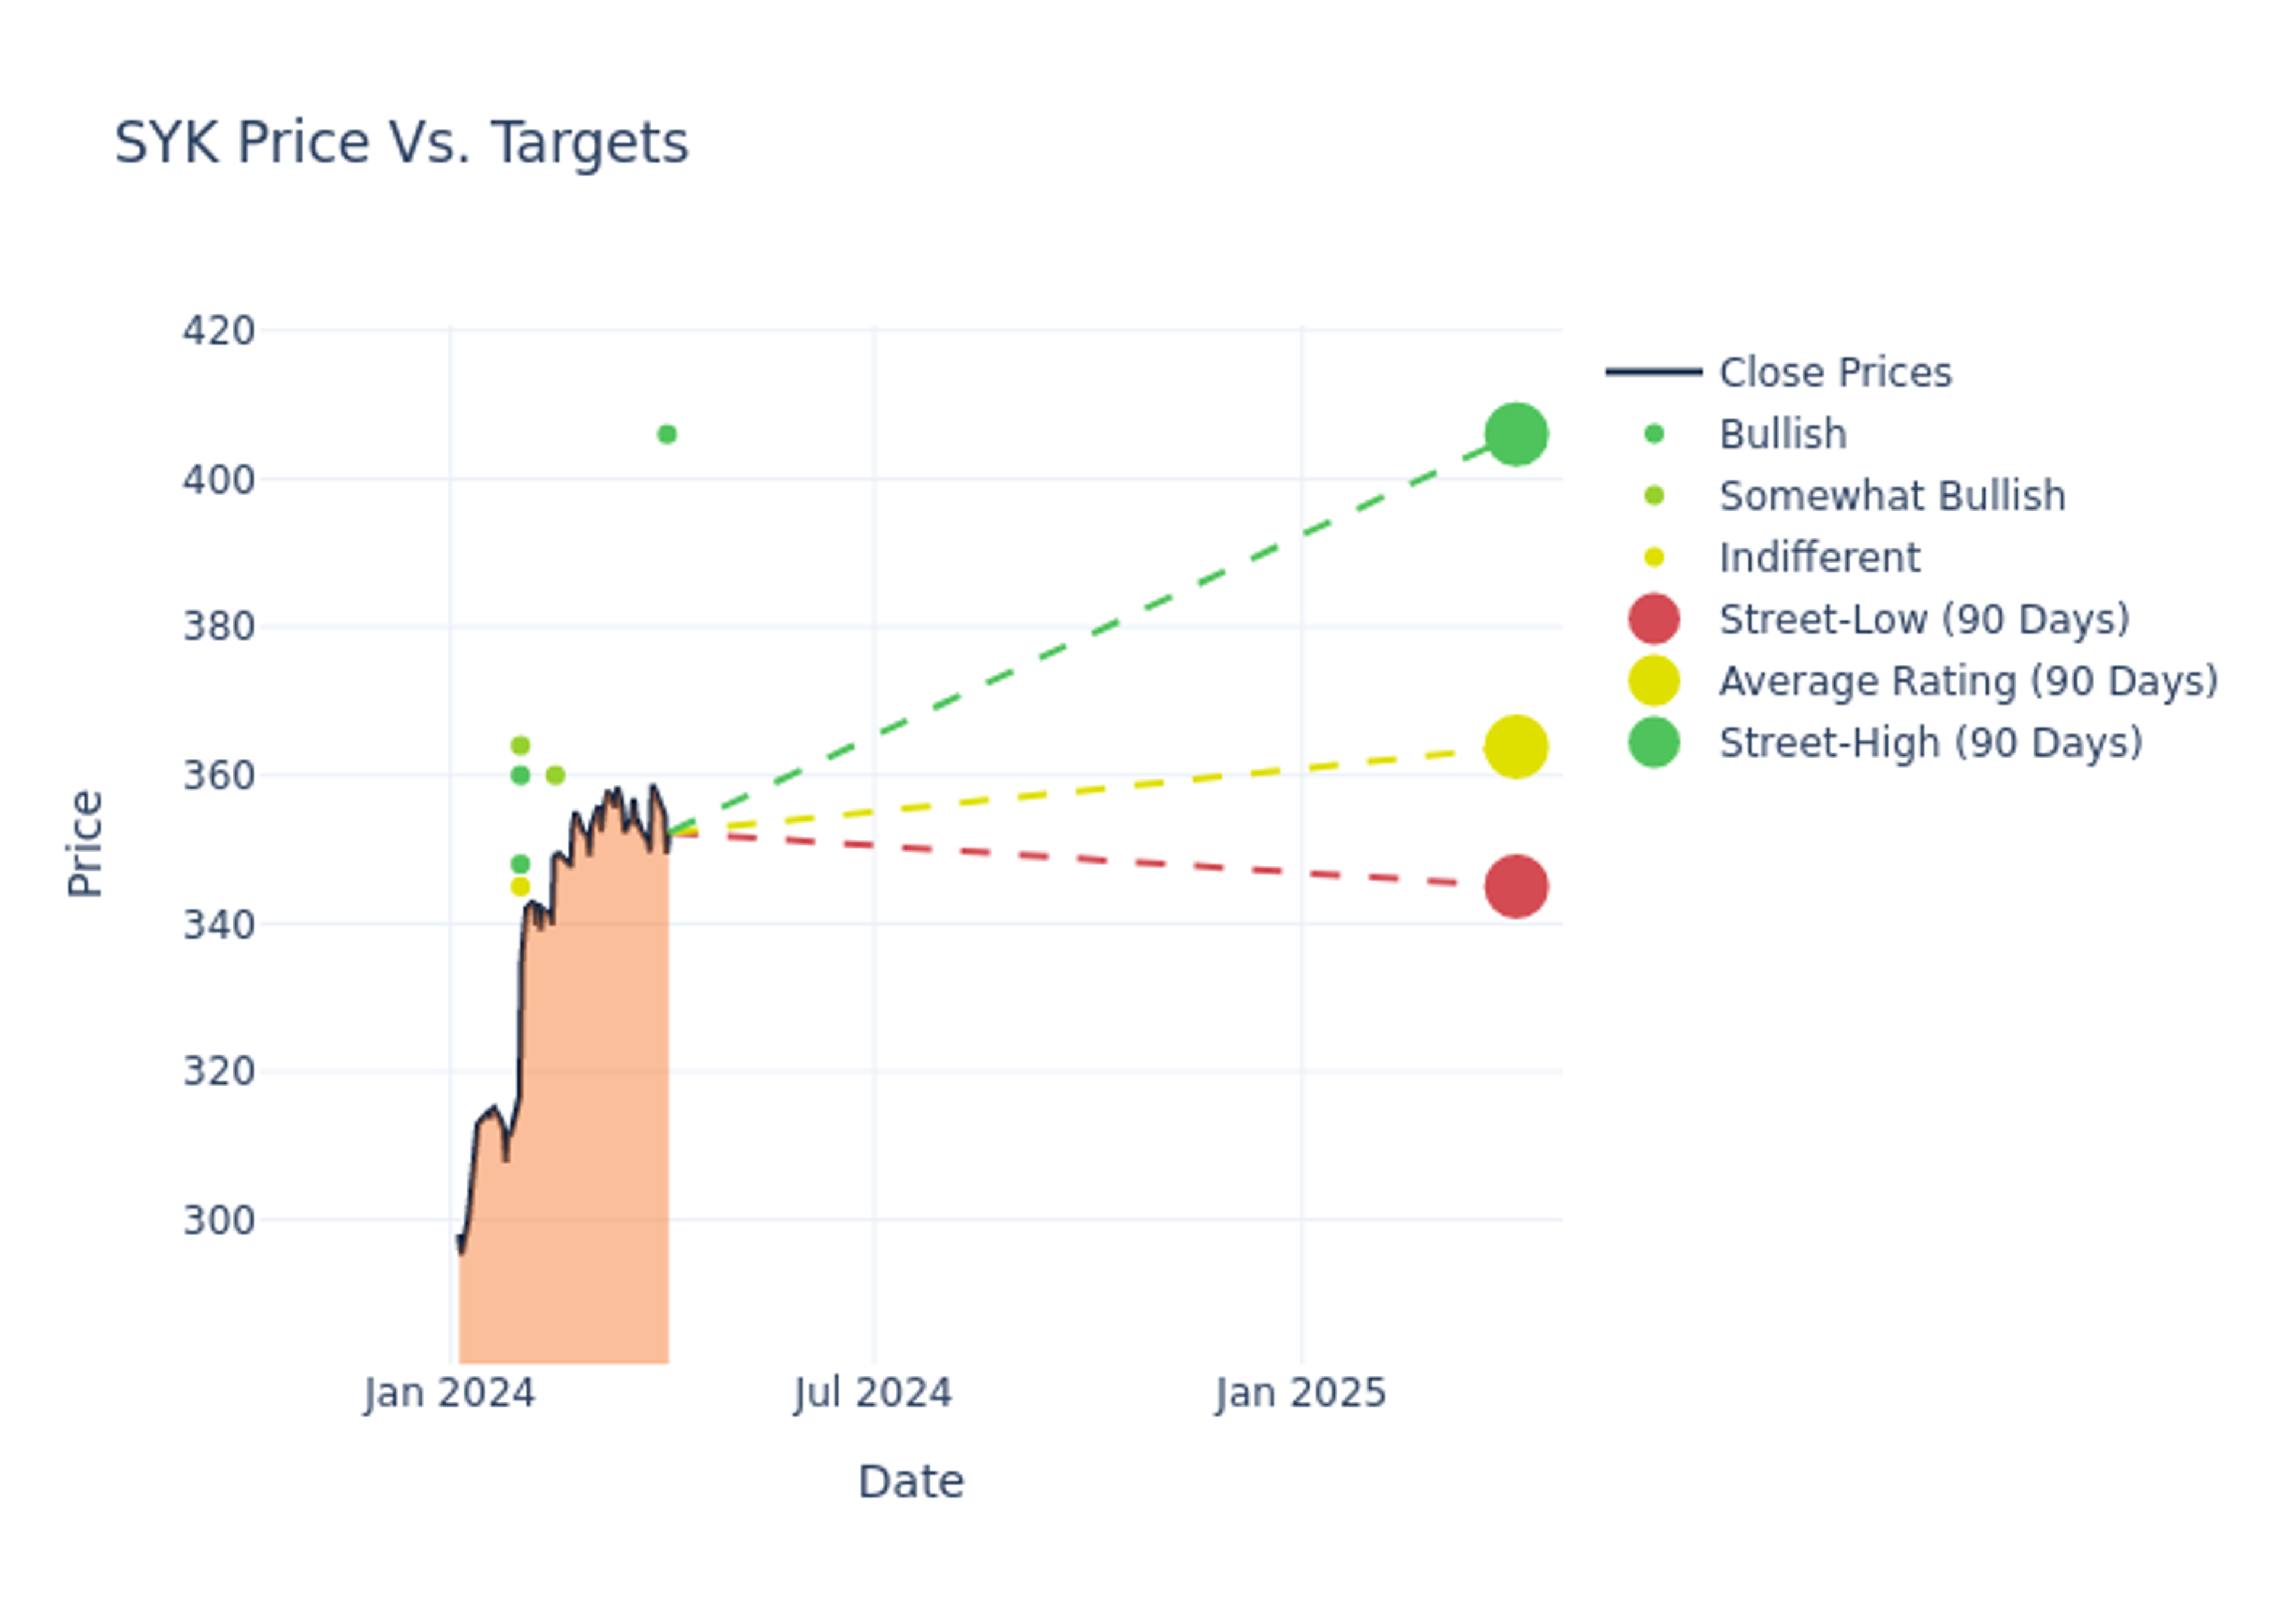
Analysts have recently evaluated Stryker and provided 12-month price targets. The average target is $361.11, accompanied by a high estimate of $406.00 and a low estimate of $345.00. This upward trend is apparent, with the current average reflecting a 6.52% increase from the previous average price target of $339.00.

Diving into Analyst Ratings: An In-Depth Exploration
The perception of Stryker by financial experts is analyzed through recent analyst actions. The following summary presents key analysts, their recent evaluations, and adjustments to ratings and price targets.
| Analyst | Analyst Firm | Action Taken | Rating | Current Price Target | Prior Price Target |
|---|---|---|---|---|---|
| Joanne Wuensch | Citigroup | Raises | Buy | $406.00 | $362.00 |
| Shagun Singh | RBC Capital | Maintains | Outperform | $360.00 | - |
| Shagun Singh | RBC Capital | Raises | Outperform | $360.00 | $345.00 |
| Joanne Wuensch | Citigroup | Raises | Buy | $362.00 | $340.00 |
| Richard Newitter | Truist Securities | Raises | Hold | $345.00 | $330.00 |
| Jason Wittes | Roth MKM | Raises | Buy | $348.00 | $345.00 |
| Kyle Rose | Canaccord Genuity | Announces | Buy | $360.00 | - |
| Larry Biegelsen | Wells Fargo | Raises | Overweight | $364.00 | $336.00 |
| Shagun Singh | RBC Capital | Raises | Outperform | $345.00 | $315.00 |
Key Insights:
- Action Taken: Analysts frequently update their recommendations based on evolving market conditions and company performance. Whether they 'Maintain', 'Raise' or 'Lower' their stance, it reflects their reaction to recent developments related to Stryker. This information provides a snapshot of how analysts perceive the current state of the company.
- Rating: Unveiling insights, analysts deliver qualitative insights into stock performance, from 'Outperform' to 'Underperform'. These ratings convey expectations for the relative performance of Stryker compared to the broader market.
- Price Targets: Delving into movements, analysts provide estimates for the future value of Stryker's stock. This analysis reveals shifts in analysts' expectations over time.
Assessing these analyst evaluations alongside crucial financial indicators can provide a comprehensive overview of Stryker's market position. Stay informed and make well-judged decisions with the assistance of our Ratings Table.
Stay up to date on Stryker analyst ratings.
Get to Know Stryker Better
Stryker designs, manufactures, and markets an array of medical equipment, instruments, consumable supplies, and implantable devices. The product portfolio includes hip and knee replacements, endoscopy systems, operating room equipment, embolic coils, hospital beds and gurneys, and spinal devices. Stryker remains one of the three largest competitors in reconstructive orthopedic implants and holds the leadership position in operating room equipment. Just over one fourth of Stryker's total revenue currently comes from outside the United States.
Stryker's Financial Performance
Market Capitalization Analysis: The company's market capitalization is above the industry average, indicating that it is relatively larger in size compared to peers. This may suggest a higher level of investor confidence and market recognition.
Revenue Growth: Stryker displayed positive results in 3 months. As of 31 December, 2023, the company achieved a solid revenue growth rate of approximately 11.78%. This indicates a notable increase in the company's top-line earnings. In comparison to its industry peers, the company trails behind with a growth rate lower than the average among peers in the Health Care sector.
Net Margin: The company's net margin is a standout performer, exceeding industry averages. With an impressive net margin of 19.66%, the company showcases strong profitability and effective cost control.
Return on Equity (ROE): Stryker's ROE stands out, surpassing industry averages. With an impressive ROE of 6.26%, the company demonstrates effective use of equity capital and strong financial performance.
Return on Assets (ROA): Stryker's financial strength is reflected in its exceptional ROA, which exceeds industry averages. With a remarkable ROA of 2.93%, the company showcases efficient use of assets and strong financial health.
Debt Management: Stryker's debt-to-equity ratio surpasses industry norms, standing at 0.7. This suggests the company carries a substantial amount of debt, posing potential financial challenges.
How Are Analyst Ratings Determined?
Within the domain of banking and financial systems, analysts specialize in reporting for specific stocks or defined sectors. Their work involves attending company conference calls and meetings, researching company financial statements, and communicating with insiders to publish "analyst ratings" for stocks. Analysts typically assess and rate each stock once per quarter.
Some analysts also offer predictions for helpful metrics such as earnings, revenue, and growth estimates to provide further guidance as to what to do with certain tickers. It is important to keep in mind that while stock and sector analysts are specialists, they are also human and can only forecast their beliefs to traders.
This article was generated by Benzinga's automated content engine and reviewed by an editor.
© 2025 Benzinga.com. Benzinga does not provide investment advice. All rights reserved.