
JD.com (NASDAQ:JD) underwent analysis by 5 analysts in the last quarter, revealing a spectrum of viewpoints from bullish to bearish.
The following table provides a quick overview of their recent ratings, highlighting the changing sentiments over the past 30 days and comparing them to the preceding months.
| Bullish | Somewhat Bullish | Indifferent | Somewhat Bearish | Bearish | |
|---|---|---|---|---|---|
| Total Ratings | 4 | 1 | 0 | 0 | 0 |
| Last 30D | 2 | 0 | 0 | 0 | 0 |
| 1M Ago | 0 | 0 | 0 | 0 | 0 |
| 2M Ago | 2 | 1 | 0 | 0 | 0 |
| 3M Ago | 0 | 0 | 0 | 0 | 0 |
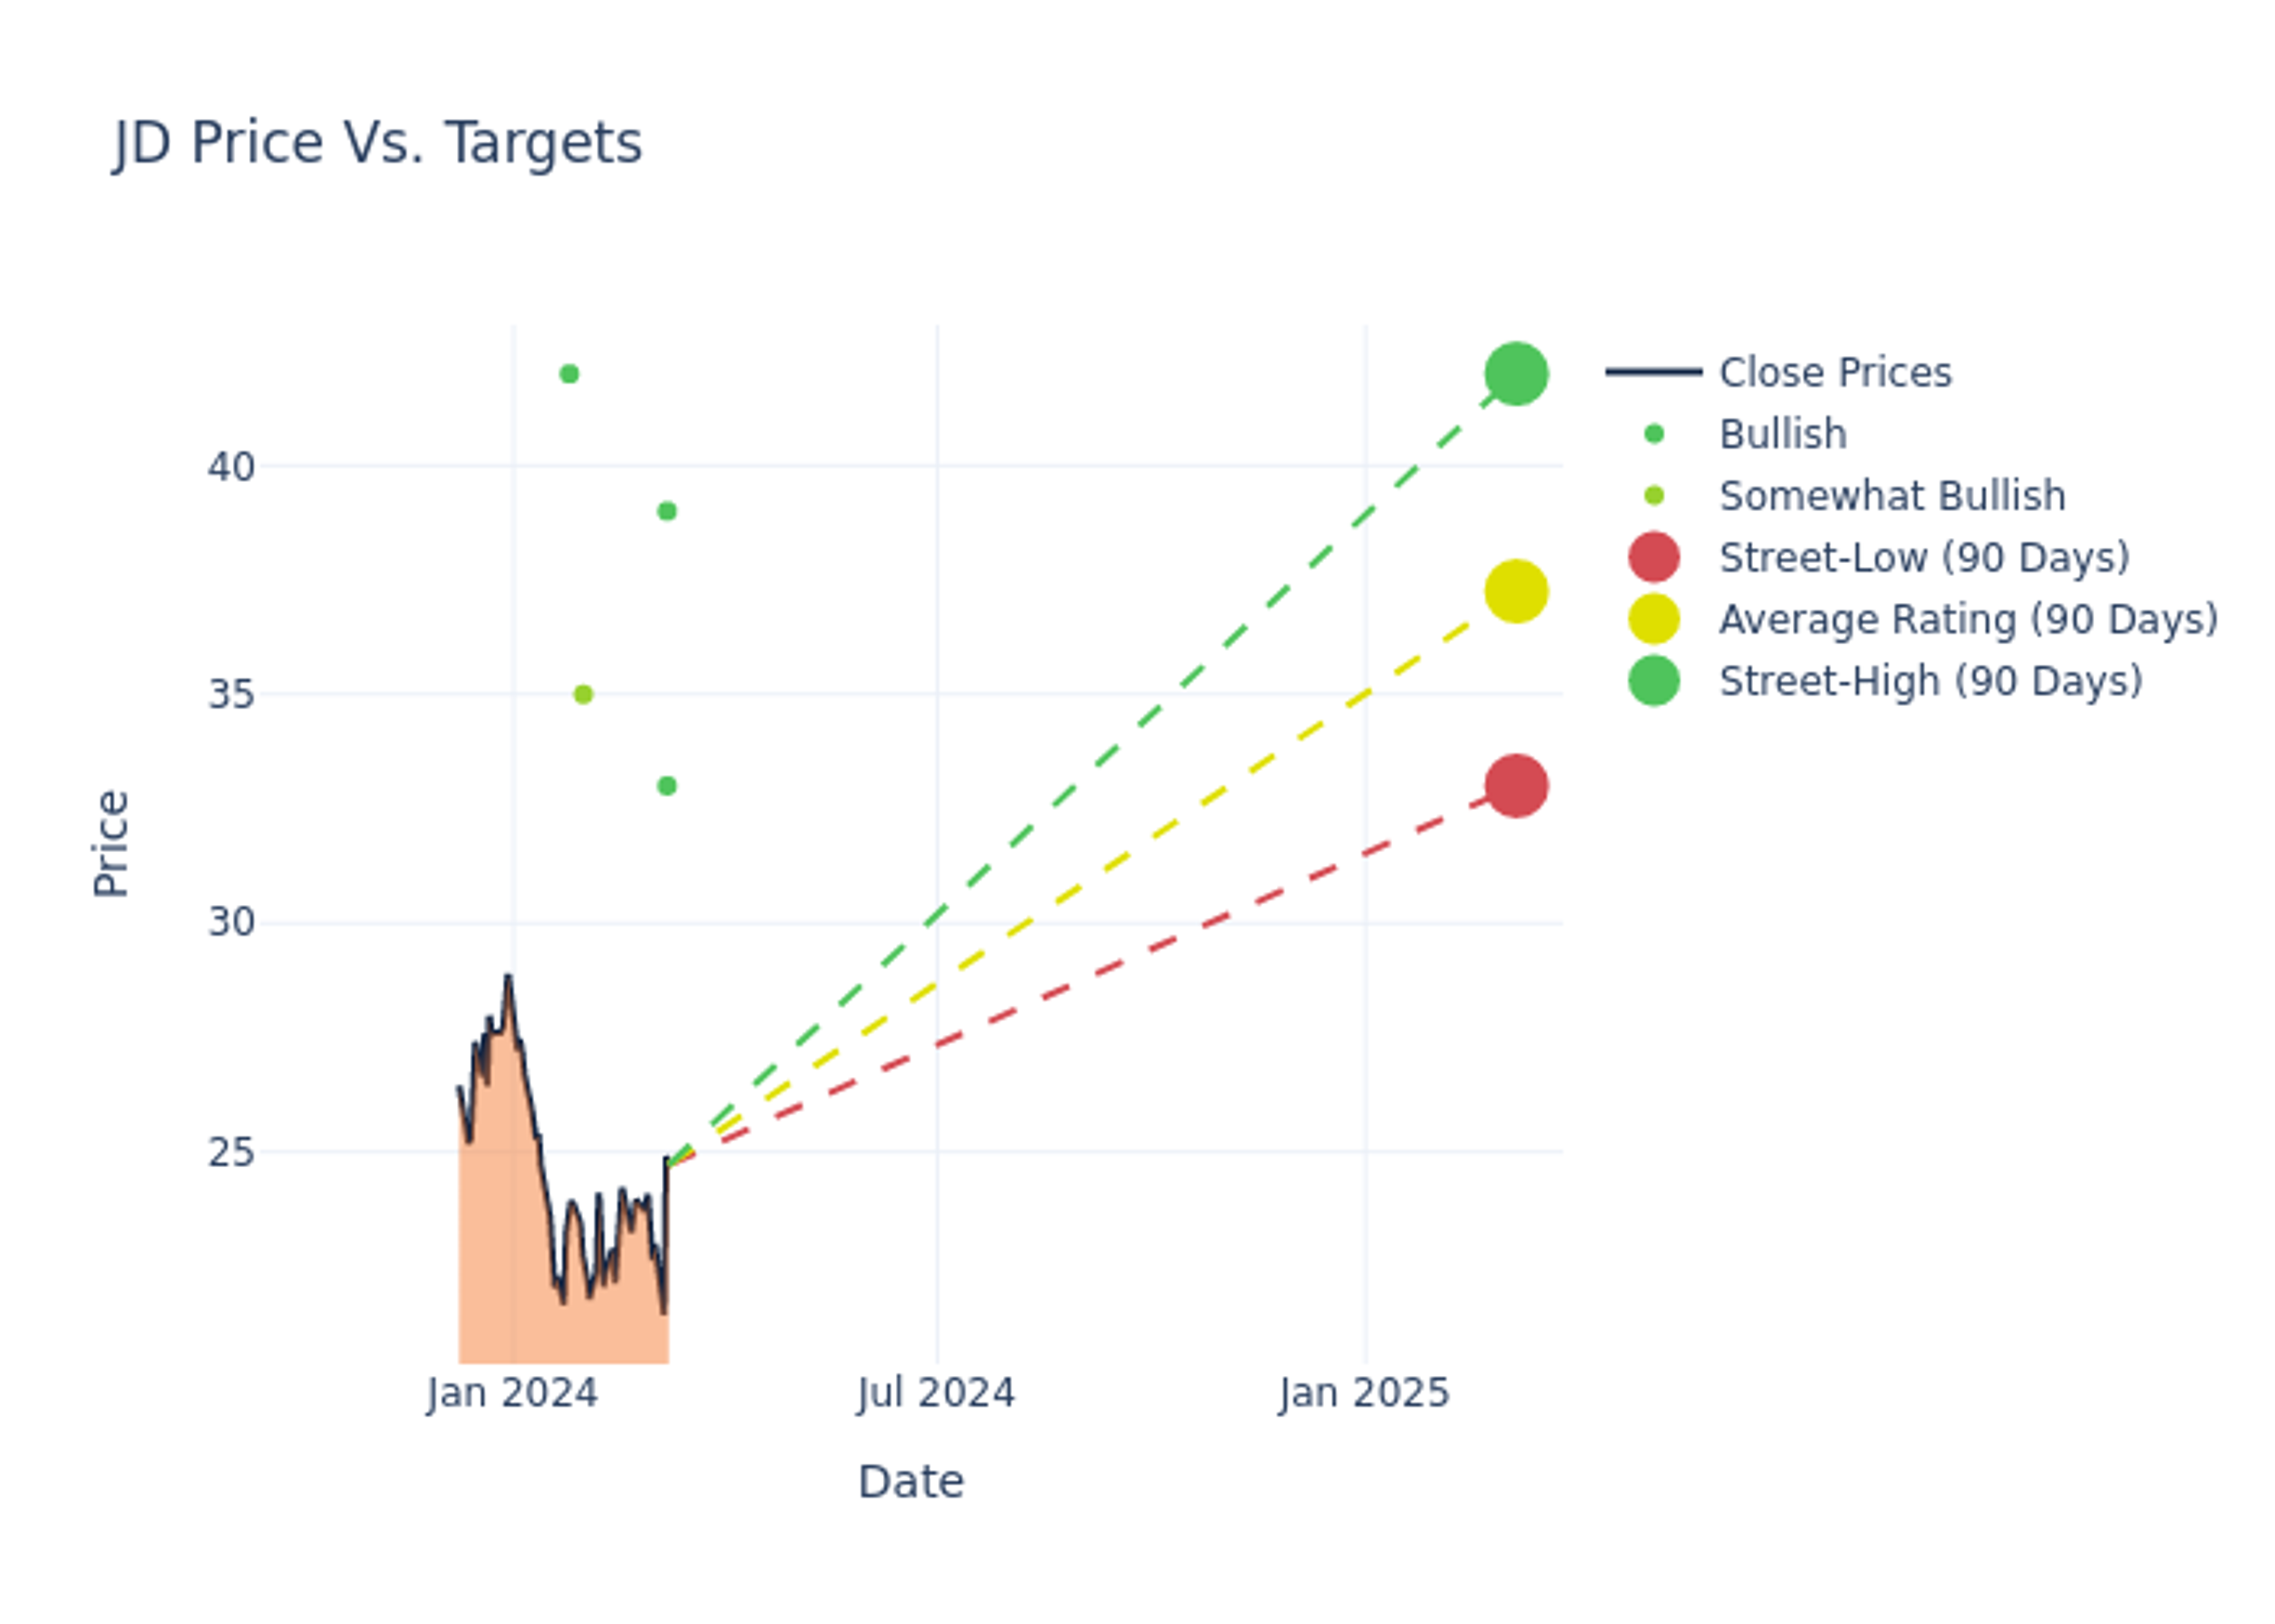
The 12-month price targets, analyzed by analysts, offer insights with an average target of $36.8, a high estimate of $42.00, and a low estimate of $33.00. Highlighting a 7.07% decrease, the current average has fallen from the previous average price target of $39.60.

Investigating Analyst Ratings: An Elaborate Study
A comprehensive examination of how financial experts perceive JD.com is derived from recent analyst actions. The following is a detailed summary of key analysts, their recent evaluations, and adjustments to ratings and price targets.
| Analyst | Analyst Firm | Action Taken | Rating | Current Price Target | Prior Price Target |
|---|---|---|---|---|---|
| Charlene Liu | HSBC | Raises | Buy | $39.00 | $38.00 |
| James Lee | Mizuho | Raises | Buy | $33.00 | $32.00 |
| Jiong Shao | Barclays | Lowers | Overweight | $35.00 | $45.00 |
| Alicia Yap | Citigroup | Lowers | Buy | $42.00 | $43.00 |
| James Lee | Mizuho | Lowers | Buy | $35.00 | $40.00 |
Key Insights:
- Action Taken: Analysts respond to changes in market conditions and company performance, frequently updating their recommendations. Whether they 'Maintain', 'Raise' or 'Lower' their stance, it reflects their reaction to recent developments related to JD.com. This information offers a snapshot of how analysts perceive the current state of the company.
- Rating: Analysts assign qualitative assessments to stocks, ranging from 'Outperform' to 'Underperform'. These ratings convey the analysts' expectations for the relative performance of JD.com compared to the broader market.
- Price Targets: Analysts predict movements in price targets, offering estimates for JD.com's future value. Examining the current and prior targets offers insights into analysts' evolving expectations.
Assessing these analyst evaluations alongside crucial financial indicators can provide a comprehensive overview of JD.com's market position. Stay informed and make well-judged decisions with the assistance of our Ratings Table.
Stay up to date on JD.com analyst ratings.
Discovering JD.com: A Closer Look
JD.com is a leading e-commerce platform with its 2022 China GMV being similar to Pinduoduo (GMV not reported), on our estimate, but still lower than Alibaba. it offers a wide selection of authentic products with speedy and reliable delivery. The company has built its own nationwide fulfilment infrastructure and last-mile delivery network, staffed by its own employees, which supports both its online direct sales, its online marketplace and omnichannel businesses.
JD.com: Delving into Financials
Market Capitalization: Indicating a reduced size compared to industry averages, the company's market capitalization poses unique challenges.
Revenue Growth: Over the 3 months period, JD.com showcased positive performance, achieving a revenue growth rate of 1.71% as of 30 September, 2023. This reflects a substantial increase in the company's top-line earnings. As compared to its peers, the revenue growth lags behind its industry peers. The company achieved a growth rate lower than the average among peers in Consumer Discretionary sector.
Net Margin: JD.com's financial strength is reflected in its exceptional net margin, which exceeds industry averages. With a remarkable net margin of 3.2%, the company showcases strong profitability and effective cost management.
Return on Equity (ROE): JD.com's ROE excels beyond industry benchmarks, reaching 3.51%. This signifies robust financial management and efficient use of shareholder equity capital.
Return on Assets (ROA): JD.com's financial strength is reflected in its exceptional ROA, which exceeds industry averages. With a remarkable ROA of 1.3%, the company showcases efficient use of assets and strong financial health.
Debt Management: The company maintains a balanced debt approach with a debt-to-equity ratio below industry norms, standing at 0.3.
The Significance of Analyst Ratings Explained
Benzinga tracks 150 analyst firms and reports on their stock expectations. Analysts typically arrive at their conclusions by predicting how much money a company will make in the future, usually the upcoming five years, and how risky or predictable that company's revenue streams are.
Analysts attend company conference calls and meetings, research company financial statements, and communicate with insiders to publish their ratings on stocks. Analysts typically rate each stock once per quarter or whenever the company has a major update.
Some analysts will also offer forecasts for metrics like growth estimates, earnings, and revenue to provide further guidance on stocks. Investors who use analyst ratings should note that this specialized advice comes from humans and may be subject to error.
This article was generated by Benzinga's automated content engine and reviewed by an editor.
© 2025 Benzinga.com. Benzinga does not provide investment advice. All rights reserved.