

- The S&P 500 index soars two standard deviations above its 50-day moving average, hitting a Bollinger Bands' sell signal.
- On average, the index had a 14.3% max drawdown following a Bollinger Bands' sell signal in the past five episodes.
- Get ahead of next week’s CPI & PPI with Chris Capre’s live trading strategy session this Sunday. Register Now →
A well-known technical indicator has just delivered a bearish signal for the S&P 500 index, which has previously been accurate in predicting market downturns.
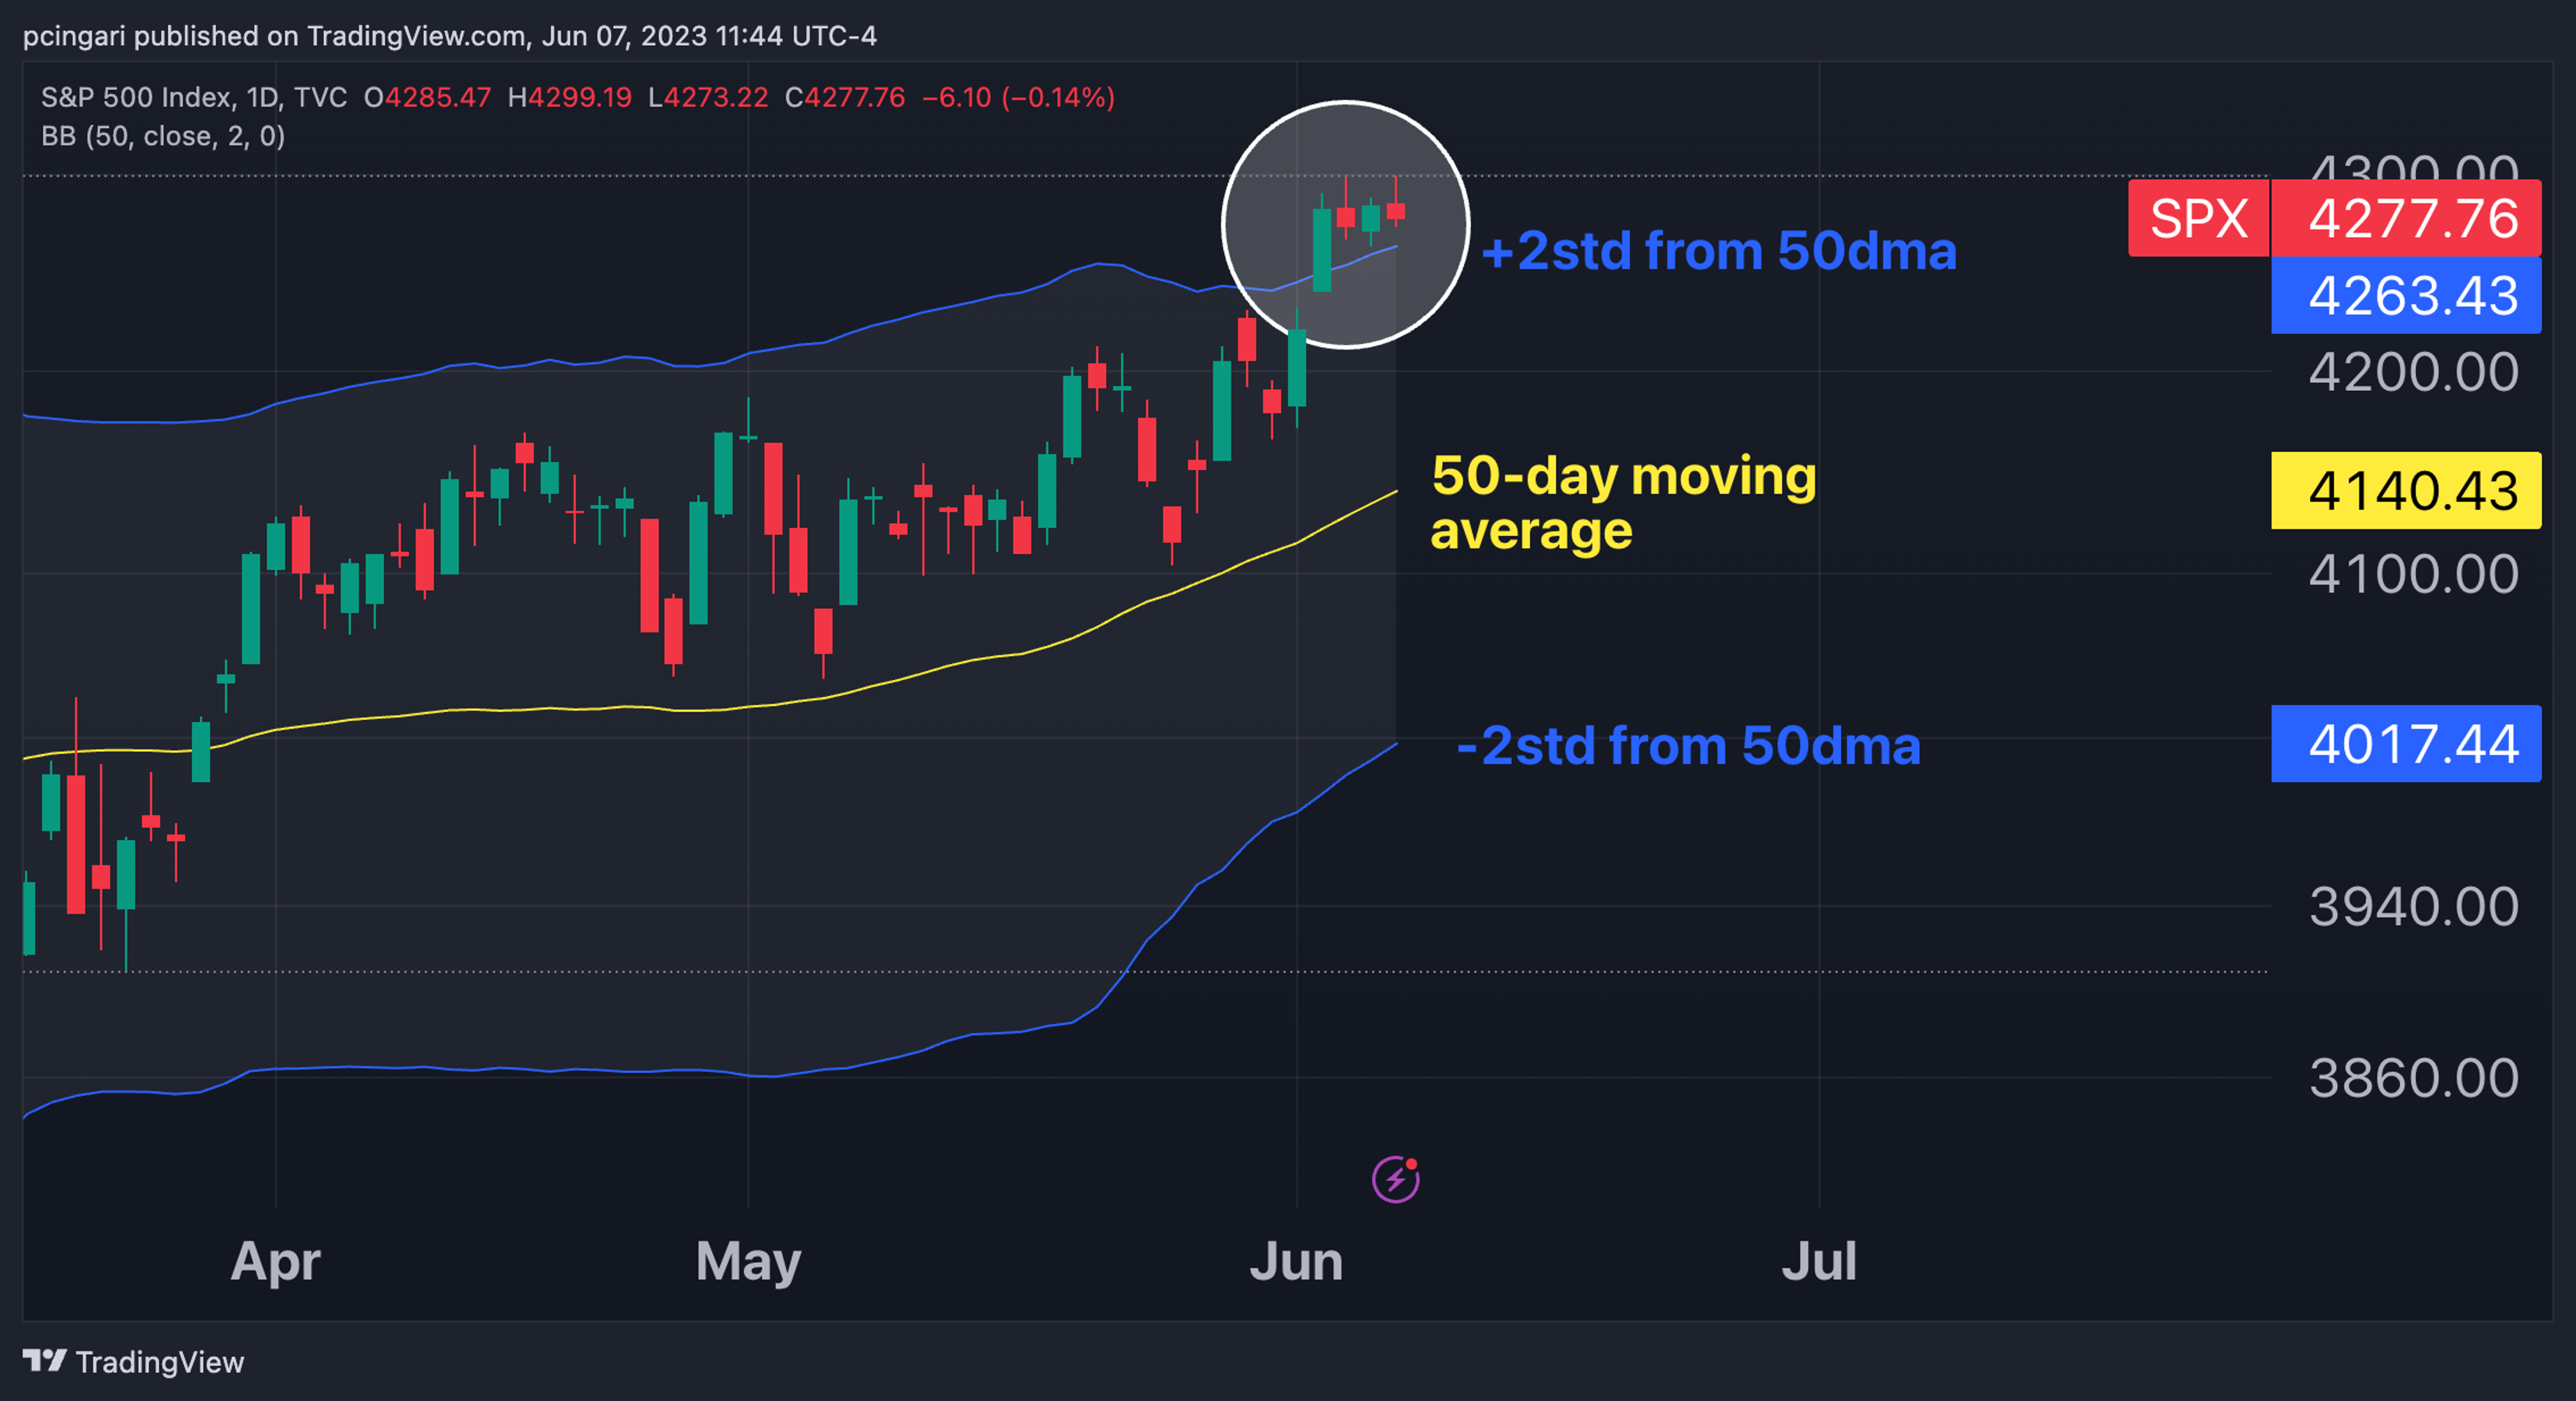
On Friday, June 2, the S&P 500 index, represented by the SPDR S&P 500 ETF Trust SPY, broke through the 4,250 level, surpassing its 50-day moving average by more than two standard deviations.
This technical indicator, developed by John Bollinger and know as Bollinger Bands, is commonly used by traders to identify overbought and oversold conditions, potential price breakouts and trend reversals.
When prices reach the upper Bollinger band, located two standard deviations away from the moving average, it indicates a sell signal, whereas touching the lower band signifies a buy signal.
Chart: S&P 500 Index Breaks Above 2 Standard Deviations From Its 50-Day Moving Average

Read Also: The SPY Tops Out, Beginning Bullish Consolidation Pattern: What To Watch In The Stock Market
History Suggests The U.S. Stock Market Is Poised To Drop From Here: A historical analysis of the S&P 500 index using the Bollinger indicator with the 50-day moving average and two standard deviations revealed intriguing findings:
- By the end of December 2021, the index broke 4,800 points, exceeding its 50-day moving average by 2 standard deviations. It subsequently dropped by a maximum of 14%.
- By the end of March 2022, the index hovered around 4,645, barely touching the upper Bollinger band. It then plunged by 21.3% until June 2022.
- In mid-August 2022, the S&P 500 index surpassed 4,300 points, triggering a bearish signal through the upper Bollinger band. It experienced an 18.5% decline until October 2022.
- At the beginning of December 2022, the index reached 4,100 points, crossing the sell signal threshold with the Bollinger indicator. Over the next three weeks, it fell by 8%.
- In early February 2023, the S&P 500 index climbed above 4,150 points, returning above the upper Bollinger bands, and subsequently dropped by 9.5% until mid-March.
- On average, the index had a 14.3% max drawdown following a Bollinger Bands' sell signal in the past five episodes.
- Based on the latest five observations, the S&P 500 bottoms out approximately 35 sessions after a sell signal is triggered by the Bollinger Bands indicator.
| Date of Bollinger Bands Signal | S&P 500 Levels | S&P 500 Subsequent Max Drop | Bottom Date |
|---|---|---|---|
| End-December 2021 | 4,800 | -14% | End-February 2022 |
| End-March 2022 | 4,645 | -21.3% | June 21, 2022 |
| Mid-August 2022 | 4,300 | -18.5% | October 12, 2022 |
| Early December 2022 | 4,100 | -8% | December 21, 2022 |
| Early February 2023 | 4,150 | -9.5% | March 13, 2023 |
Chart: Bollinger Bands Strategy Applied To S&P 500 Index Since 2022
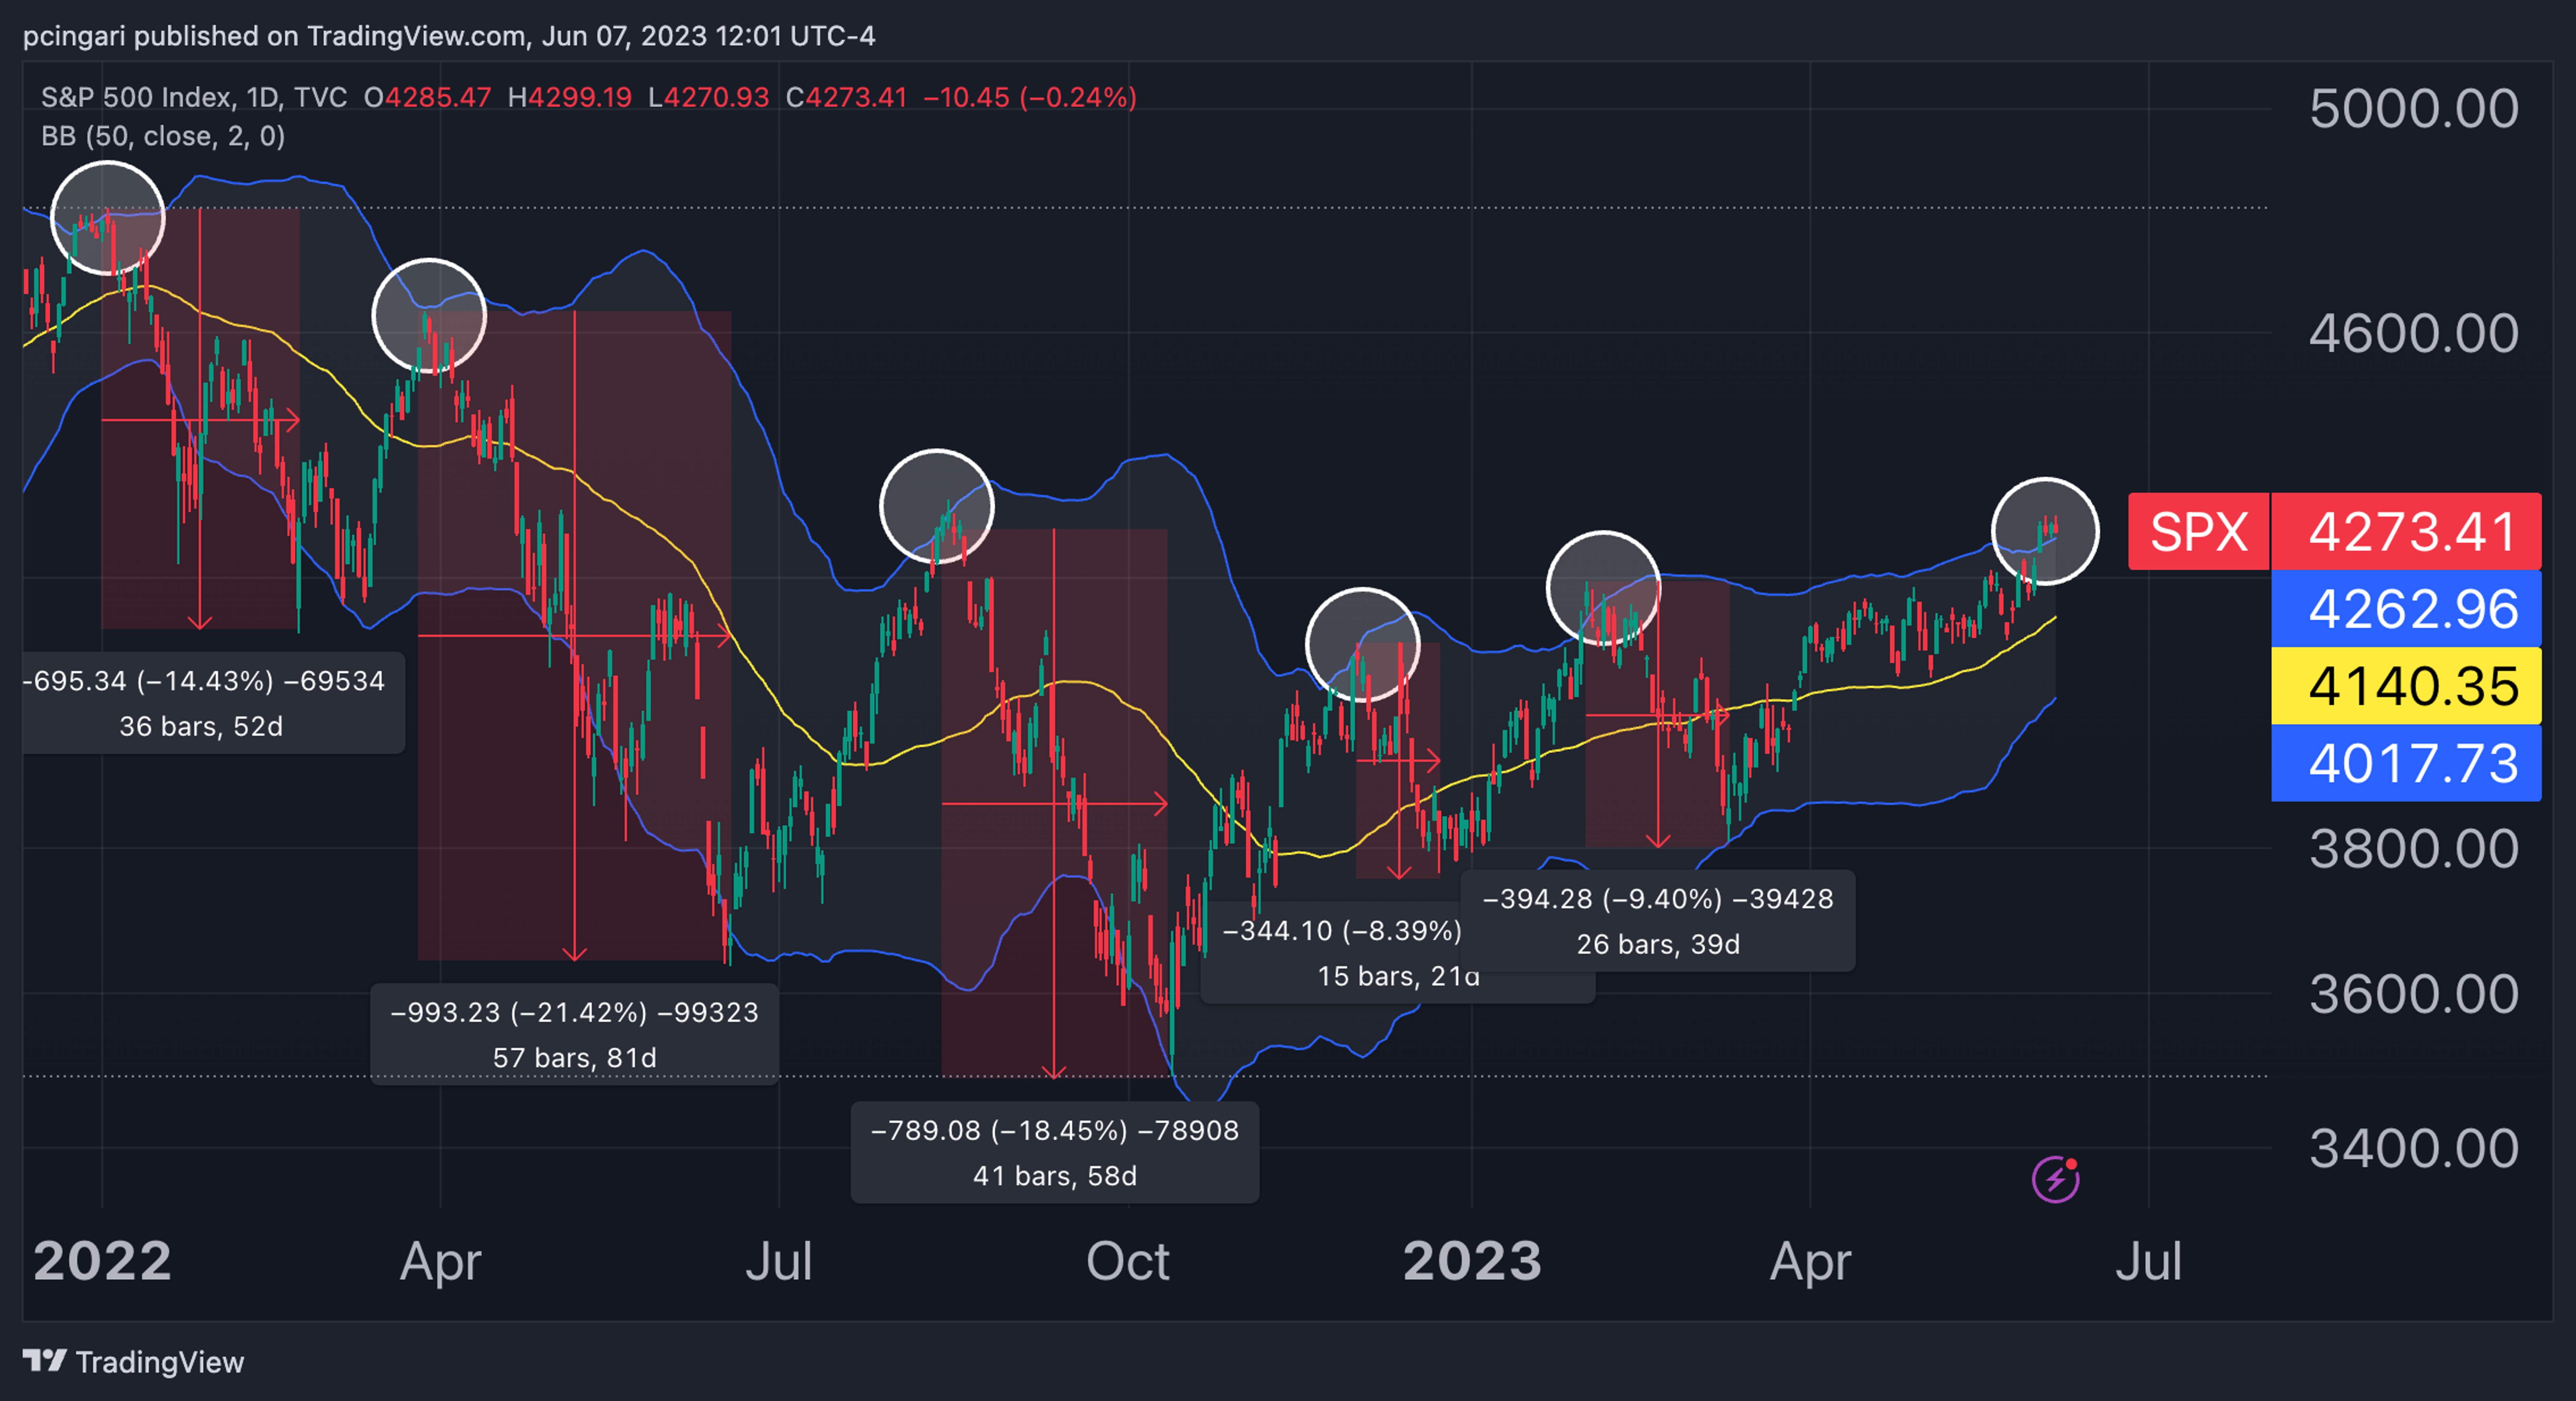
Photo: Shutterstock
Edge Rankings
Price Trend
© 2025 Benzinga.com. Benzinga does not provide investment advice. All rights reserved.