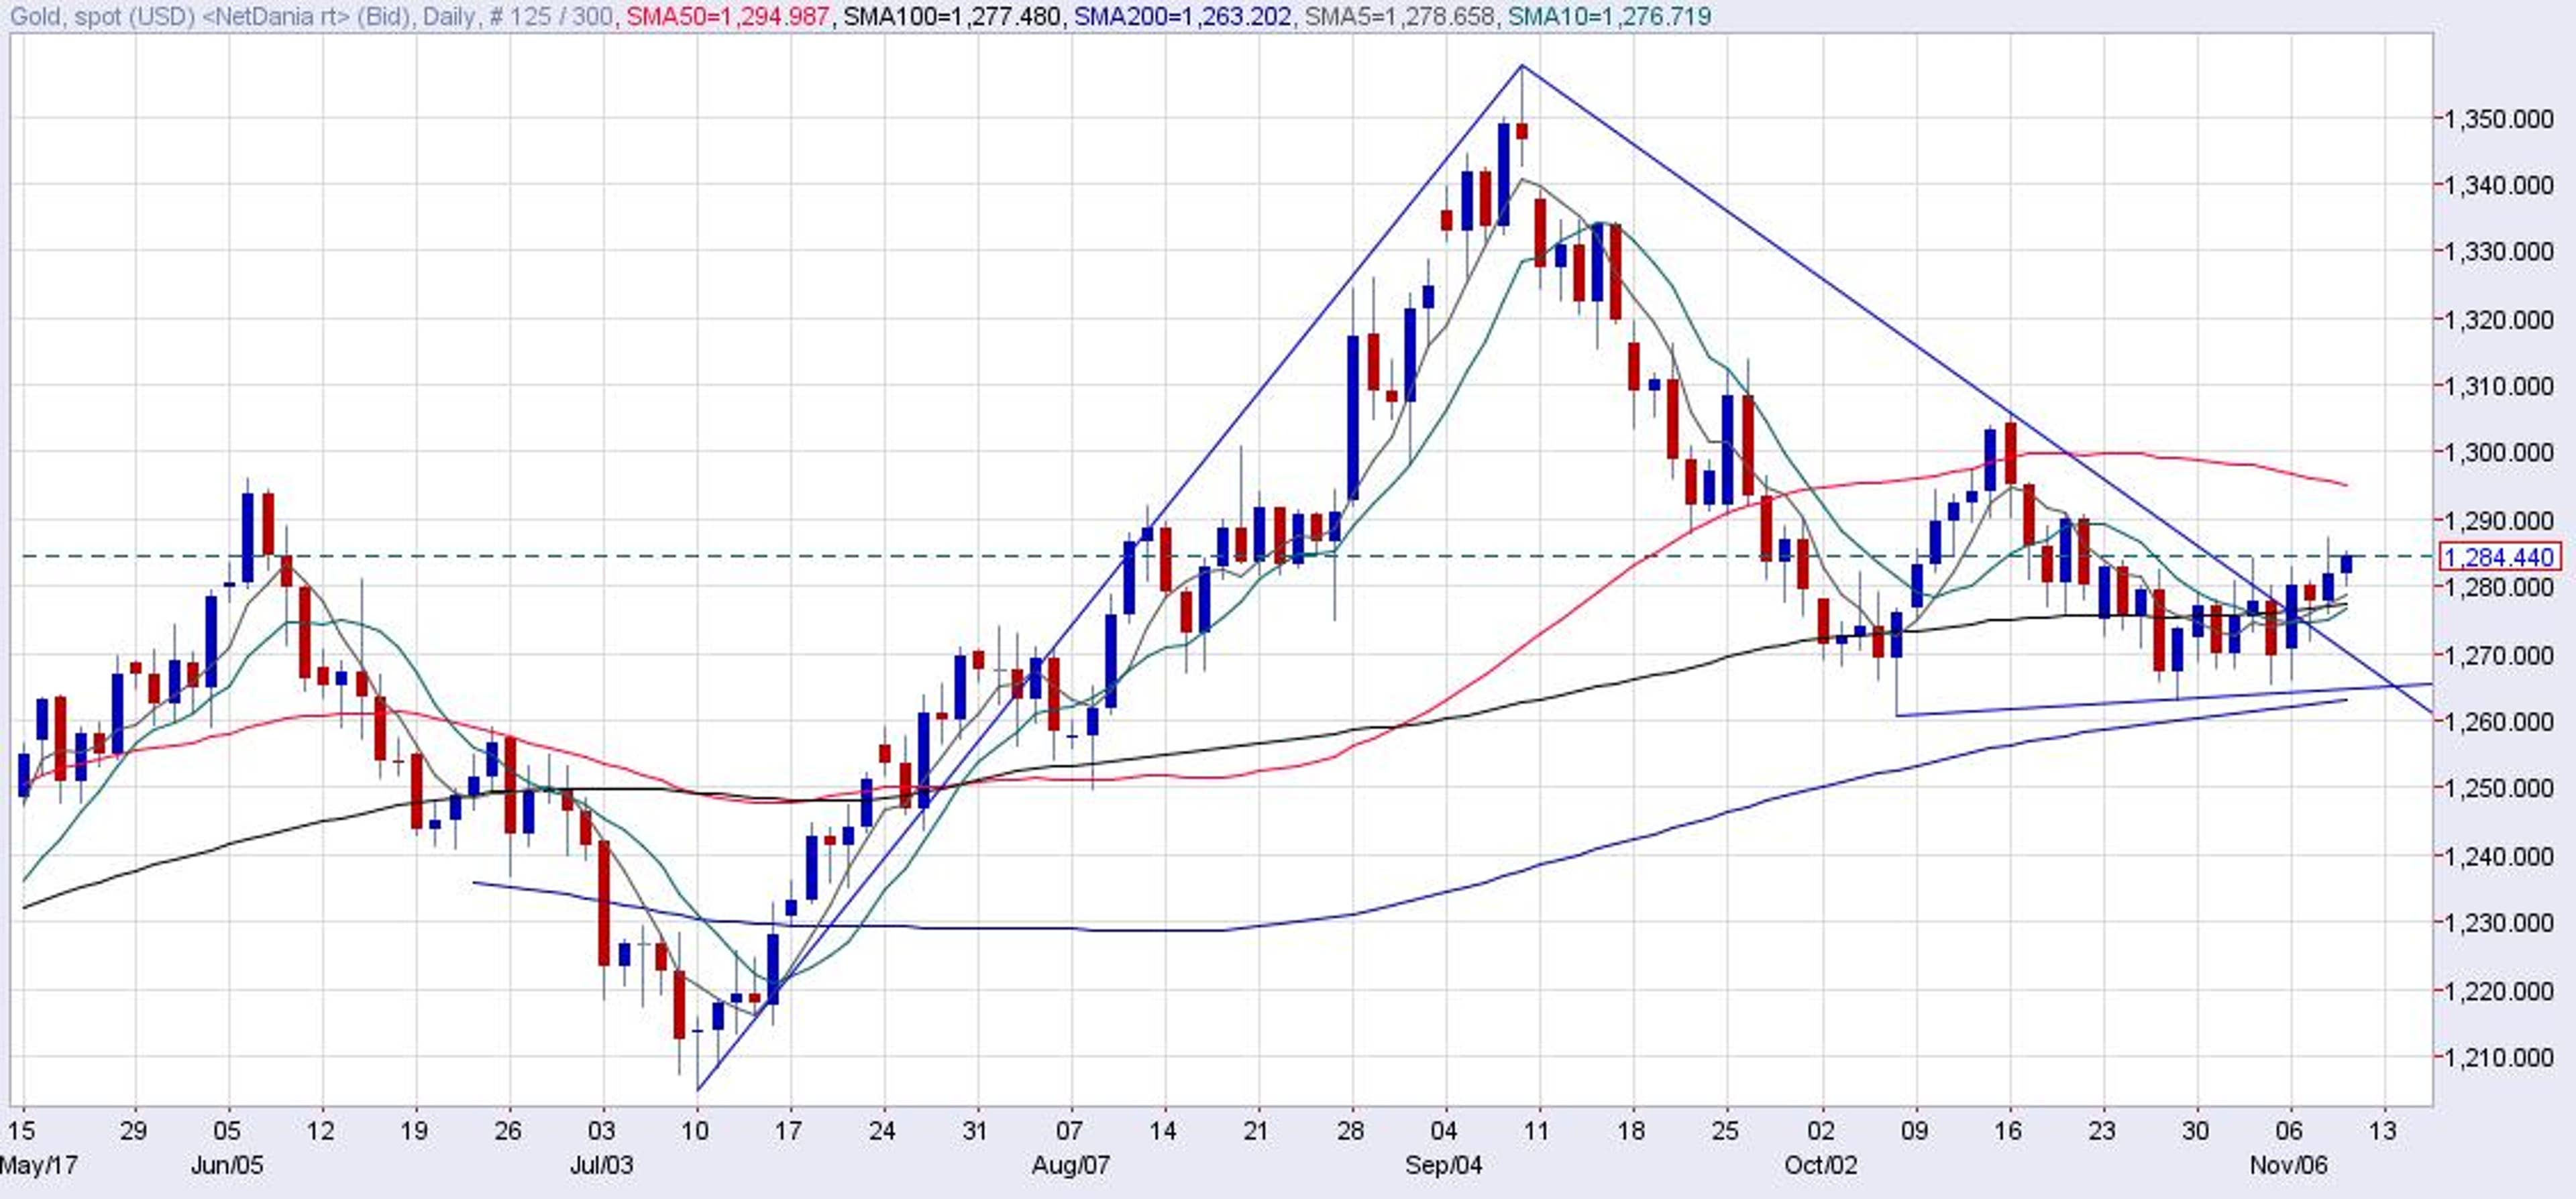
- Descending triangle breakout signals continuation of the rally from the July low $1204.70.
- Big jump in open positions in the call options points to bullish sentiment in the options market.
Gold (XAU/USD) looks set to test $1300 levels sooner rather than later. Prices may have retreated from yesterday's three-week high of $1287, giving an impression of a weak bullish move, although the price chart and the options market activity point indicate better days ahead of the safe haven yellow metal.
As of writing, the metal is trading at $1283.70/Oz levels.
Daily chart
The bullish story doesn't end here. A look at the options market activity indicates strong demand for the bullish bets (call options).
Gold OGZ7 Open Interest (OI) Change: Current (Nov 8 - Prelim) vs. Nov 1
Call Summary
Total ITM OTM
OI Chg OI Chg OI Chg
277,148 8,322 31,890 342 245,258 7,980
Put Summary
Total ITM OTM
OI Chg OI Chg OI Chg
170,488 1,667 22,432 17 148,056 1,650
Over the last one week, the open interest or open positions in the call options jumped by 8322 contracts. Meanwhile, put options added only 1667 contracts. Clearly, the investors have positioned for a rally in gold prices.
Open interest change
Source: CME
The above chart shows-
- $1300 call has added 3304 contracts last week. Meanwhile, $1270 put added 1090 contracts.
- Big jump in the OI in $1300 call suggests the yellow metal is seen rallying at least to $1300 levels in the short-run.
View
- Gold is likely to test $1300-$1306.05 (Oct. 6 high). A violation there would confirm a double bottom reversal and shall open up upside towards the September high of $1357.52.
- On the downside, a break below the 200-day MA level of $1263 would revive the bearish move.
© 2026 Benzinga.com. Benzinga does not provide investment advice. All rights reserved.
To add Benzinga News as your preferred source on Google, click here.
Posted In: