Benzinga

España
Italia
대한민국
日本
Français
Benzinga Edge
Benzinga Research
Benzinga Pro

  • Get Benzinga Pro
  • Data & APIs
  • Events
  • Premarket
  • Advertise
Contribute
España
Italia
대한민국
日本
Français

Benzinga

  • Premium Services
  • Financial News
    Latest
    Earnings
    Guidance
    Dividends
    M&A
    Buybacks
    Interviews
    Management
    Offerings
    IPOs
    Insider Trades
    Biotech/FDA
    Politics
    Healthcare
    Small-Cap
  • Markets
    Pre-Market
    After Hours
    Movers
    ETFs
    Options
    Cryptocurrency
    Commodities
    Bonds
    Futures
    Mining
    Real Estate
    Volatility
  • Ratings
    Analyst Color
    Downgrades
    Upgrades
    Initiations
    Price Target
  • Investing Ideas
    Trade Ideas
    Long Ideas
    Short Ideas
    Technicals
    Analyst Ratings
    Analyst Color
    Latest Rumors
    Whisper Index
    Stock of the Day
    Best Stocks & ETFs
    Best Penny Stocks
    Best S&P 500 ETFs
    Best Swing Trade Stocks
    Best Blue Chip Stocks
    Best High-Volume Penny Stocks
    Best Small Cap ETFs
    Best Stocks to Day Trade
    Best REITs
  • Money
    Investing
    Cryptocurrency
    Mortgage
    Insurance
    Yield
    Personal Finance
    Forex
    Startup Investing
    Real Estate Investing
    Prop Trading
    Credit Cards
    Stock Brokers
Research
My Stocks
Tools
Free Benzinga Pro Trial
Calendars
Analyst Ratings Calendar
Conference Call Calendar
Dividend Calendar
Earnings Calendar
Economic Calendar
FDA Calendar
Guidance Calendar
IPO Calendar
M&A Calendar
Unusual Options Activity Calendar
SPAC Calendar
Stock Split Calendar
Trade Ideas
Free Stock Reports
Insider Trades
Trade Idea Feed
Analyst Ratings
Unusual Options Activity
Heatmaps
Free Newsletter
Government Trades
Perfect Stock Portfolio
Easy Income Portfolio
Short Interest
Most Shorted
Largest Increase
Largest Decrease
Calculators
Margin Calculator
Forex Profit Calculator
100x Options Profit Calculator
Screeners
Stock Screener
Top Momentum Stocks
Top Quality Stocks
Top Value Stocks
Top Growth Stocks
Compare Best Stocks
Best Momentum Stocks
Best Quality Stocks
Best Value Stocks
Best Growth Stocks
Connect With Us
facebookinstagramlinkedintwitteryoutubeblueskymastodon
About Benzinga
  • About Us
  • Careers
  • Advertise
  • Contact Us
Market Resources
  • Advanced Stock Screener Tools
  • Options Trading Chain Analysis
  • Comprehensive Earnings Calendar
  • Dividend Investor Calendar and Alerts
  • Economic Calendar and Market Events
  • IPO Calendar and New Listings
  • Market Outlook and Analysis
  • Wall Street Analyst Ratings and Targets
Trading Tools & Education
  • Benzinga Pro Trading Platform
  • Options Trading Strategies and News
  • Stock Market Trading Ideas and Analysis
  • Technical Analysis Charts and Indicators
  • Fundamental Analysis and Valuation
  • Day Trading Guides and Strategies
  • Live Investors Events
  • Pre market Stock Analysis and News
  • Cryptocurrency Market Analysis and News
Ring the Bell

A newsletter built for market enthusiasts by market enthusiasts. Top stories, top movers, and trade ideas delivered to your inbox every weekday before and after the market closes.

  • Terms & Conditions
  • Do Not Sell My Personal Data/Privacy Policy
  • Disclaimer
  • Service Status
  • Sitemap
© 2026 Benzinga | All Rights Reserved
January 12, 2024 12:00 PM 5 min read

Forecasting The Future: 10 Analyst Projections For Teleflex

by Benzinga Insights Benzinga Staff Writer
Follow
TFX Logo
TFXTeleflex Inc
$104.37-1.05%
Overview

Providing a diverse range of perspectives from bullish to bearish, 10 analysts have published ratings on Teleflex (NYSE:TFX) in the last three months.

Summarizing their recent assessments, the table below illustrates the evolving sentiments in the past 30 days and compares them to the preceding months.

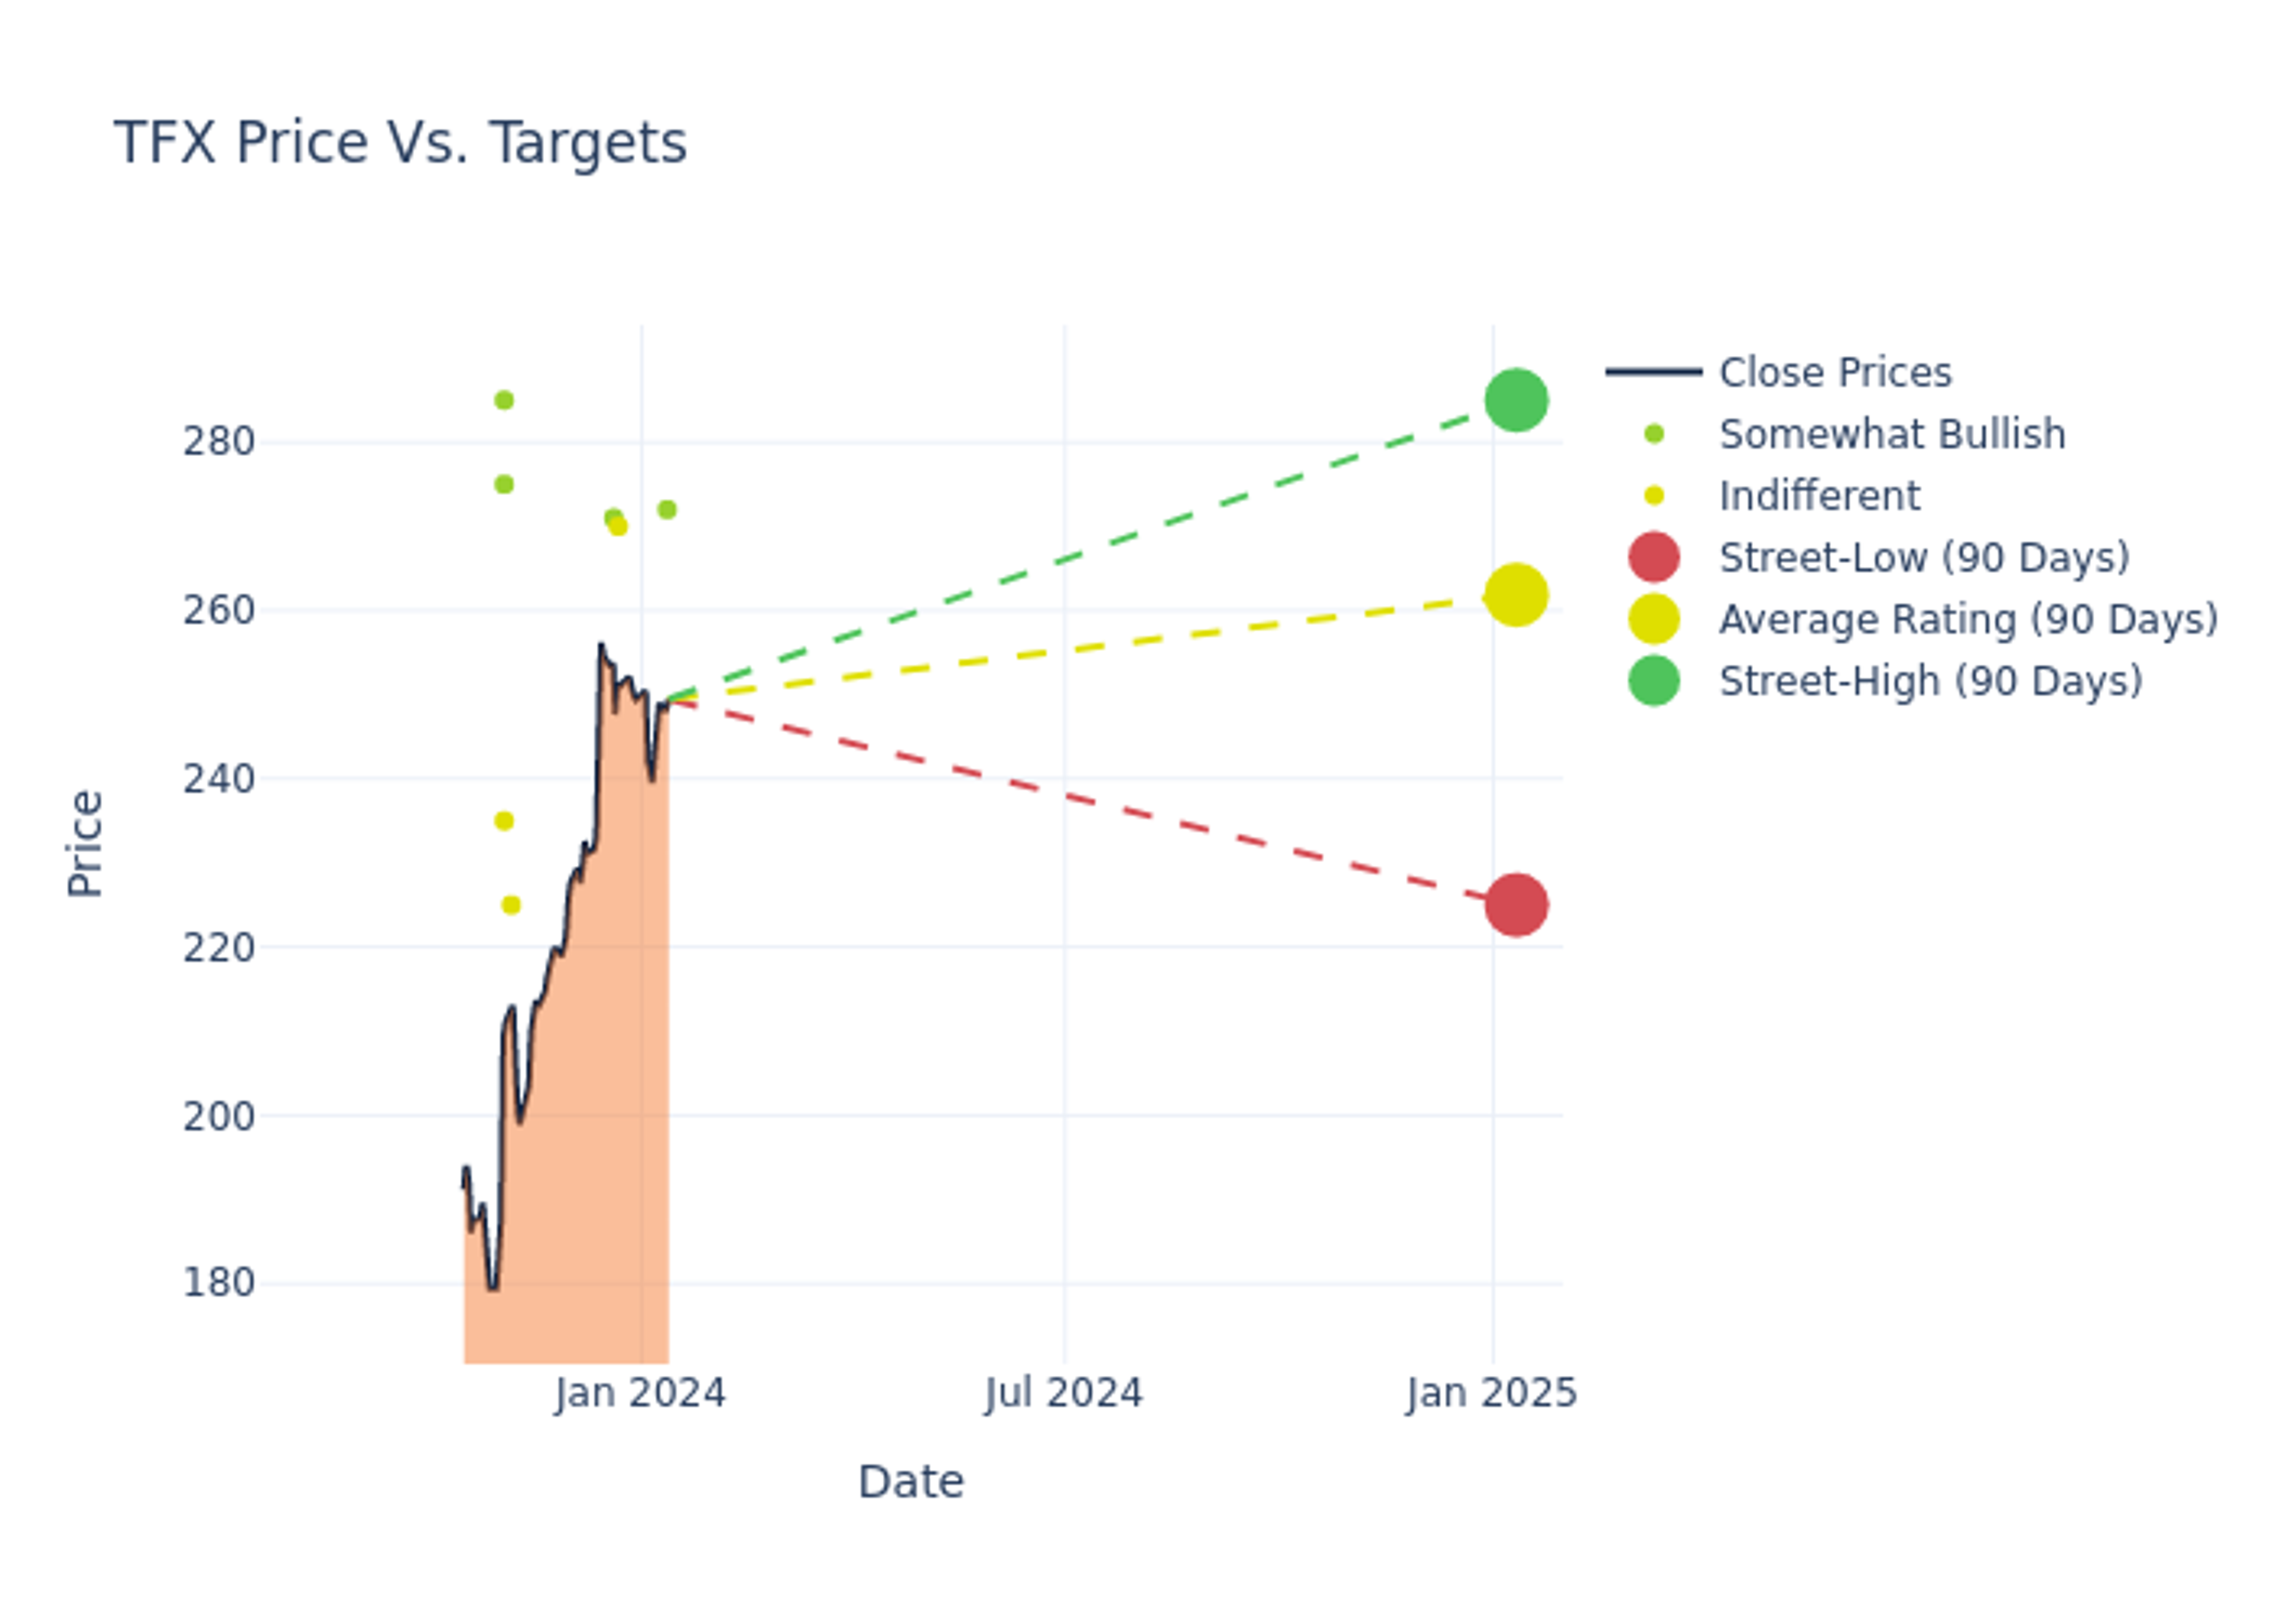
Insights from analysts' 12-month price targets are revealed, presenting an average target of $250.7, a high estimate of $285.00, and a low estimate of $221.00. This upward trend is evident, with the current average reflecting a 7.24% increase from the previous average price target of $233.78.

Analyzing Analyst Ratings: A Detailed Breakdown

The standing of Teleflex among financial experts becomes clear with a thorough analysis of recent analyst actions. The summary below outlines key analysts, their recent evaluations, and adjustments to ratings and price targets.

Key Insights:

Analyzing these analyst evaluations alongside relevant financial metrics can provide a comprehensive view of Teleflex's market position. Stay informed and make data-driven decisions with the assistance of our Ratings Table.

Stay up to date on Teleflex analyst ratings.

Delving into Teleflex's Background

Teleflex: Delving into Financials

Market Capitalization Analysis: Falling below industry benchmarks, the company's market capitalization reflects a reduced size compared to peers. This positioning may be influenced by factors such as growth expectations or operational capacity.

Positive Revenue Trend: Examining Teleflex's financials over 3 months reveals a positive narrative. The company achieved a noteworthy revenue growth rate of 8.68% as of 30 September, 2023, showcasing a substantial increase in top-line earnings. When compared to others in the Health Care sector, the company faces challenges, achieving a growth rate lower than the average among peers.

Net Margin: Teleflex's net margin is impressive, surpassing industry averages. With a net margin of 18.37%, the company demonstrates strong profitability and effective cost management.

Return on Equity (ROE): Teleflex's ROE is below industry averages, indicating potential challenges in efficiently utilizing equity capital. With an ROE of 3.22%, the company may face hurdles in achieving optimal financial returns.

Return on Assets (ROA): The company's ROA is a standout performer, exceeding industry averages. With an impressive ROA of 1.91%, the company showcases effective utilization of assets.

Debt Management: Teleflex's debt-to-equity ratio is below the industry average at 0.5, reflecting a lower dependency on debt financing and a more conservative financial approach.

The Basics of Analyst Ratings

Ratings come from analysts, or specialists within banking and financial systems that report for specific stocks or defined sectors (typically once per quarter for each stock). Analysts usually derive their information from company conference calls and meetings, financial statements, and conversations with important insiders to reach their decisions.

Some analysts publish their predictions for metrics such as growth estimates, earnings, and revenue to provide additional guidance with their ratings. When using analyst ratings, it is important to keep in mind that stock and sector analysts are also human and are only offering their opinions to investors.

If you want to keep track of which analysts are outperforming others, you can view updated analyst ratings along withanalyst success scores in Benzinga Pro.

This article was generated by Benzinga's automated content engine and reviewed by an editor.

Market News and Data brought to you by Benzinga APIs

© 2026 Benzinga.com. Benzinga does not provide investment advice. All rights reserved.


Posted In:
Analyst RatingsBZI-AAR
Bullish Somewhat Bullish Indifferent Somewhat Bearish Bearish
Total Ratings 0 5 5 0 0
Last 30D 0 1 0 0 0
1M Ago 0 1 1 0 0
2M Ago 0 0 0 0 0
3M Ago 0 3 4 0 0
Analyst Analyst Firm Action Taken Rating Current Price Target Prior Price Target
Shagun Singh RBC Capital Raises Outperform $272.00 $228.00
Richard Newitter Truist Securities Raises Hold $270.00 $221.00
Jayson Bedford Raymond James Raises Outperform $271.00 $227.00
Matt O'Brien Piper Sandler Raises Neutral $225.00 $210.00
Richard Newitter Truist Securities Raises Hold $221.00 $210.00
Anthony Petrone Mizuho Raises Neutral $235.00 $225.00
David Turkaly JMP Securities Lowers Market Outperform $285.00 $315.00
Shagun Singh RBC Capital Raises Outperform $228.00 $218.00
George Sellers Stephens & Co. Maintains Overweight $275.00 -
Anthony Petrone Mizuho Lowers Neutral $225.00 $250.00
  • Action Taken: Analysts respond to changes in market conditions and company performance, frequently updating their recommendations. Whether they 'Maintain', 'Raise' or 'Lower' their stance, it reflects their reaction to recent developments related to Teleflex. This information offers a snapshot of how analysts perceive the current state of the company.
  • Rating: Unveiling insights, analysts deliver qualitative insights into stock performance, from 'Outperform' to 'Underperform'. These ratings convey expectations for the relative performance of Teleflex compared to the broader market.
  • Price Targets: Analysts explore the dynamics of price targets, providing estimates for the future value of Teleflex's stock. This examination reveals shifts in analysts' expectations over time.

Teleflex is a Wayne, Pennsylvania-based manufacturer of hospital supplies and medical devices primarily in the bloodstream/vascular and surgical areas. The firm reports results across seven segments: vascular access (24% of 2022 sales), interventional (16%), anesthesia (14%), surgical (14%), interventional urology (12%), original-equipment manufacturing (10%), and all other (10%). Geographic exposure for the business is primarily in the U.S., which accounts for 60% of revenue, with international markets making up the remainder.

TFX Logo
TFXTeleflex Inc
$104.37-1.05%
Overview
Comments
Loading...