
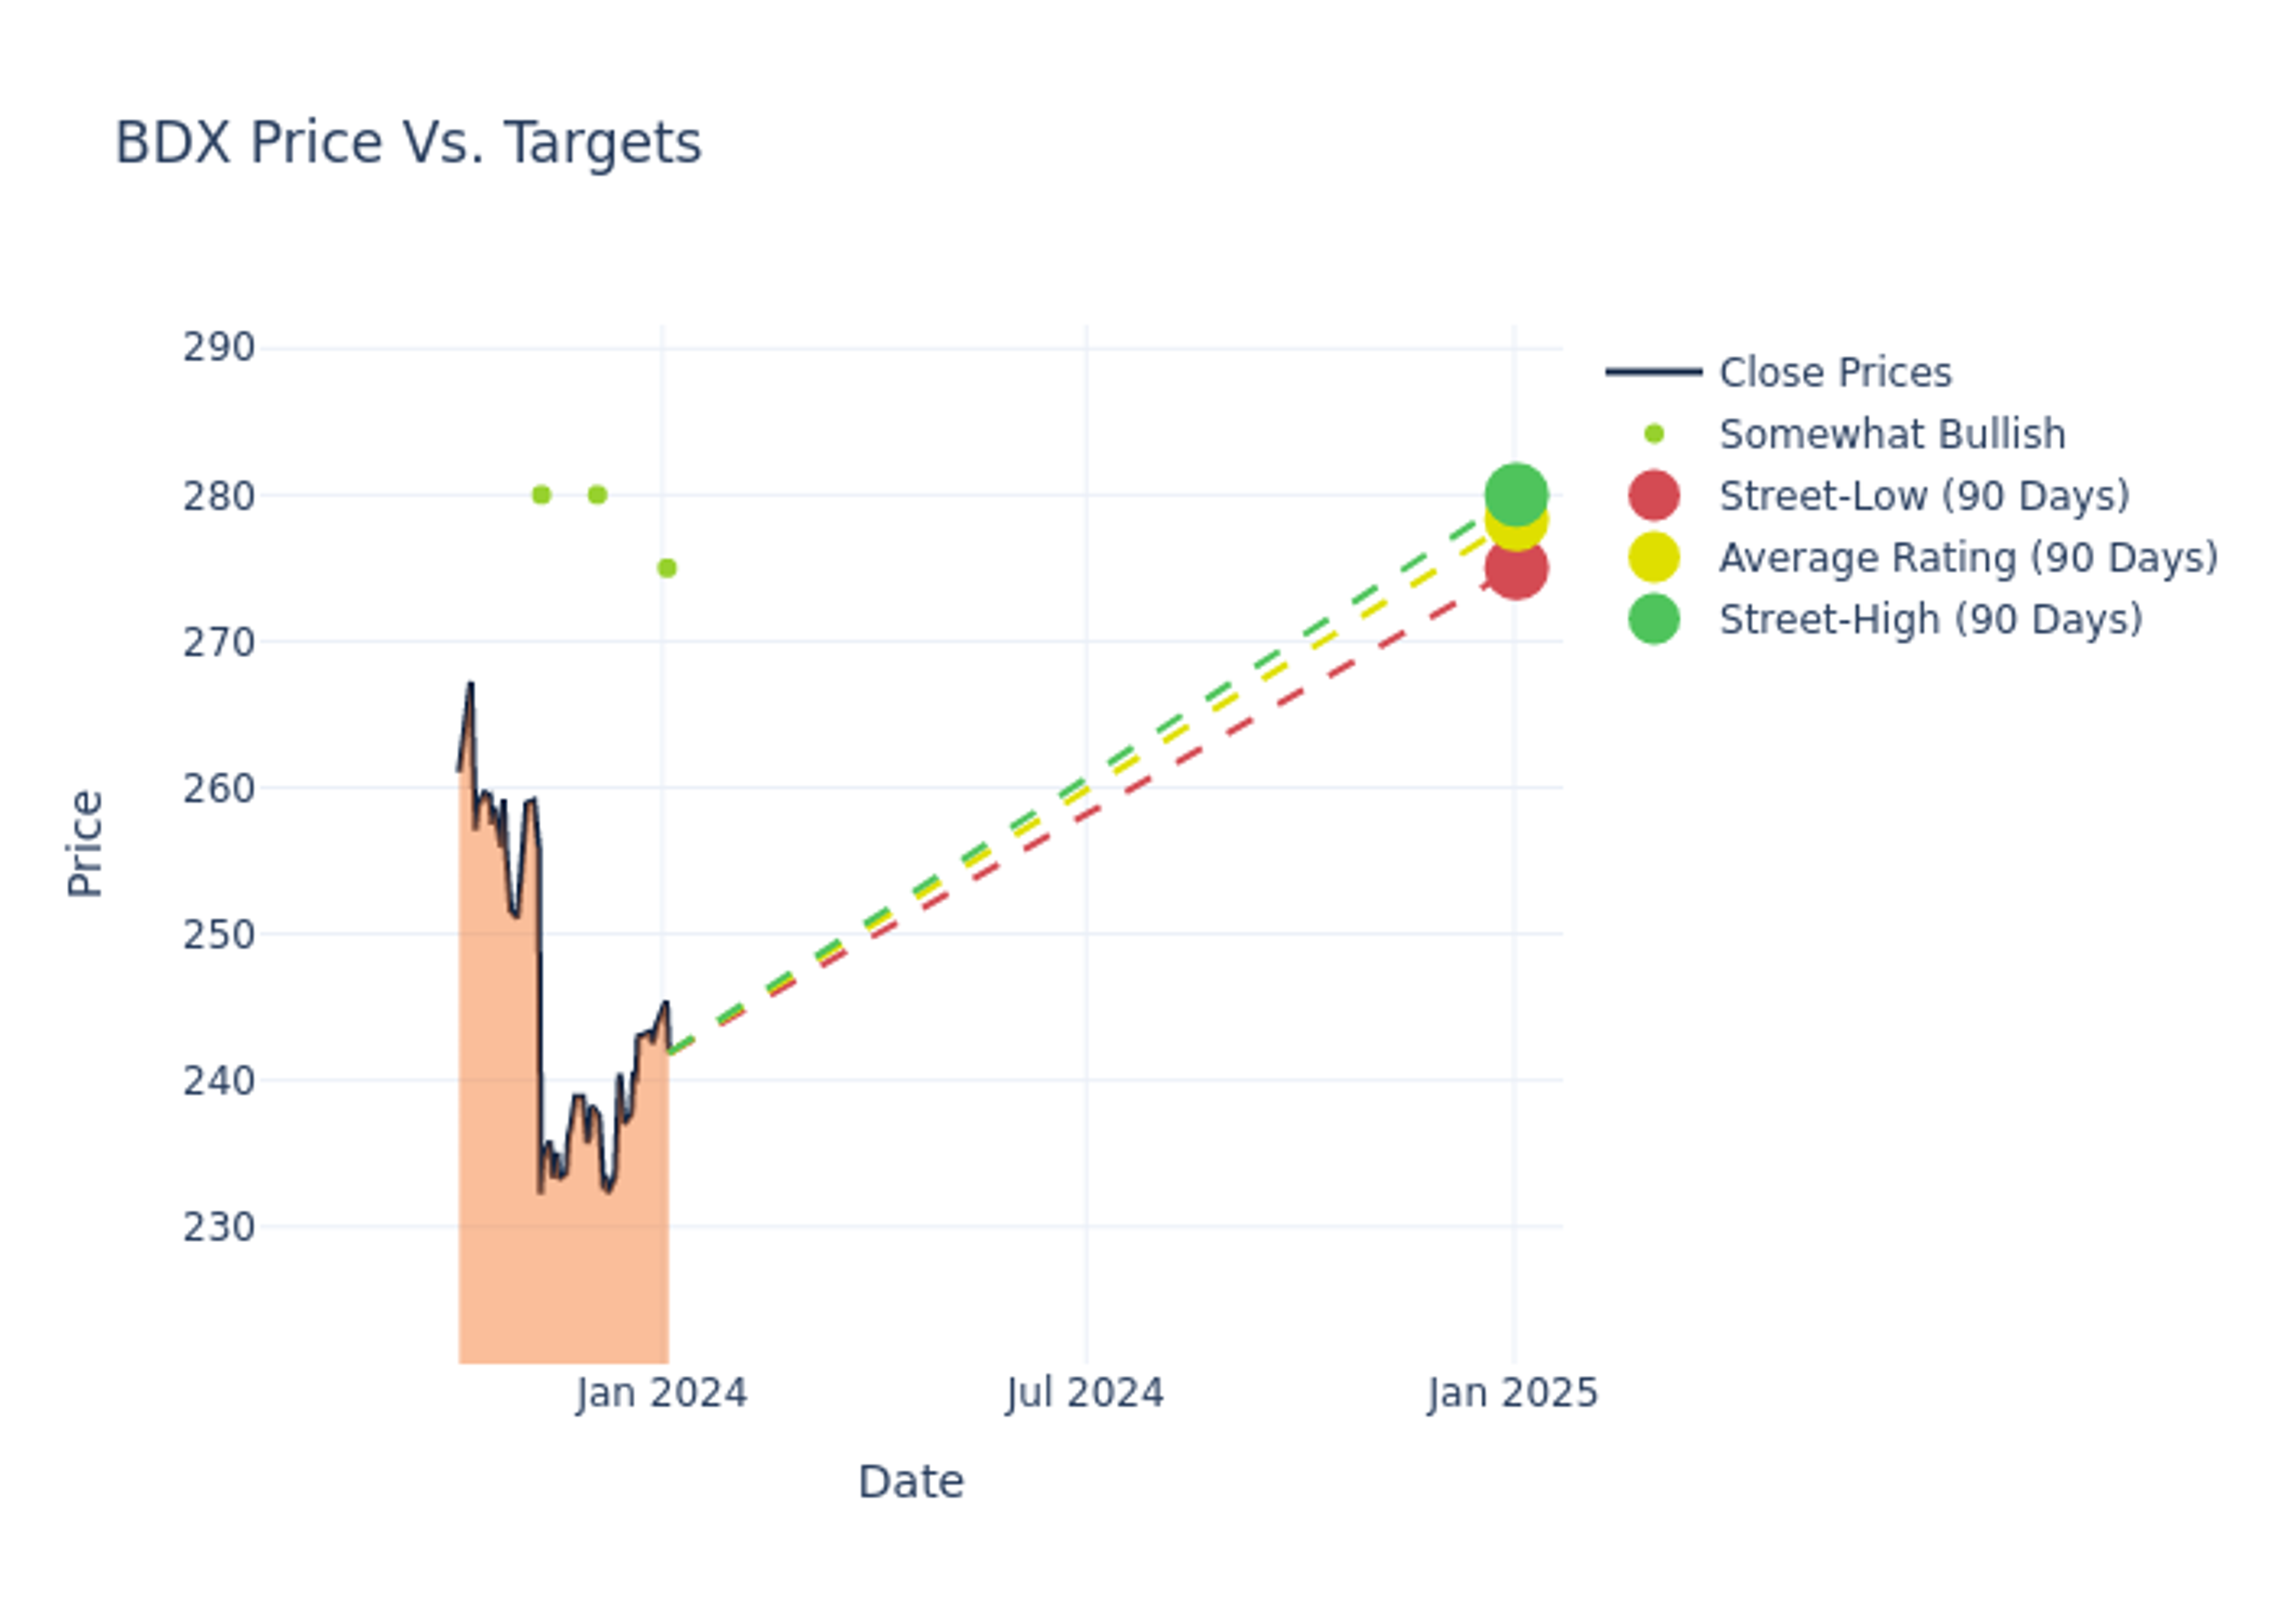
Across the recent three months, 4 analysts have shared their insights on Becton Dickinson (NYSE:BDX), expressing a variety of opinions spanning from bullish to bearish.
The following table provides a quick overview of their recent ratings, highlighting the changing sentiments over the past 30 days and comparing them to the preceding months.
| Bullish | Somewhat Bullish | Indifferent | Somewhat Bearish | Bearish | |
|---|---|---|---|---|---|
| Total Ratings | 0 | 4 | 0 | 0 | 0 |
| Last 30D | 0 | 1 | 0 | 0 | 0 |
| 1M Ago | 0 | 1 | 0 | 0 | 0 |
| 2M Ago | 0 | 2 | 0 | 0 | 0 |
| 3M Ago | 0 | 0 | 0 | 0 | 0 |
Analysts provide deeper insights through their assessments of 12-month price targets, revealing an average target of $276.0, a high estimate of $280.00, and a low estimate of $269.00. A 7.07% drop is evident in the current average compared to the previous average price target of $297.00.

Understanding Analyst Ratings: A Comprehensive Breakdown
A comprehensive examination of how financial experts perceive Becton Dickinson is derived from recent analyst actions. The following is a detailed summary of key analysts, their recent evaluations, and adjustments to ratings and price targets.
| Analyst | Analyst Firm | Action Taken | Rating | Current Price Target | Prior Price Target |
|---|---|---|---|---|---|
| Jayson Bedford | Raymond James | Raises | Outperform | $275.00 | $269.00 |
| Patrick Wood | Morgan Stanley | Lowers | Overweight | $280.00 | $310.00 |
| Jason Bednar | Piper Sandler | Lowers | Overweight | $280.00 | $305.00 |
| Jayson Bedford | Raymond James | Lowers | Outperform | $269.00 | $304.00 |
Key Insights:
- Action Taken: Analysts adapt their recommendations to changing market conditions and company performance. Whether they 'Maintain', 'Raise' or 'Lower' their stance, it reflects their response to recent developments related to Becton Dickinson. This information provides a snapshot of how analysts perceive the current state of the company.
- Rating: Providing a comprehensive analysis, analysts offer qualitative assessments, ranging from 'Outperform' to 'Underperform'. These ratings reflect expectations for the relative performance of Becton Dickinson compared to the broader market.
- Price Targets: Gaining insights, analysts provide estimates for the future value of Becton Dickinson's stock. This comparison reveals trends in analysts' expectations over time.
For valuable insights into Becton Dickinson's market performance, consider these analyst evaluations alongside crucial financial indicators. Stay well-informed and make prudent decisions using our Ratings Table.
Stay up to date on Becton Dickinson analyst ratings.
Unveiling the Story Behind Becton Dickinson
Becton, Dickinson is the world's largest manufacturer and distributor of medical surgical products, such as needles, syringes, and sharps-disposal units. The company also manufactures pre-filled devices, diagnostic instruments and reagents, as well as flow cytometry and cell-imaging systems. BD Medical is nearly half of the total business, while BD Life Sciences (26% of estimated 2023 revenue) and BD Interventional (25%) account for the remainder. International revenue accounts for 43% of the company's business.
Unraveling the Financial Story of Becton Dickinson
Market Capitalization Analysis: Above industry benchmarks, the company's market capitalization emphasizes a noteworthy size, indicative of a strong market presence.
Revenue Growth: Becton Dickinson displayed positive results in 3 months. As of 30 September, 2023, the company achieved a solid revenue growth rate of approximately 6.85%. This indicates a notable increase in the company's top-line earnings. When compared to others in the Health Care sector, the company faces challenges, achieving a growth rate lower than the average among peers.
Net Margin: Becton Dickinson's net margin is below industry standards, pointing towards difficulties in achieving strong profitability. With a net margin of 2.12%, the company may encounter challenges in effective cost control.
Return on Equity (ROE): Becton Dickinson's ROE is below industry averages, indicating potential challenges in efficiently utilizing equity capital. With an ROE of 0.42%, the company may face hurdles in achieving optimal financial returns.
Return on Assets (ROA): Becton Dickinson's ROA is below industry standards, pointing towards difficulties in efficiently utilizing assets. With an ROA of 0.2%, the company may encounter challenges in delivering satisfactory returns from its assets.
Debt Management: Becton Dickinson's debt-to-equity ratio is below the industry average. With a ratio of 0.62, the company relies less on debt financing, maintaining a healthier balance between debt and equity, which can be viewed positively by investors.
Analyst Ratings: What Are They?
Ratings come from analysts, or specialists within banking and financial systems that report for specific stocks or defined sectors (typically once per quarter for each stock). Analysts usually derive their information from company conference calls and meetings, financial statements, and conversations with important insiders to reach their decisions.
In addition to their assessments, some analysts extend their insights by offering predictions for key metrics such as earnings, revenue, and growth estimates. This supplementary information provides further guidance for traders. It is crucial to recognize that, despite their specialization, analysts are human and can only provide forecasts based on their beliefs.
This article was generated by Benzinga's automated content engine and reviewed by an editor.
© 2025 Benzinga.com. Benzinga does not provide investment advice. All rights reserved.