In-Depth Analysis: Meta Platforms Versus Competitors In Interactive Media & Services Industry


20-Year Pro Trader Reveals His "MoneyLine"

Ditch your indicators and use the "MoneyLine". A simple line tells you when to buy and sell without the guesswork. It’s a line on a chart that’s helped Nic Chahine win 83% of his options buys. Here's how he does it.


In today's rapidly changing and highly competitive business world, it is imperative for investors and industry observers to carefully assess companies before making investment choices. In this article, we will undertake a comprehensive industry comparison, evaluating Meta Platforms (NASDAQ:META) vis-à-vis its key competitors in the Interactive Media & Services industry. Through a detailed analysis of important financial indicators, market standing, and growth potential, our goal is to provide valuable insights and highlight company's performance in the industry.

Meta Platforms Background

Meta is the world's largest online social network, with nearly 4 billion family of apps monthly active users. Users engage with each other in different ways, exchanging messages and sharing news events, photos, and videos. The firm's ecosystem consists mainly of the Facebook app, Instagram, Messenger, WhatsApp, and many features surrounding these products. Users can access Facebook on mobile devices and desktops. Advertising revenue represents more than 90% of the firm's total revenue, with more than 45% coming from the U.S. and Canada and over 20% from Europe.

CompanyP/EP/BP/SROEEBITDA (in billions)Gross Profit (in billions)Revenue Growth
Meta Platforms Inc33.228.229.639.47%$20.11$32.4224.7%
Alphabet Inc26.026.626.257.43%$26.04$48.7313.49%
Baidu Inc13.731.091.990.77%$3.64$17.535.67%
Kanzhun Ltd101.394.2410.893.23%$0.26$1.3436.32%
ZoomInfo Technologies Inc58.702.845.08-0.25%$0.24$0.274.91%
IAC Inc17.790.751.055.39%$0.64$0.75-15.12%
TripAdvisor Inc397.864.412.263.78%$0.07$0.3510.17%
Ziff Davis Inc70.901.542.153.43%$0.15$0.34-1.72%
Yelp Inc28.963.562.153.68%$0.04$0.3110.76%
CarGurus Inc121.054.012.87-3.56%$-0.01$0.17-22.19%
Weibo Corp5.620.721.302.45%$0.13$0.35-2.52%
Getty Images Holdings Inc85.202.731.916.56%$0.03$0.16-2.39%
Shutterstock Inc15.183.111.91-0.19%$0.02$0.12-0.23%
Average78.532.973.322.73%$2.6$5.873.1%

When analyzing Meta Platforms, the following trends become evident:

  • With a Price to Earnings ratio of 33.22, which is 0.42x less than the industry average, the stock shows potential for growth at a reasonable price, making it an interesting consideration for market participants.

  • The elevated Price to Book ratio of 8.22 relative to the industry average by 2.77x suggests company might be overvalued based on its book value.

  • The stock's relatively high Price to Sales ratio of 9.63, surpassing the industry average by 2.9x, may indicate an aspect of overvaluation in terms of sales performance.

  • The Return on Equity (ROE) of 9.47% is 6.74% above the industry average, highlighting efficient use of equity to generate profits.

  • The company has higher Earnings Before Interest, Taxes, Depreciation, and Amortization (EBITDA) of $20.11 Billion, which is 7.73x above the industry average, indicating stronger profitability and robust cash flow generation.

  • The gross profit of $32.42 Billion is 5.52x above that of its industry, highlighting stronger profitability and higher earnings from its core operations.

  • The company's revenue growth of 24.7% exceeds the industry average of 3.1%, indicating strong sales performance and market outperformance.

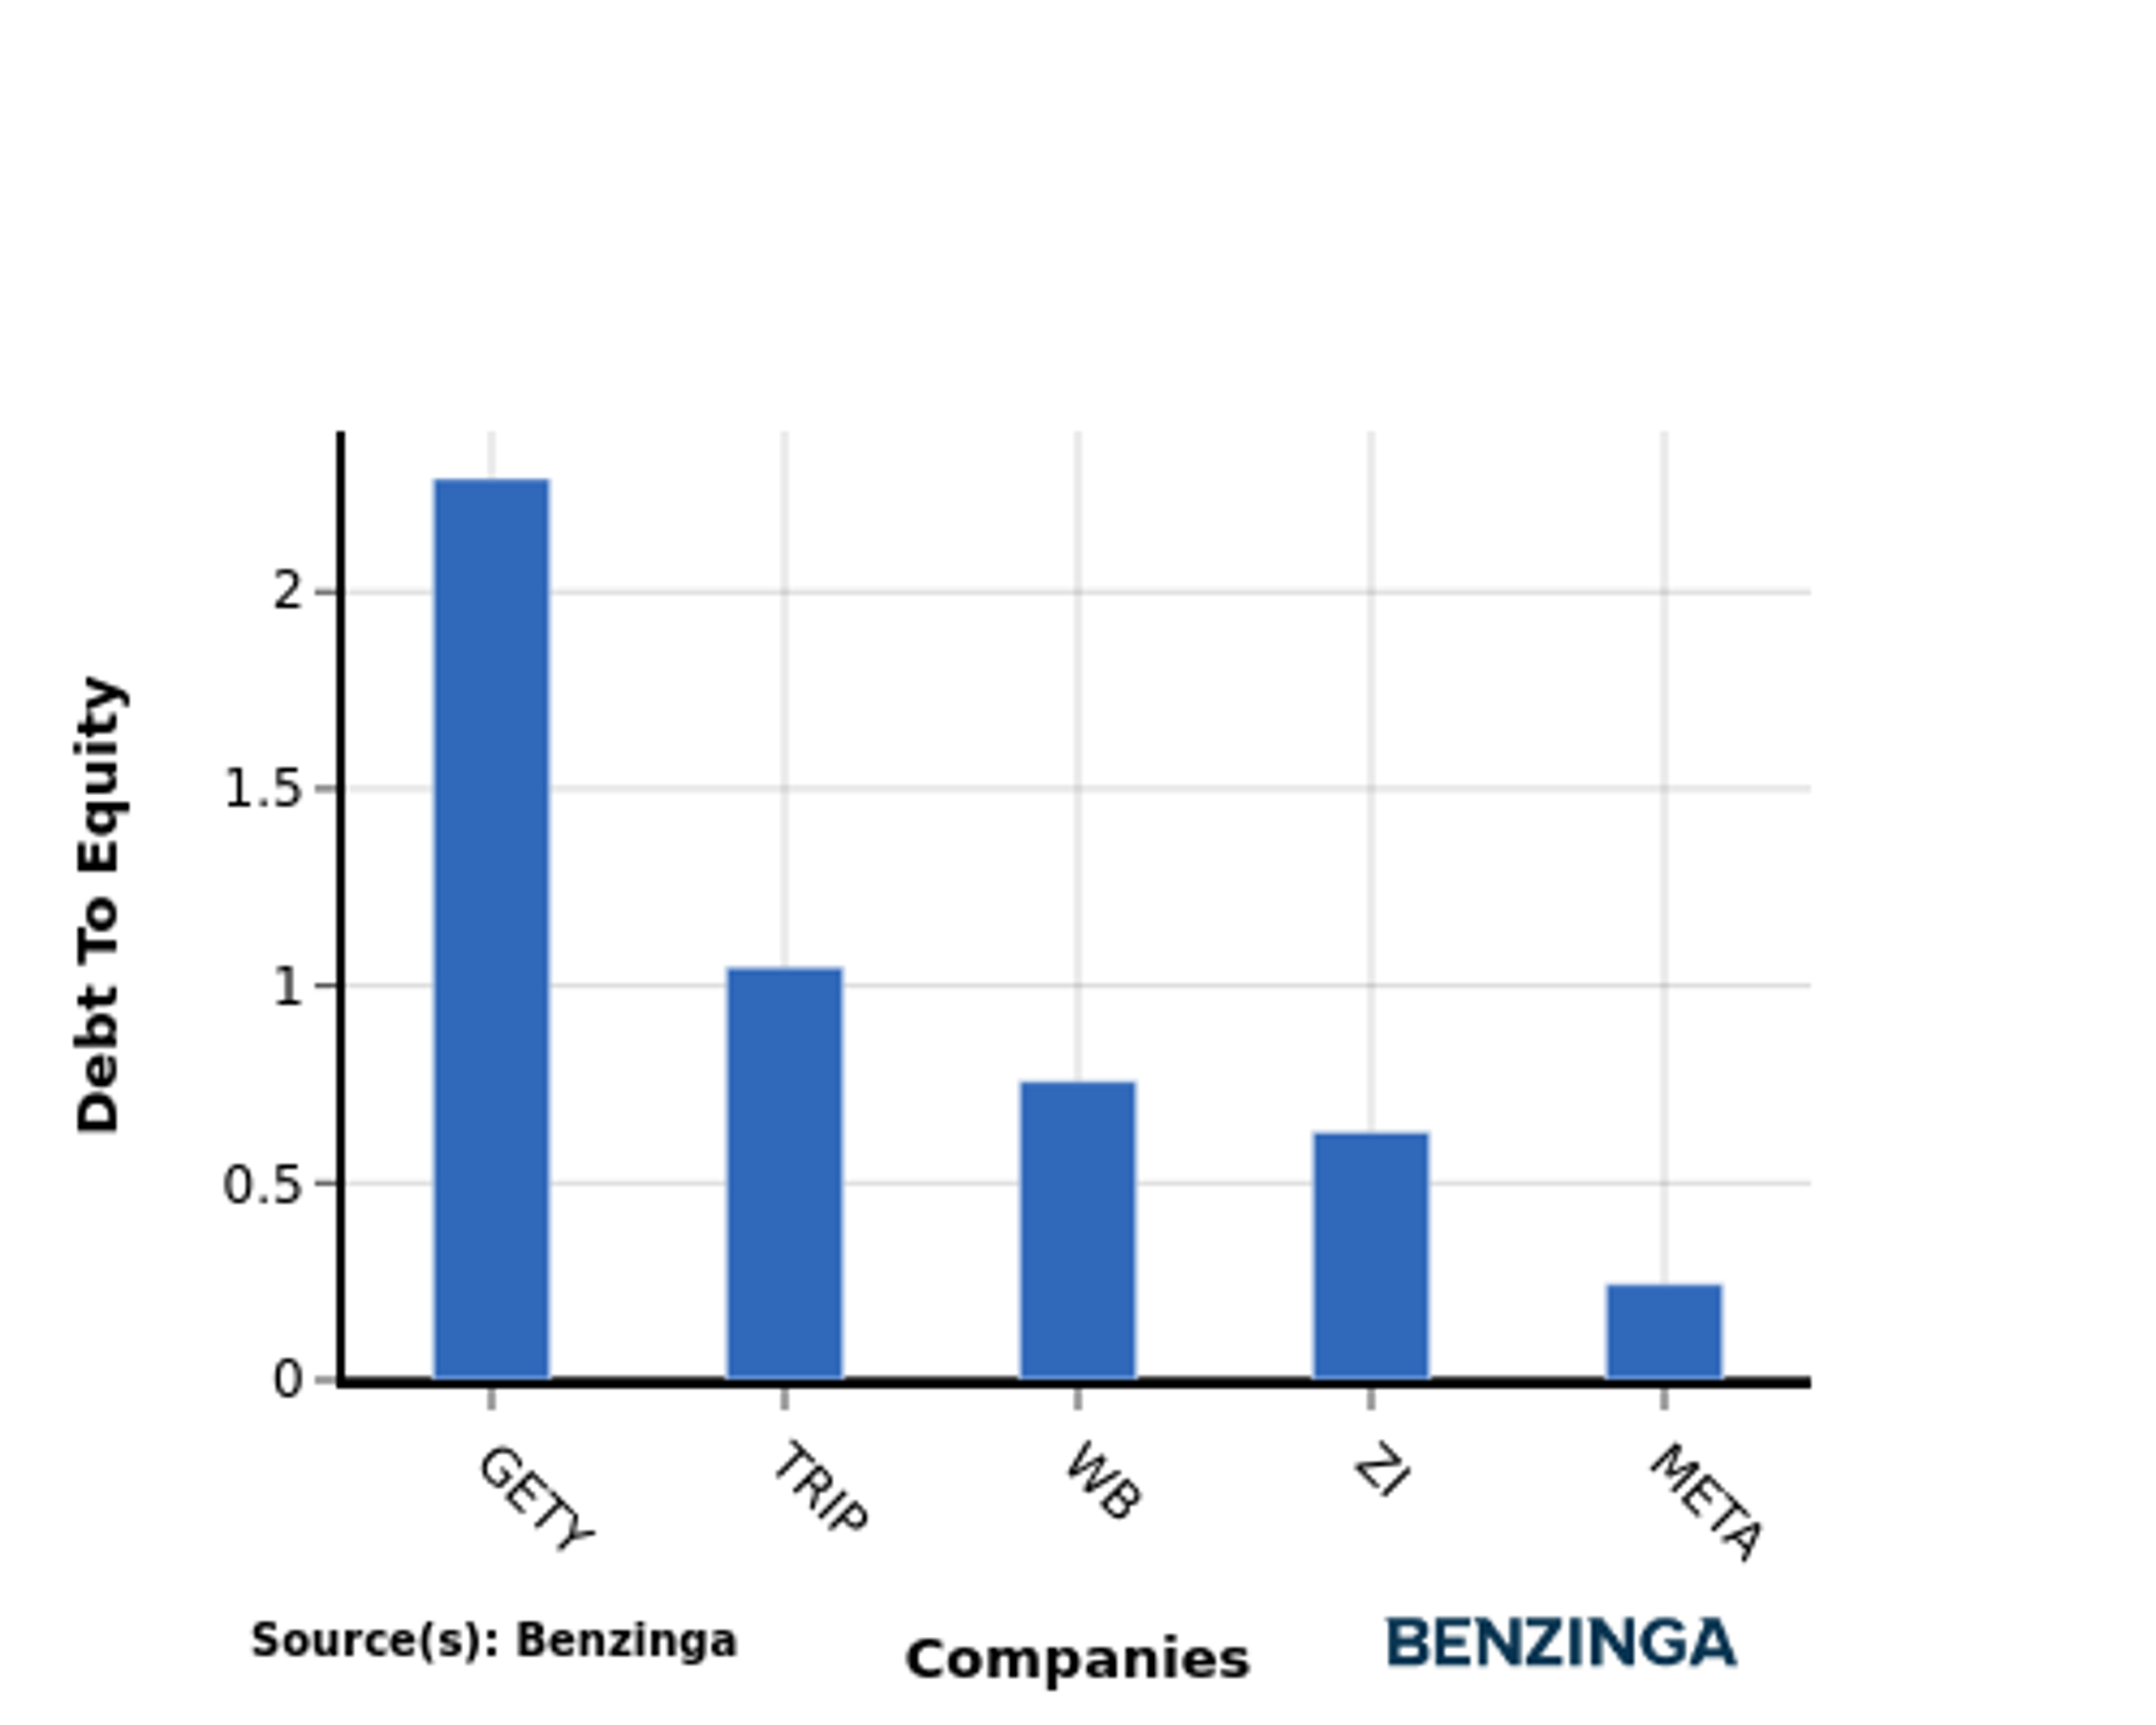
Debt To Equity Ratio

The debt-to-equity (D/E) ratio is a measure that indicates the level of debt a company has taken on relative to the value of its assets net of liabilities.

Considering the debt-to-equity ratio in industry comparisons allows for a concise evaluation of a company's financial health and risk profile, aiding in informed decision-making.

When comparing Meta Platforms with its top 4 peers based on the Debt-to-Equity ratio, the following insights can be observed:

  • Meta Platforms is in a relatively stronger financial position compared to its top 4 peers, as evidenced by its lower debt-to-equity ratio of 0.24.

  • This implies that the company relies less on debt financing and has a more favorable balance between debt and equity.

Key Takeaways

For Meta Platforms, the PE ratio is low compared to peers, indicating potential undervaluation. The high PB and PS ratios suggest strong market sentiment and premium valuation. In terms of ROE, EBITDA, gross profit, and revenue growth, Meta Platforms outperforms its industry peers, reflecting robust financial performance and growth prospects.

This article was generated by Benzinga's automated content engine and reviewed by an editor.


20-Year Pro Trader Reveals His "MoneyLine"

Ditch your indicators and use the "MoneyLine". A simple line tells you when to buy and sell without the guesswork. It’s a line on a chart that’s helped Nic Chahine win 83% of his options buys. Here's how he does it.


ENTER TO WIN $500 IN STOCK OR CRYPTO

Enter your email and you'll also get Benzinga's ultimate morning update AND a free $30 gift card and more!

Posted In: NewsMarketsTrading IdeasBZI-IA