

Wall Street strategists are almost unanimously bullish on the outlook for earnings.
Their estimates for S&P 500 earnings in 2026 range from $300 to $320 per share, implying 11% to 19% year-over-year growth from this year's expected level.
However, strategists are divided on valuations — specifically, on the direction of the forward price-earnings (P/E) ratio as it hovers near five-year highs.
Some argue that the elevated forward P/E is justified and sustainable, which should help the market deliver above-average returns in 2026.
Others argue that the high P/E is a market headwind, limiting returns as it potentially gravitates lower toward the long-term mean.
People who believe that valuations tend to revert to historical means (a phenomenon that's been disputed) lean toward that more conservative view. Maybe they'll be proven right this time.
TKer Stock Market Truth No. 6: Valuations won't tell you much about next year
While P/E ratios may help us understand whether prices look cheap or expensive relative to history, evidence shows the level of the forward P/E ratio says effectively nothing about what the stock market will do over a one-year period.
In their 2025 outlook report, Schwab's Liz Ann Sonders and Kevin Gordon shared this fantastic illustration (which TKer subscribers have seen before). It plots the one-year return on the S&P 500 for various forward P/E levels since 1958.
"You can see that the relationship is a very weak -0.12 — essentially insignificant," Sonders and Gordon wrote. "It underscores the important market truth that valuation is a horrible market-timing tool (as if a good timing tool even exists)."
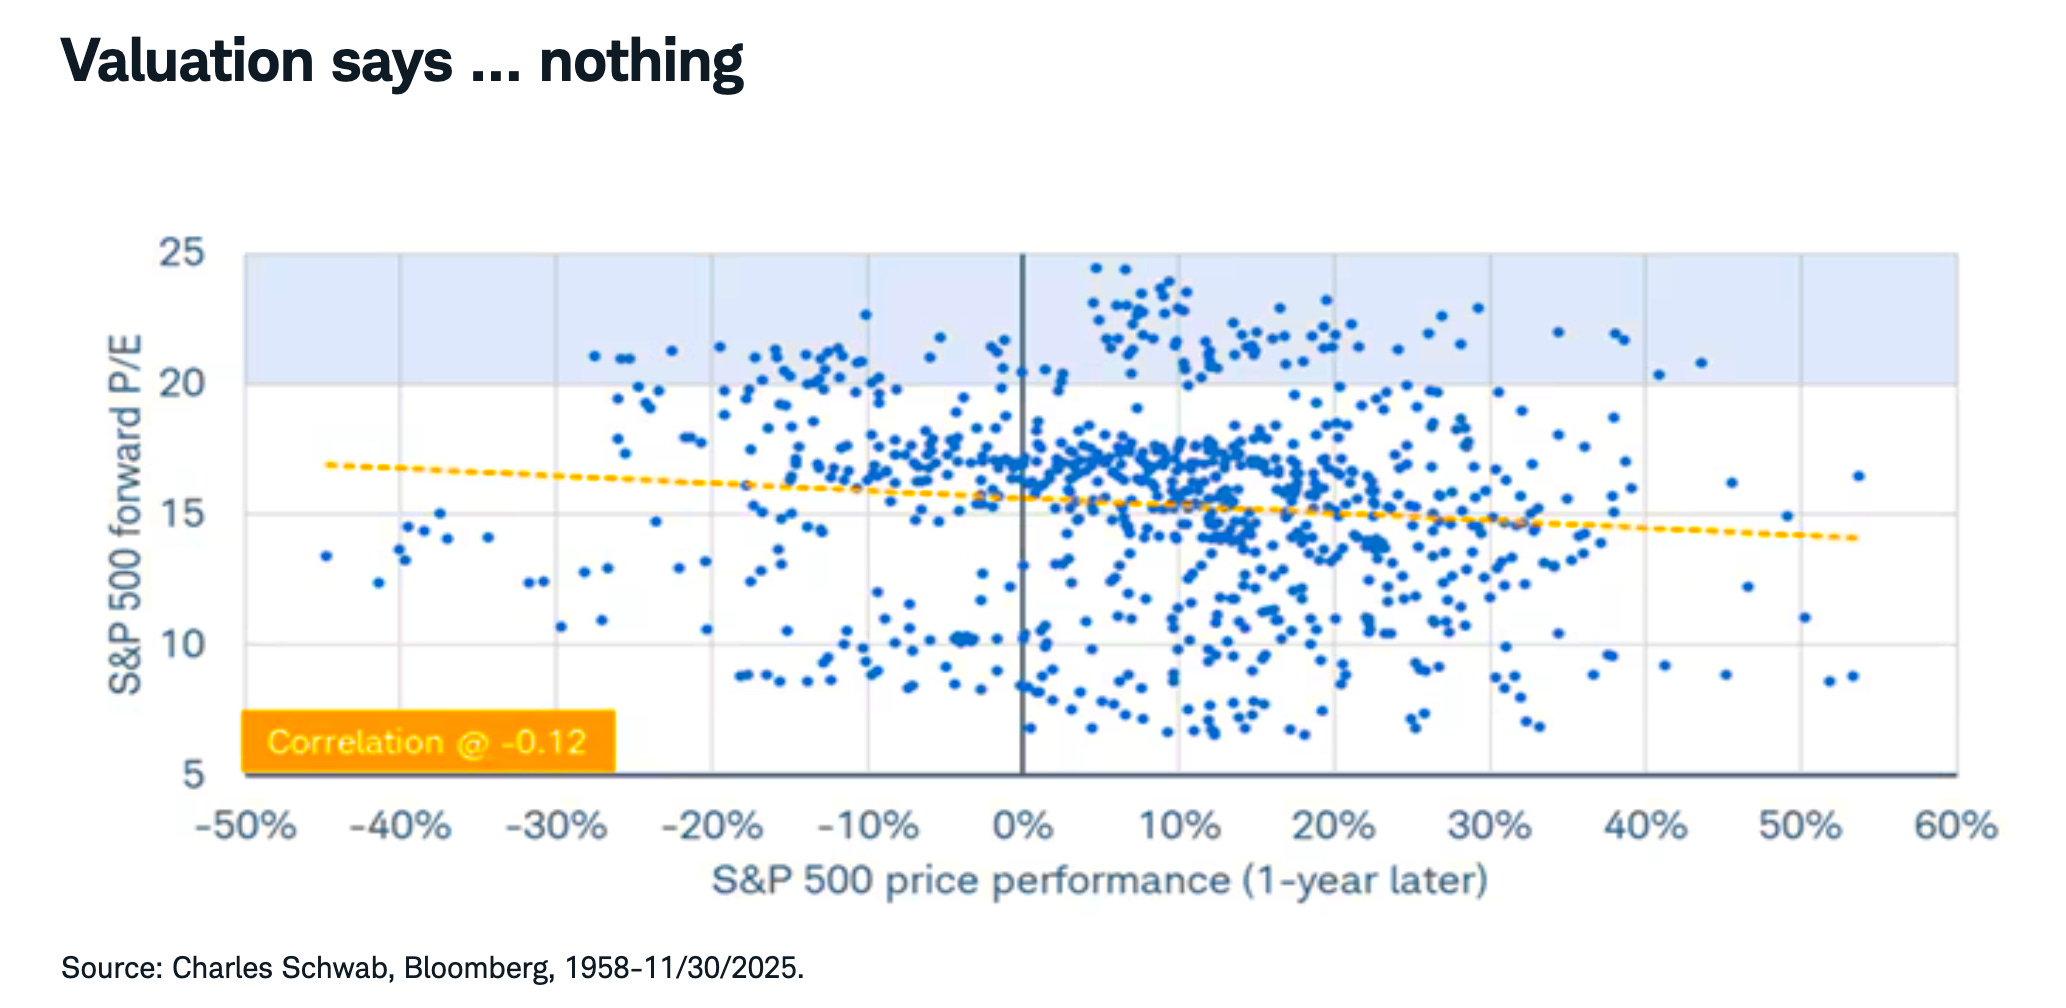
The chart is chaotic. Yes, there are periods where a 22x forward P/E preceded negative returns. But it's also a level that's preceded very positive returns numerous times.
Three important notes 🙋🏻♂️
First, there are far more dots on the right side of the y-axis in the above chart than there are on the left side, a reminder that the stock market usually goes up. This is true even for periods of elevated P/E ratios.
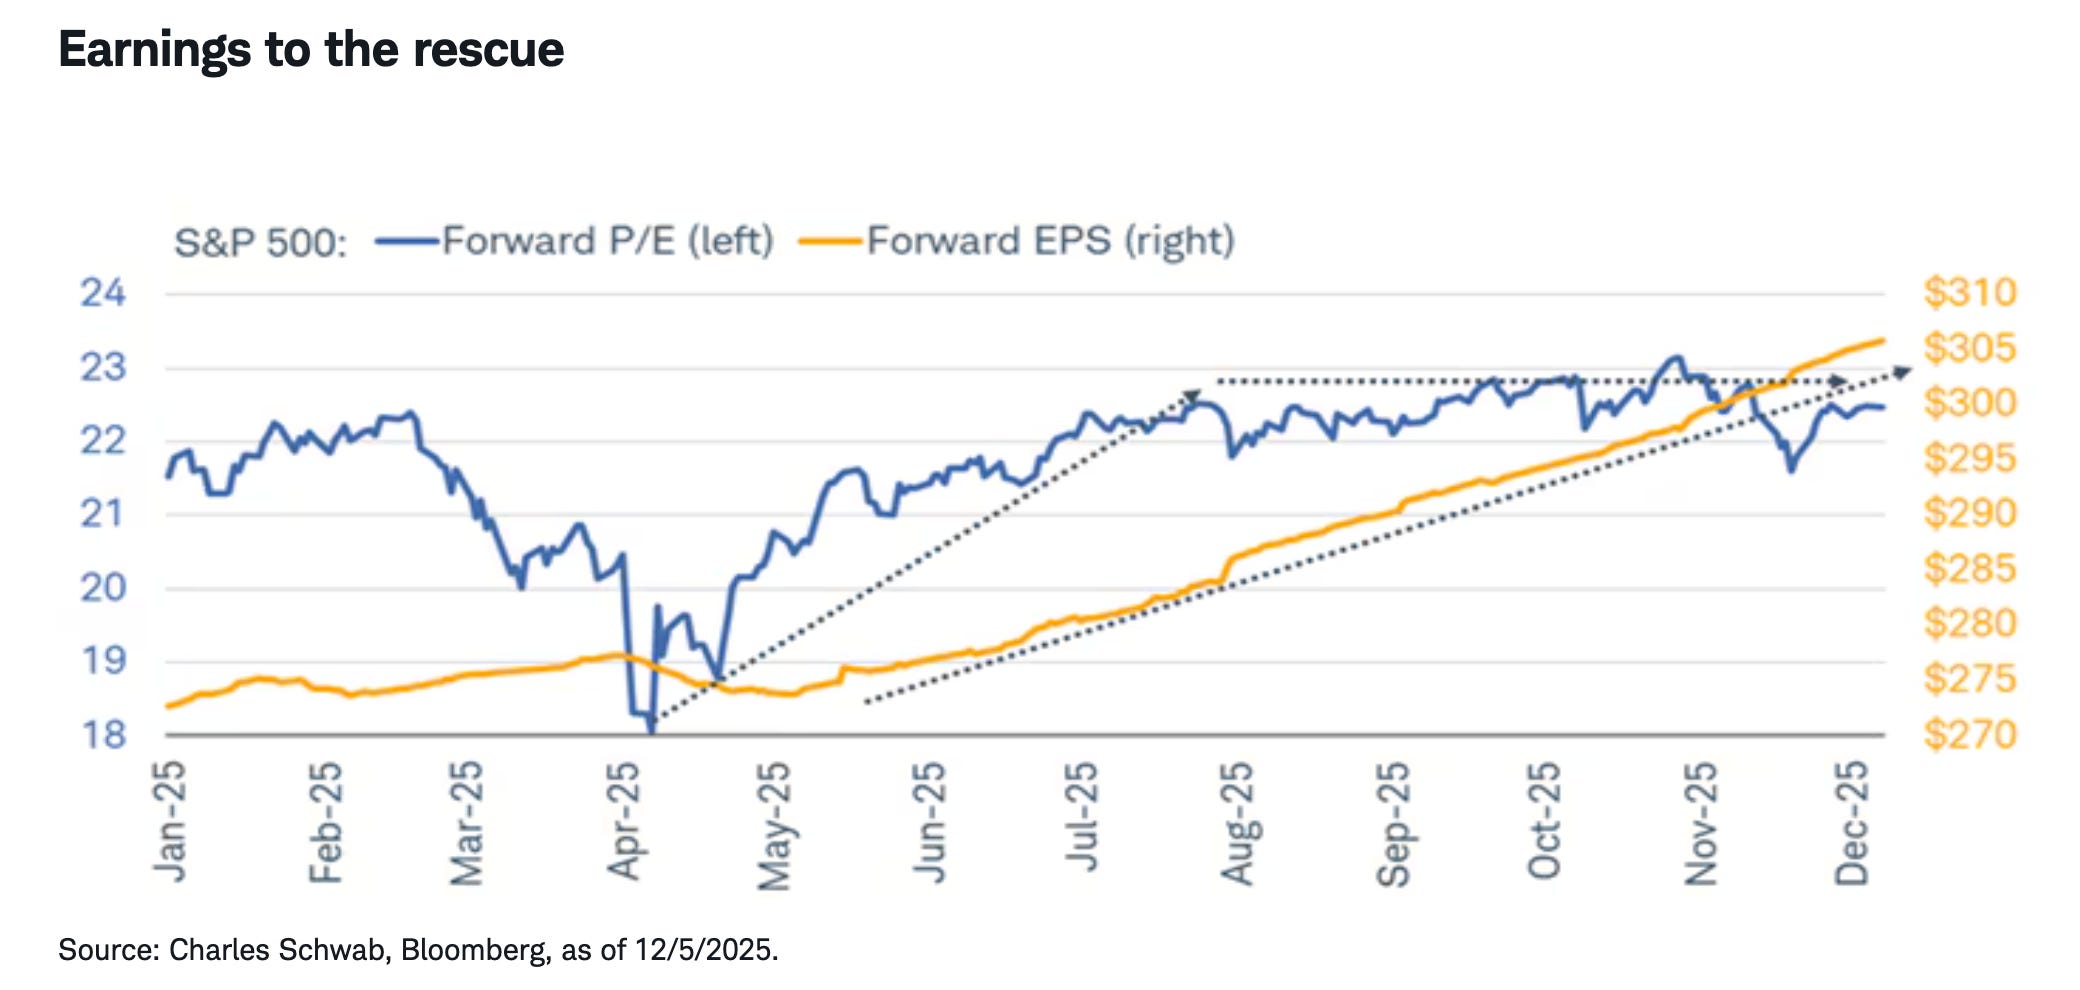
I'd argue this is because earnings and expectations for earnings are usually going up, and earnings are the most important long-term driver of prices. Indeed, much of the stock market rally this year can be explained by earnings expectations trending higher even as P/E ratios flatten.
Second, falling valuations don't necessarily mean prices have to fall. Stocks can rise as valuations fall as long as earnings are growing faster than prices. More here, here, and here.
Third, the relationship between valuations and stock returns is stronger when extending the time horizon. But as we discussed here and here, the relationship isn't perfect.
None of this is to say valuation metrics like the forward P/E are totally useless in the context of how you decide to make adjustments to your portfolio.
Rather, it's just a reminder that you shouldn't be surprised if the market does unlikely and arguably irrational things over very short periods of time.
Benzinga Disclaimer: This article is from an unpaid external contributor. It does not represent Benzinga’s reporting and has not been edited for content or accuracy.
© 2025 Benzinga.com. Benzinga does not provide investment advice. All rights reserved.