
Identifying Reversals Using Leveraged ETFs
- Trade signatures offer valuable insights into institutional positioning and intent.
- Institutions follow certain patterns when opening and closing leveraged trades.
- Institutional behavior on certain dates is predictable.
- Institutional positioning suggests we begin October with a rally.
Leveraged ETFs
Leveraged ETFs are ETFs that aim to return anywhere from -3x to +3x daily returns relative to its underlying ETF. For example, TQQQ (NASDAQ:TQQQ) is 3x leverage against QQQ (NASDAQ:QQQ) and will return 3% for every 1% return on QQQ. Likewise, SQQQ (NASDAQ:SQQQ) is the 3x inverse leverage against QQQ and will return 3% for every 1% decline on QQQ. But these ETFs suffer from decay and are not meant to be held for long periods of time. Typically you’d only want to hold when the expected move of the underlying is substantial enough to offset the decay that would be suffered during that period. Typically this means holding for hours or days, not weeks or months. Chart any leveraged ETF and you can see that over the long run, they all approach zero. This is by design.
But in short bursts, they can be very profitable. Institutions trade these leveraged ETFs at key junctures when they’re planning sharp moves in either direction. Detecting when institutions trade these instruments with size can provide valuable insight about the next move in the underlying.
Institutional Trade Patterns Using Leveraged ETFs
After countless hours of observing institutional trades using Volumeleaders.com, a pattern has emerged. Allow me to explain.
When trading at or near local lows and seeking a reversal, institutions will:
- Build position in the underlying as price declines, create a base, and set a low.
- Initiate a short rally, then pullback above the prior low.
- Add long leverage on the pullback, followed by longer/stronger rally.
- Close long leverage after the stronger rally, signifying its end.
- Consolidate. Chop. Establish one more nominal high. Close longs in the underlying as price exhausts.
Institutions follow the same process after local highs are made, but in reverse:
- Build a short position in the underlying.
- Initiate a shallow decline, then retrace up.
- Add short leverage on the retrace followed by a stronger/steeper decline.
- Close short leverage after the sharp decline, signifying its end.
- Consolidate. Chop. Establish one more spike low. Close shorts in the underlying as price exhausts.
Aside: I’m not an Elliott wave practitioner myself, but those that employ EW methodologies in their trading would see leverage trade heavily before and after wave 3 or C, as those are the sharpest moves in any wave structure. Likewise, they'd see large positions established and closed in the underlying near the ends of wave 5 or C, as that’s when waves terminate and reverse.
But there's are nuances to this pattern of course.
Nuance #1
When leverage comes out of sequence, it's often meant to be used in reverse. We saw this twice recently in TMF (3x bull TLT) when disproportionately large trades arrived without large positions in the underlying TLT having been established first, thus signaling they were short positions instead of longs. Here’s one example below.


Nuance #2
When institutions trade the leveraged bull ETFs with size in conjunction with the leveraged bear ETFs with size, it often signifies an immediate reversal. This can be illustrated by trades seen near the summer high on July 15 in TQQQ and SQQQ which both traded together with unusual size, suggesting institutions are either closing one end to open the other, or they’re taking longs in one and shorts in the other. In either case, QQQ reversed upon the arrival of these two trades and a high was made.


These two trades were both made at 4:05pm on July 15, perhaps by the same entity. The trade signatures on these trades offer insights into which is taking place (open & close vs two directionally equivalent opening trades made by shorting one leveraged ETF and longing the other), which brings me to nuance #3.
Nuance #3
When a large trade is made with nice round number share size, I favor it being an opening trade. For example, a trade of exactly 1M shares is more likely to be an opening trade than a closing trade. I believe this is partially because humans think in round numbers. We want a million shares of this, or a hundred thousand shares of that. We don’t seek to open positions that are cumbersome to track.
But conversely, positions are closed along the way as price meets different targets, or as a function of how much liquidity exists at different levels. Trades aren’t necessarily closed in one move as they might be opened. The likelihood that an institution wants exactly 1M shares is less than the likelihood that an institution has exactly 1M shares on the books to sell. Positions are often opened in one move, and then closed along the way as partial profits are taken as price nears its target. What's left at the end is the closing trade.
Further, large round-number blocks are also commonly found as market maker hedges against options positions. If an institution wants to purchase 10,000 option contracts, the hedge will be 1M shares. As time passes and those options decay, and price moves away from the price at which they were traded, the resulting hedge will diminish in size, and market makers will reduce the size of their hedge accordingly to remain delta neutral. When the options are closed out, what remains of the hedge will be closed with it, and that’s often an odd-lot number of shares.
Now, sometimes opening trades are odd-lot numbers too. A trade of 1,473,291 shares could be an opening trade or a closing trade. But it’s less common that closing trades are nice round numbers. So, if I see a round number of shares on a disproportionately large trade, I assume it's a new opening trade unless I have reason to believe otherwise. In the example above from July 15, both trades were round number sizes, suggesting they were both opened.
TQQQ – Exactly 1,200,000 shares.
SQQQ – Exactly 3,000,000 shares
Simply put, I think they bought SQQQ and shorted TQQQ at the same moment to capture as much of the expected move lower in the underlying QQQ as they could by using both leveraged ETFs concurrently.
Why Is This Relevant?
That brings us to Friday’s trades in QQQ, TQQQ, and SQQQ.
At 2:09pm we got exactly 2,400,000 shares of QQQ traded on the open market. It ranked 15th largest since inception, making it meaningfully large. It was a round number of shares, and it appeared on the open exchange during regular trading hours, so my interpretation was that it was a hedge against a large options position being opened, though it didn’t have to be. More importantly, it appeared near a local low after several days of selling which led me to believe it was bullish positioning for the simple reason that institutions buy low and sell high.

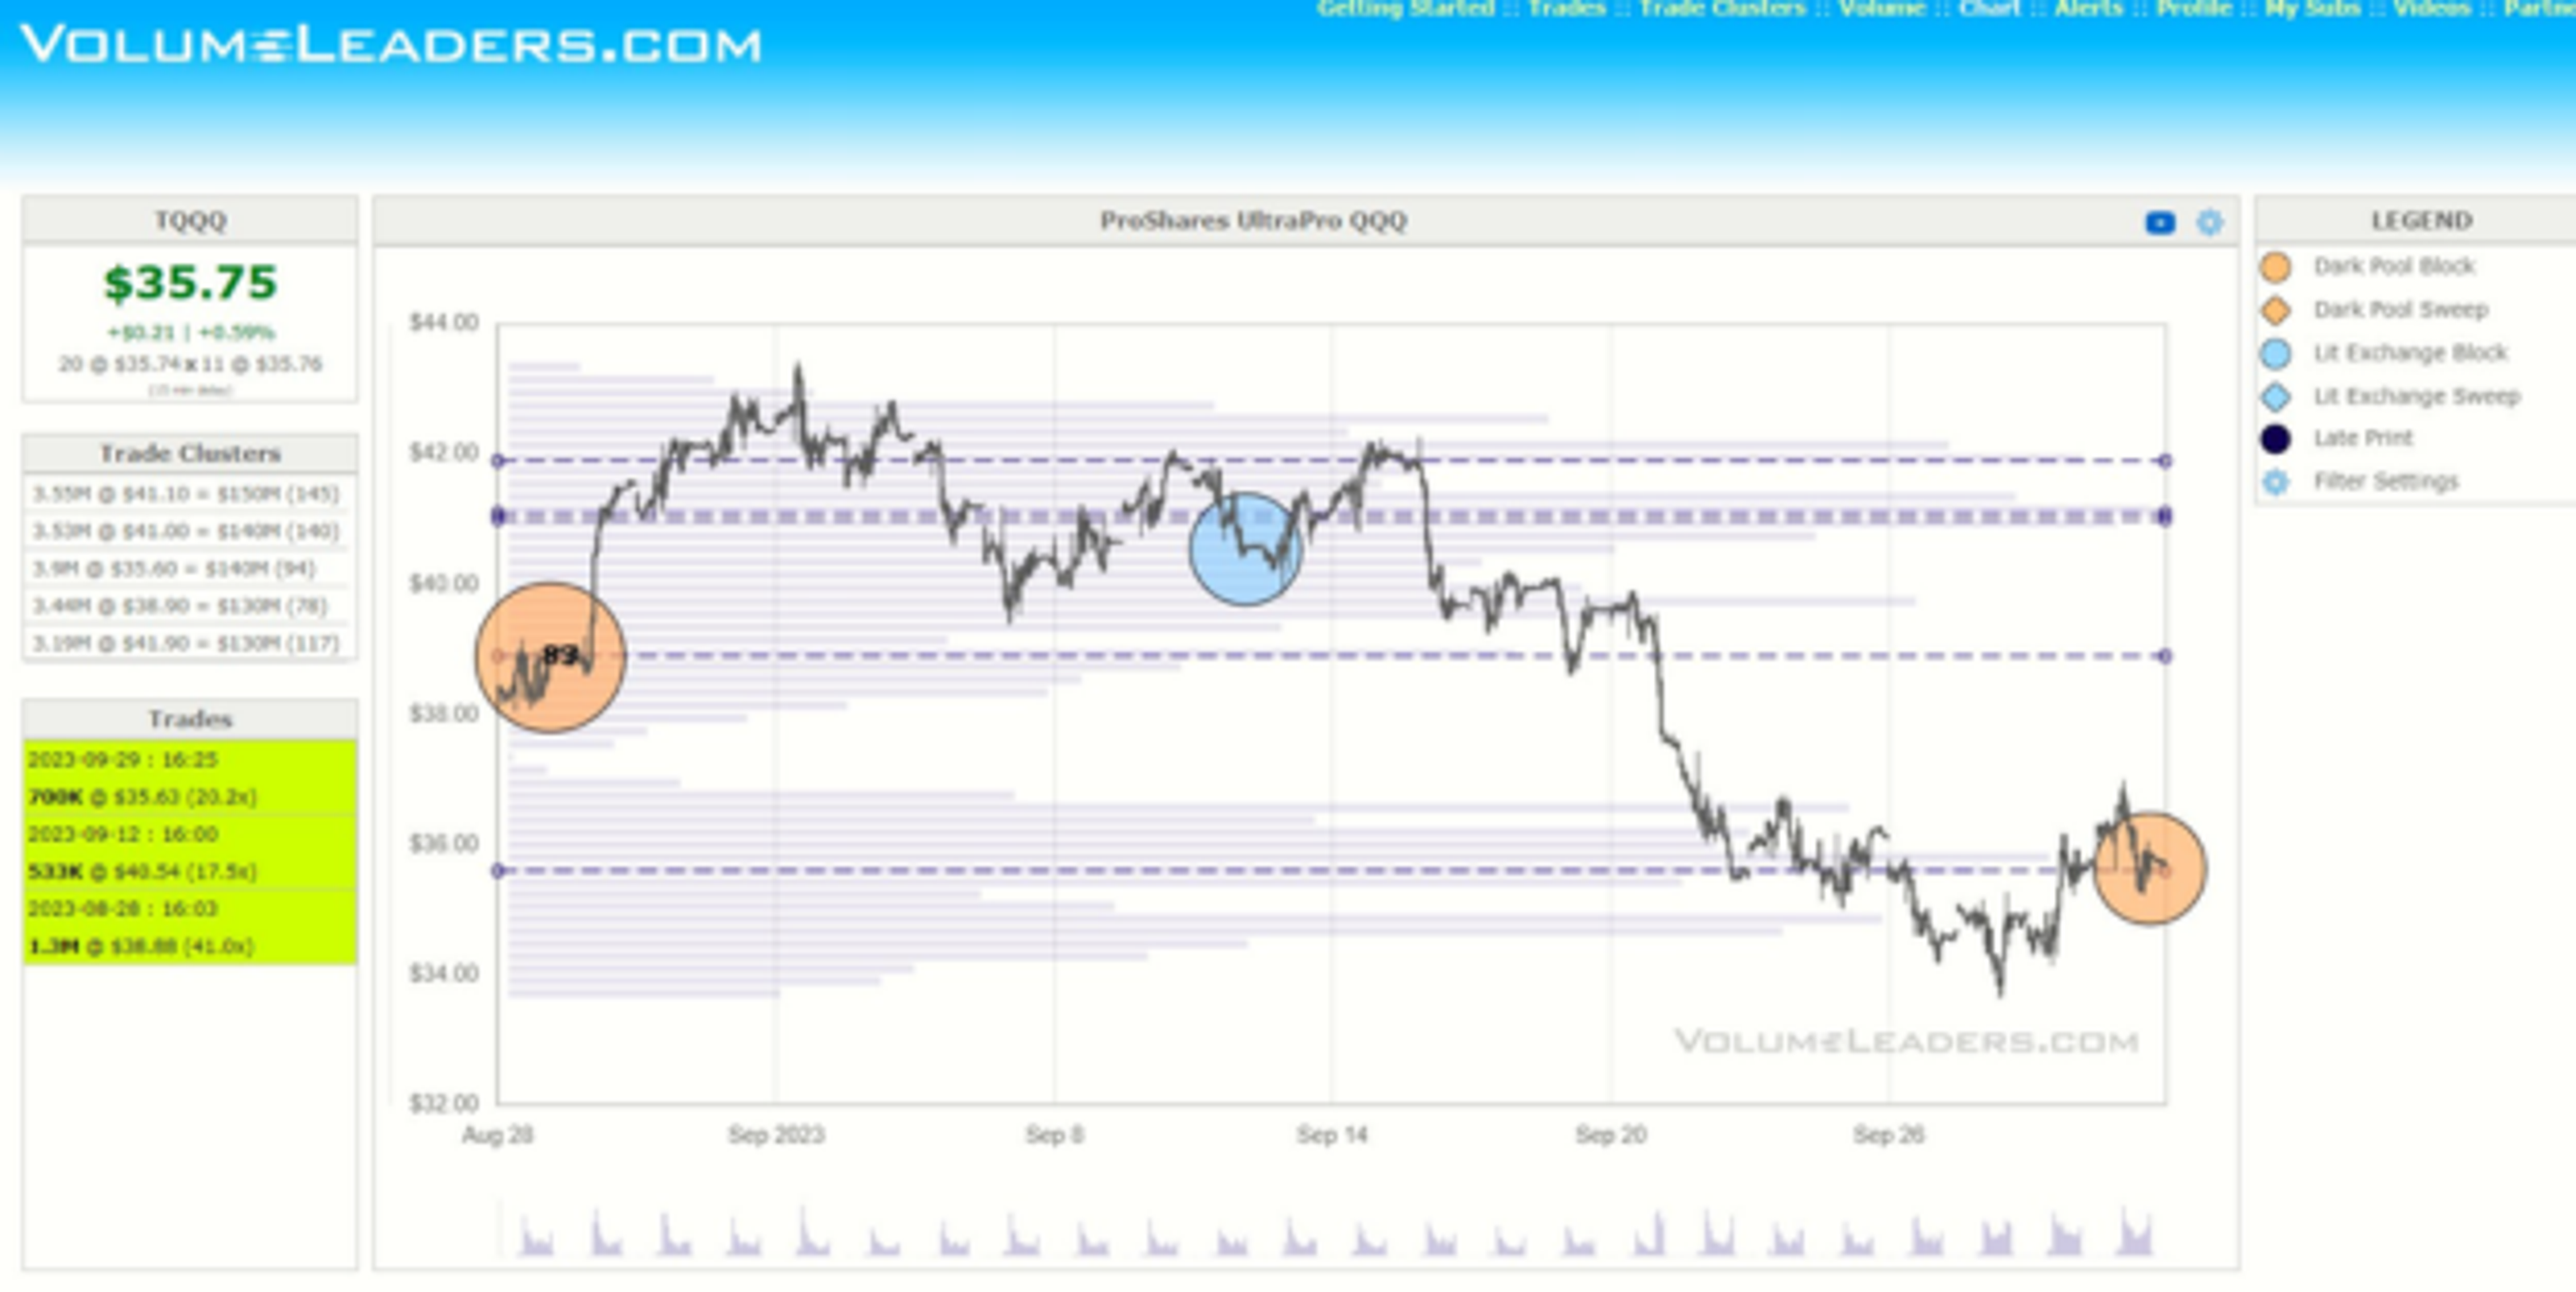
Two hours later, we got disproportionately large trades on in SQQQ and TQQQ on a dark pool.
TQQQ - 700,000 shares.
SQQQ - 2,300,000 shares.
Based on what I explained above, these two disproportionately large, round-number trades present as opening trades that were directionally the same, just as we saw on July 15. Given that we already had a very large trade in QQQ near the low two hours earlier, I concluded that all three trades were all working together and were directionally bullish. But let’s dig further.
The SQQQ chart below shows that price made a small double top just before the trade arrived. I also see that we've had a decent run up over the past several sessions. Given the technical pattern and the fact that institutions buy low and sell high, this trade suggests it’s meant to take SQQQ lower, which is bullish for the underlying QQQ. Given its trade size, one can infer that it's an opening position. As such, I think it's a new short.

TQQQ didn’t trade as much inventory as SQQQ, but just like SQQQ, it was the largest trade since August 28. Conclusion: Institutions are doing the same thing that they did when both appeared together on August 28 and July 15, positioning for a reversal. This time it’s bullish.
July 15 – Directionally Bearish
TQQQ – 1,200,000 shares
SQQQ – 3,000,000 shares
August 28 – Directionally Bullish
TQQQ - 1,300,000 shares.
SQQQ - 2,500,000 shares.
Sept 29 – TBD - But I think directionally bullish
TQQQ - 700,000 shares.
SQQQ - 2,300,000 shares.
Looking back at the last time this happened on August 28, we can see we got a $15 QQQ rally from August 28-Sept 1. The trades that came in on Friday in SQQQ, TQQQ, and of course the #15 ranked trade in QQQ itself all suggest to me we'll move higher this week.
From a timing perspective, Friday was EOQ, and with that often comes window dressing. That means institutions scoop up all the big sexy names like AAPL, MSFT, NVDA, and GOOG at the close so they can report to Ma & Pa 401K holder that they own the recognizable names. But what institutions typically do next is take price up on the first of the month to re-sell some or all those shares right back to us at higher prices. Once they've redistributed those shares, they can move on with whatever their original plans were and rotate back into the names they want (which may or may not include the mega-caps).
Further supporting this notion is that Friday was the first day in a while that we've seen large top-100 ranked trades in the mega-caps. It's been eerily quiet during this decline of the past two weeks, a characteristic that is common during selloffs. If institutions aren’t trading large, they aren’t buying large, and when they aren’t buying large, prices decline.
Here's a snippet of Friday's large megacap trades. Stop by volumeleaders.com any time to visualize these trades.

Review
Disproportionately large opening trades (presumably) in QQQ, TQQQ, and SQQQ, all within a couple hours of each other, all after days of selling in QQQ, all on the last trading day of the month, and accompanied by large trades in mega-caps.
Institutional positioning suggests a rally in QQQ is imminent. Assuming we get one, I don't know how high it will go or how long it will last, but institutions will at minimum need to spend enough time higher than Friday’s close to sell the mega-caps they picked up at EOQ.
Postscript: High-Yield bonds also posted a disproportionately large trade after hours on Friday. Exactly 5M shares traded, the largest trade since July 10 and ranked 59th largest since inception. This trade is consistent with an opening buy as price sits on the convergence of the 4H Keltner bottom and the daily Keltner bottom, an area where buying is more common than selling. Buying junk bonds would be a risk-on signal for stocks in the near term and supportive of bullish positioning in QQQ.


DISCLAIMER: If at any point, QQQ trades below $357.44, this thesis is wrong and something else is at play. Doing so would suggest these trades are not being defended, thereby nullifying any near-term bullish thesis.
Website: volumeleaders.com – 7 Day Free Trial. 12 tickers are always free to all registered users.
Email: info@volumeleaders.com
Twitter: @volumeleaders
YouTube: @volumeleaders
© 2025 Benzinga.com. Benzinga does not provide investment advice. All rights reserved.