
Another roller coaster week has just closed, and looking at data, the next one, at least the first part of the week looks to be similar. Friday we saw the Option Expiration Week (OPEX). Following this event can help up understand how the following week could look like.
Today we will focus on the High Vol Level triggers and Sticky Strikes. Two important concepts that become even more important when we navigate into negative gamma territory.
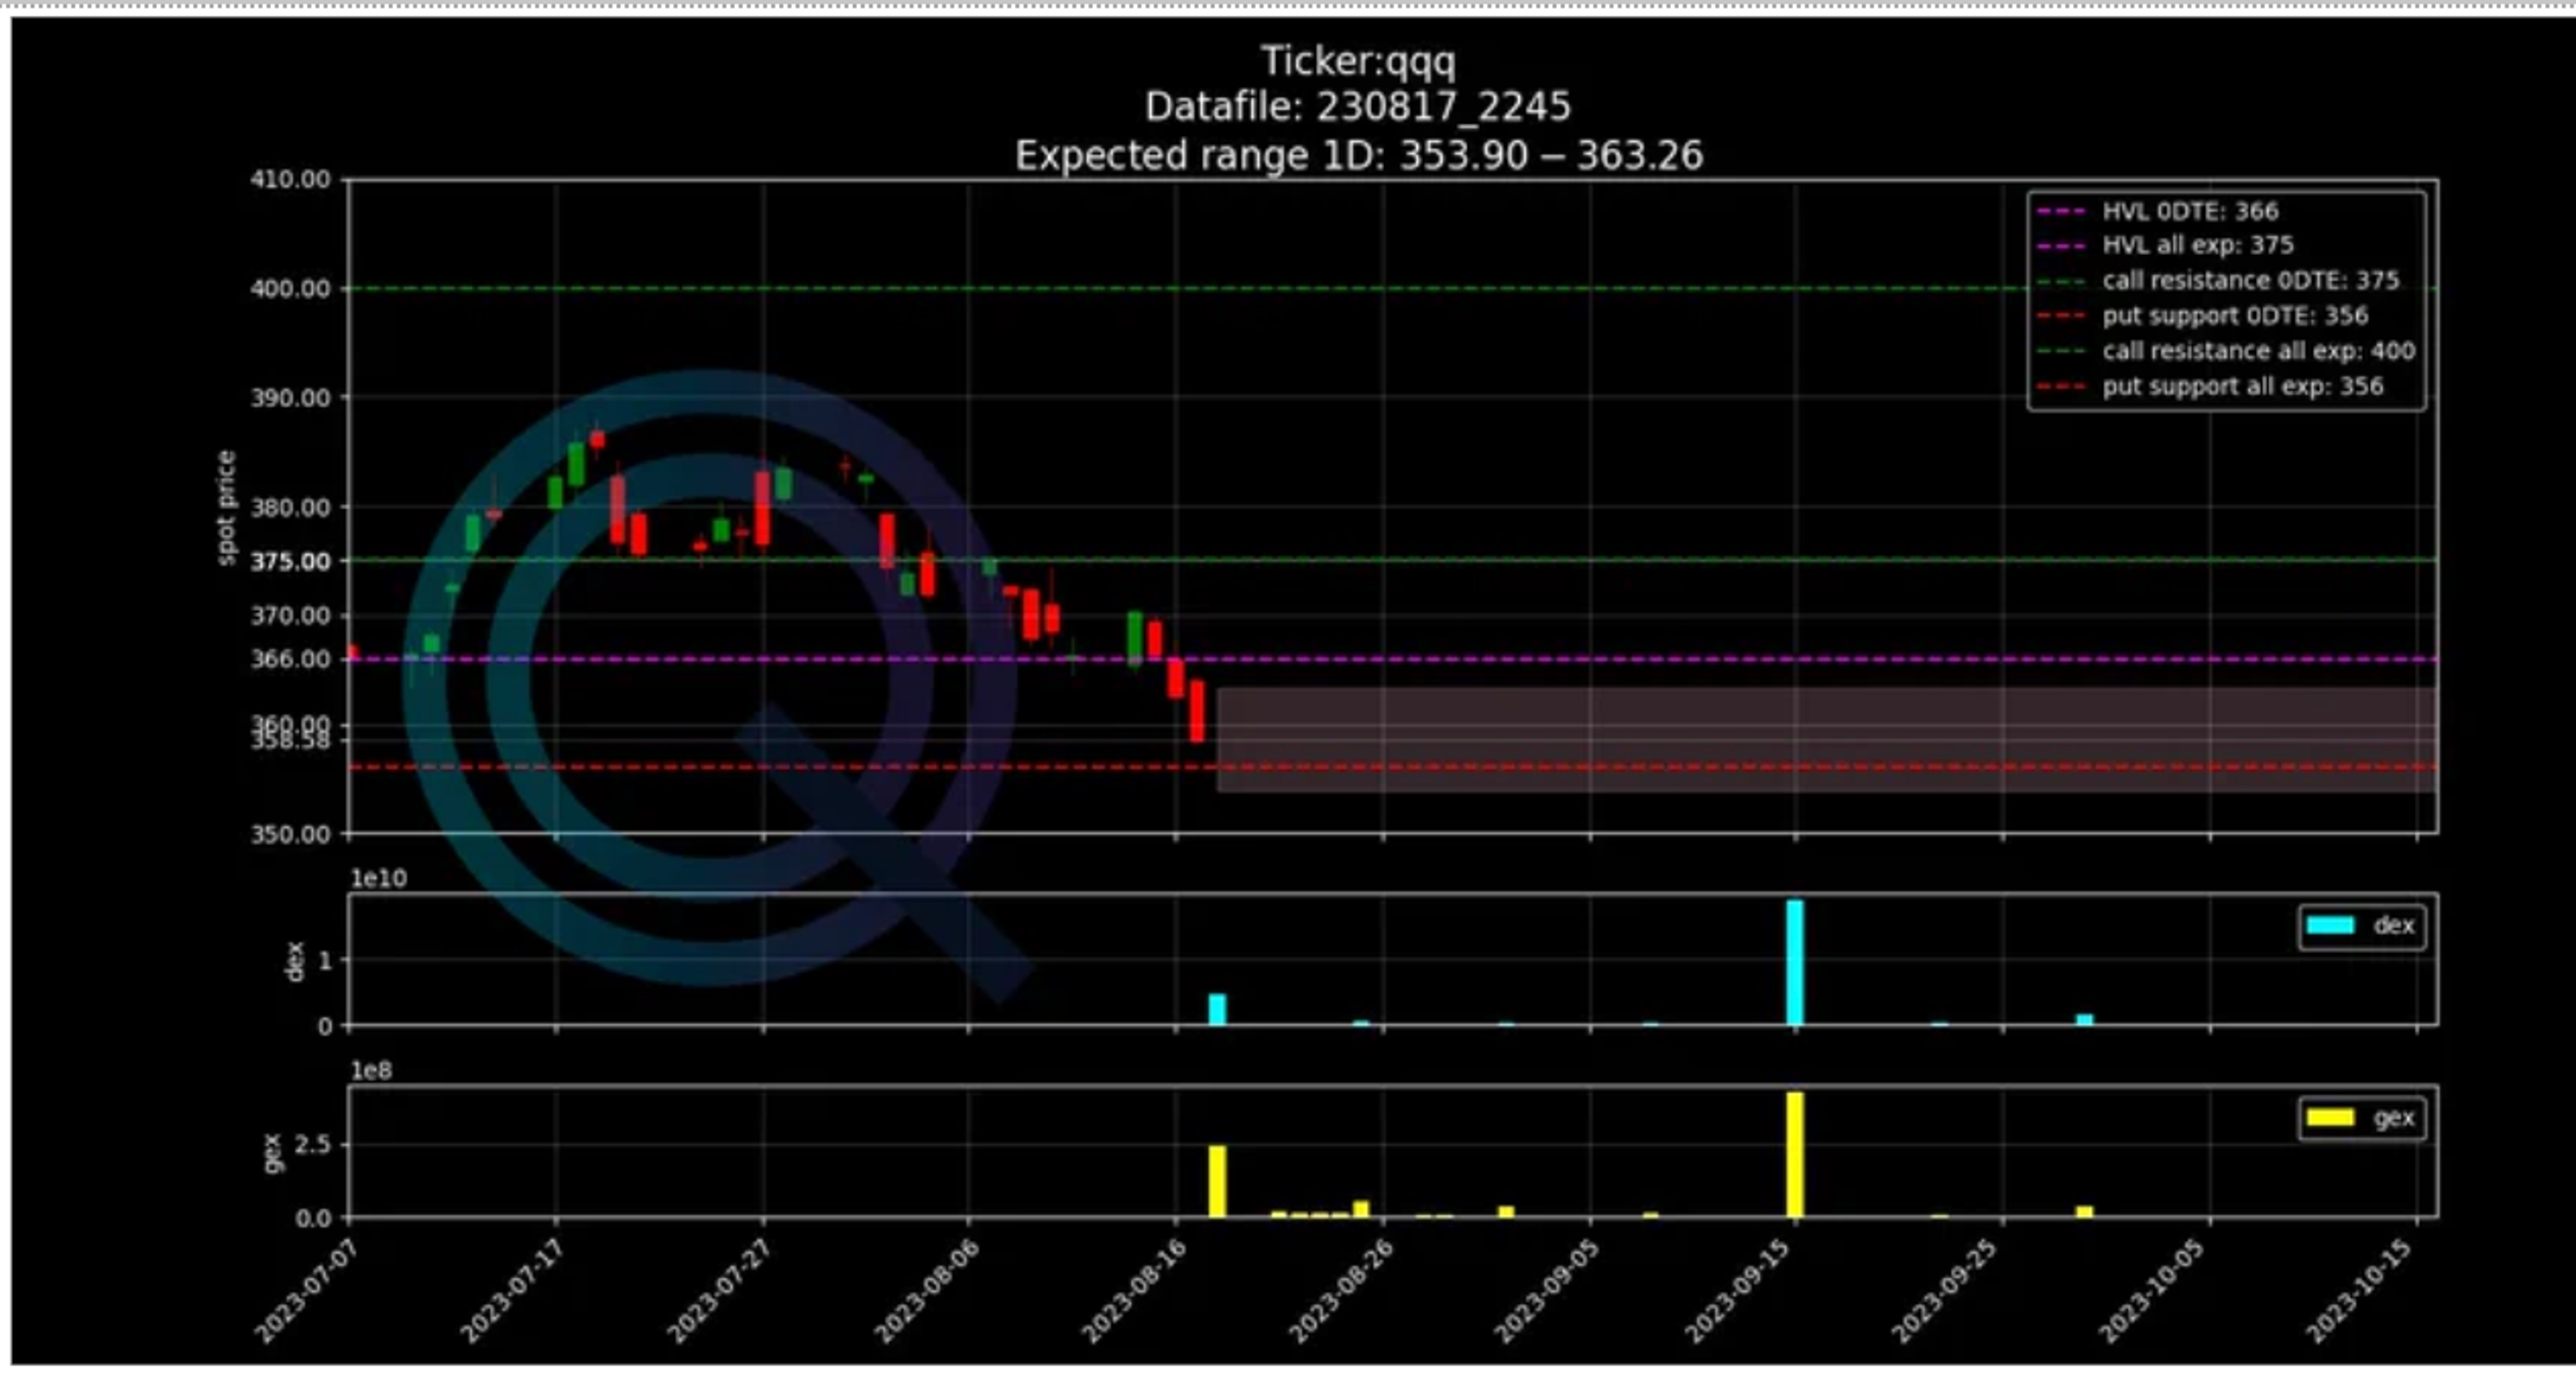
Let’s start from the High Vol Level. We have talked about this concept in previous articles, so we will not focus on this too much. But this is a very important level, because market dynamics change very much when spot price is above or below that level.
We like to simplify the concept by calling this level, the boundary between low price volatility (Positive Gamma) and high volatility (Negative Gamma). You can see this level in the dotted line in purple. We are looking at these levels for the SPX Index.

Knowing where we are vis a vis that level is very important, because it gives us also an idea of what could potentially happen throughout the day. Every morning knowing how far you are from that level is very helpful. In the Key Levels Table you can find the field: “Distance to HVL %”.
During days that we navigate in positive gamma that level is not very important, because it is less likely that spot moves in that direction. Yet, when we are in negative gamma, price action is accentuated.
Meaning prices move a lot faster, there is higher volatility. That means that we are more likely to touch that level. If that happens, then the price action changes very fast and volatility goes down.
The Importance Of Sticky Strikes During Negative Gamma Markets
Black Scholes assumes that volatility for an underlying does not change. According to the model this is how the skew should look like.

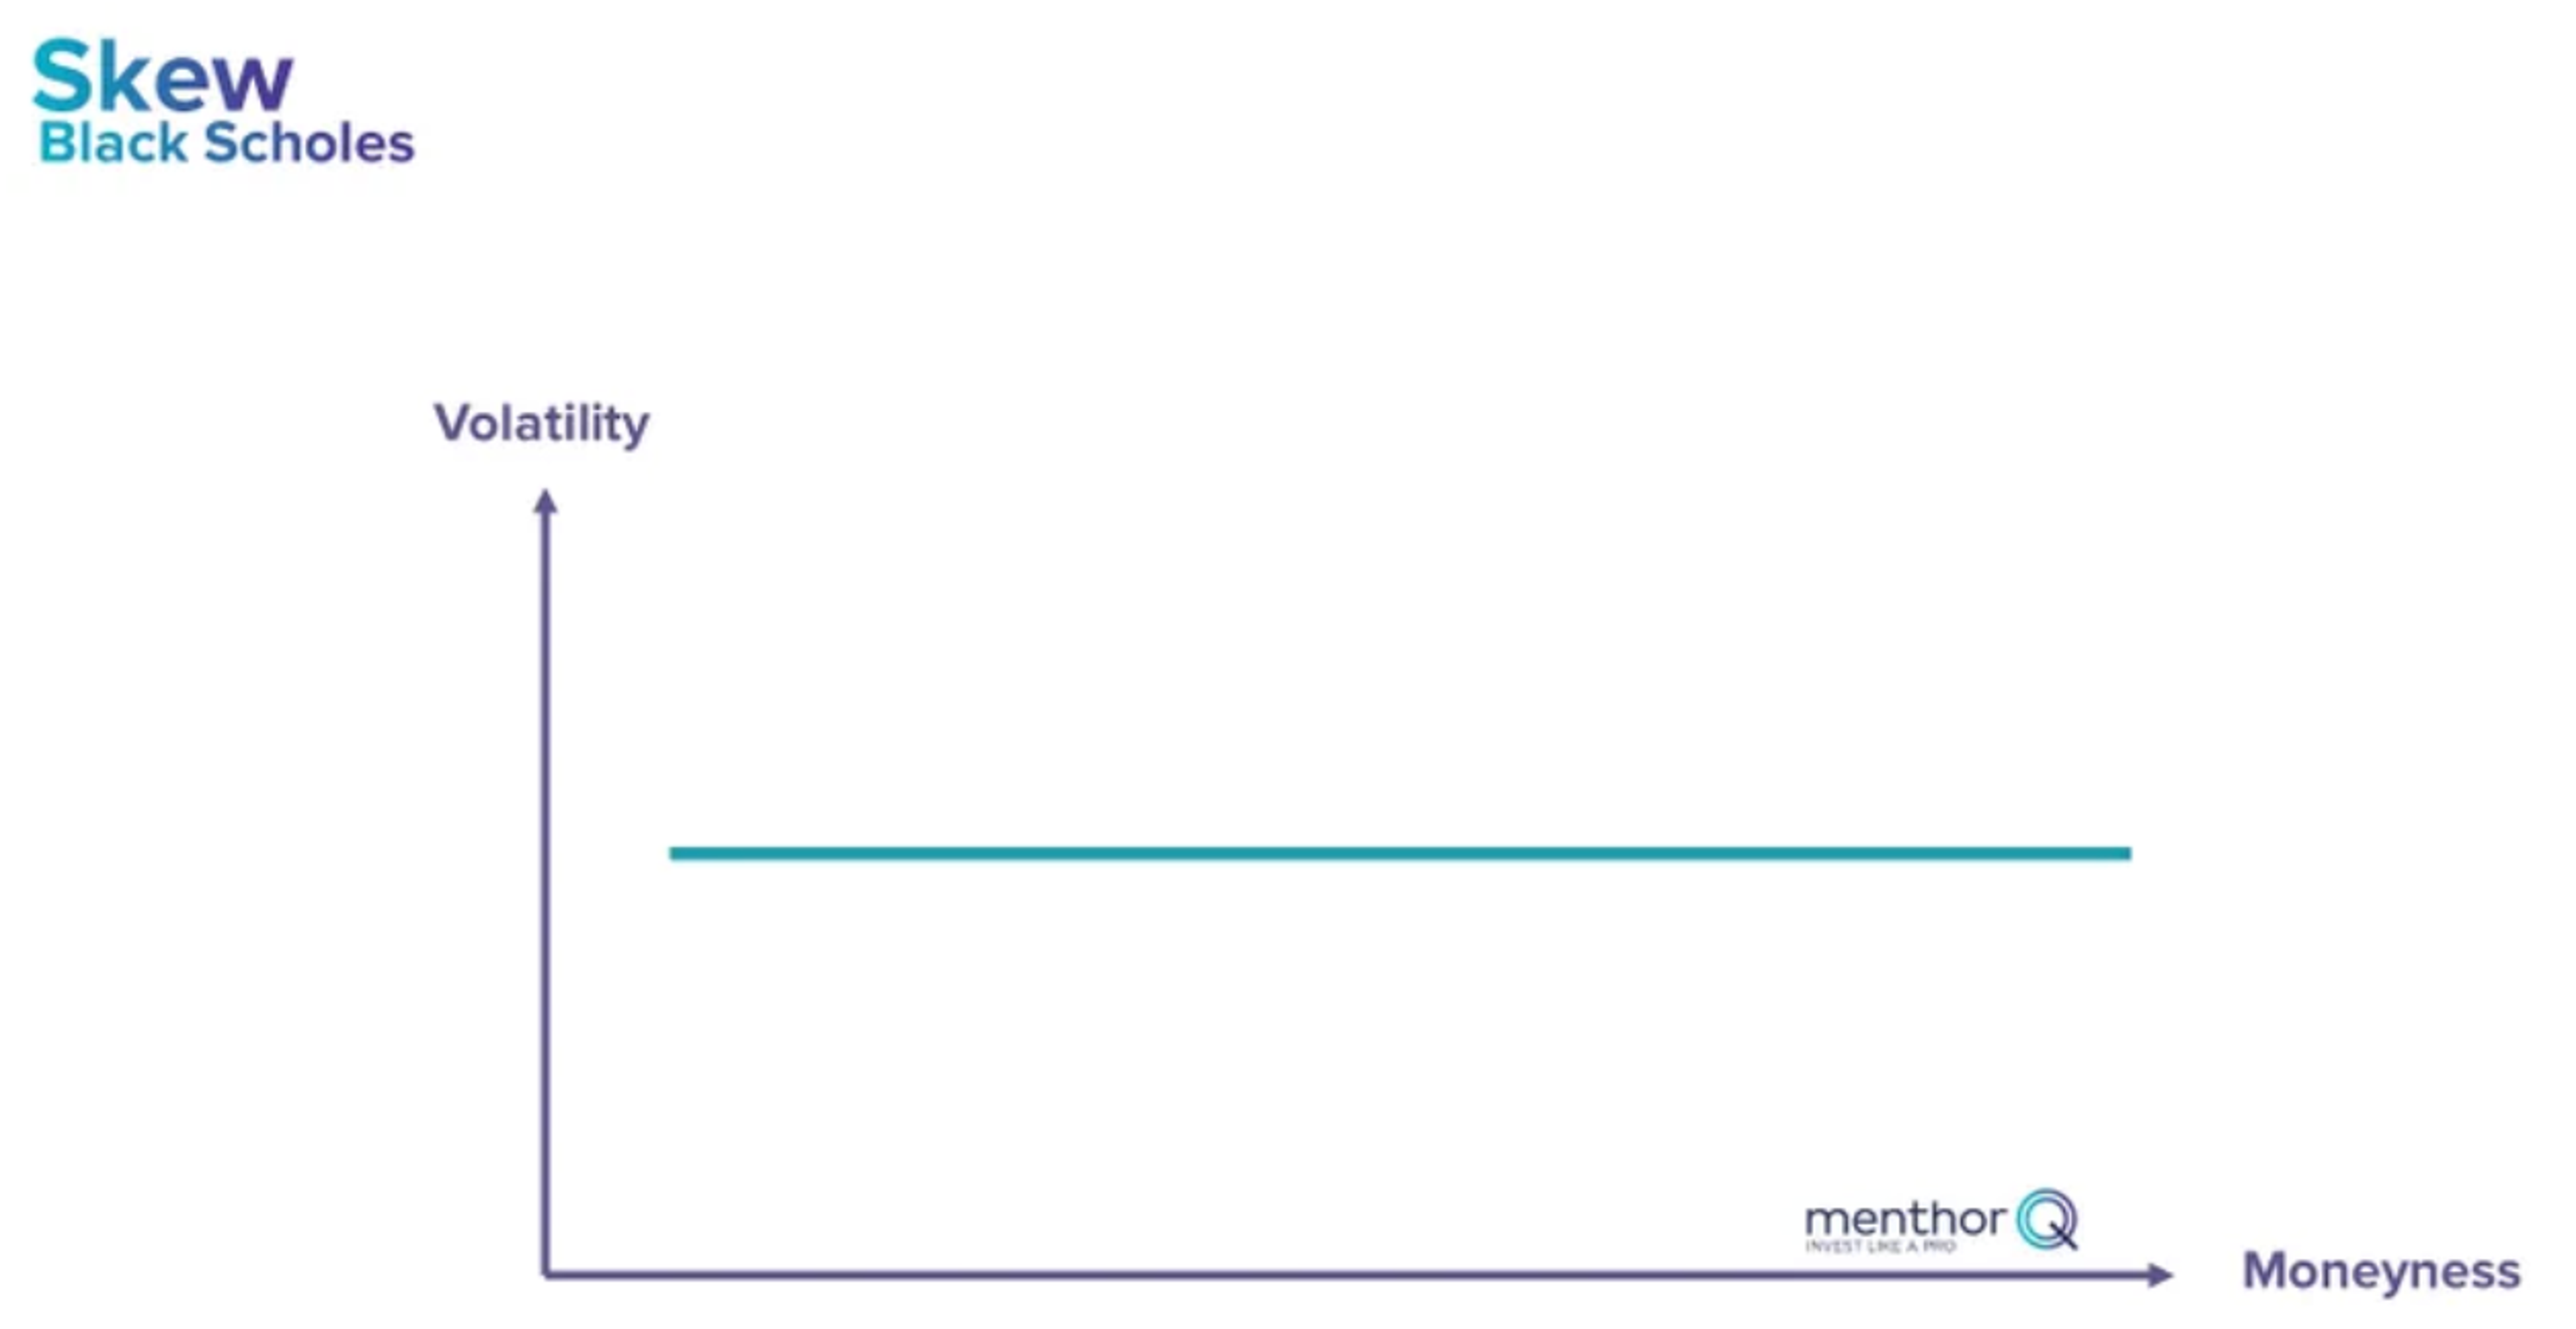
This happens because the model assumes that stock prices are log-normally distributed, like in this chart. Unfortunately as we all know, that is not the case.
Markets learned this the hard way in the 1987 crash. We now know that markets have fat tails on way up and down and those abnormal events happen outside of the normal distribution convention. These are also known as left and right tails.

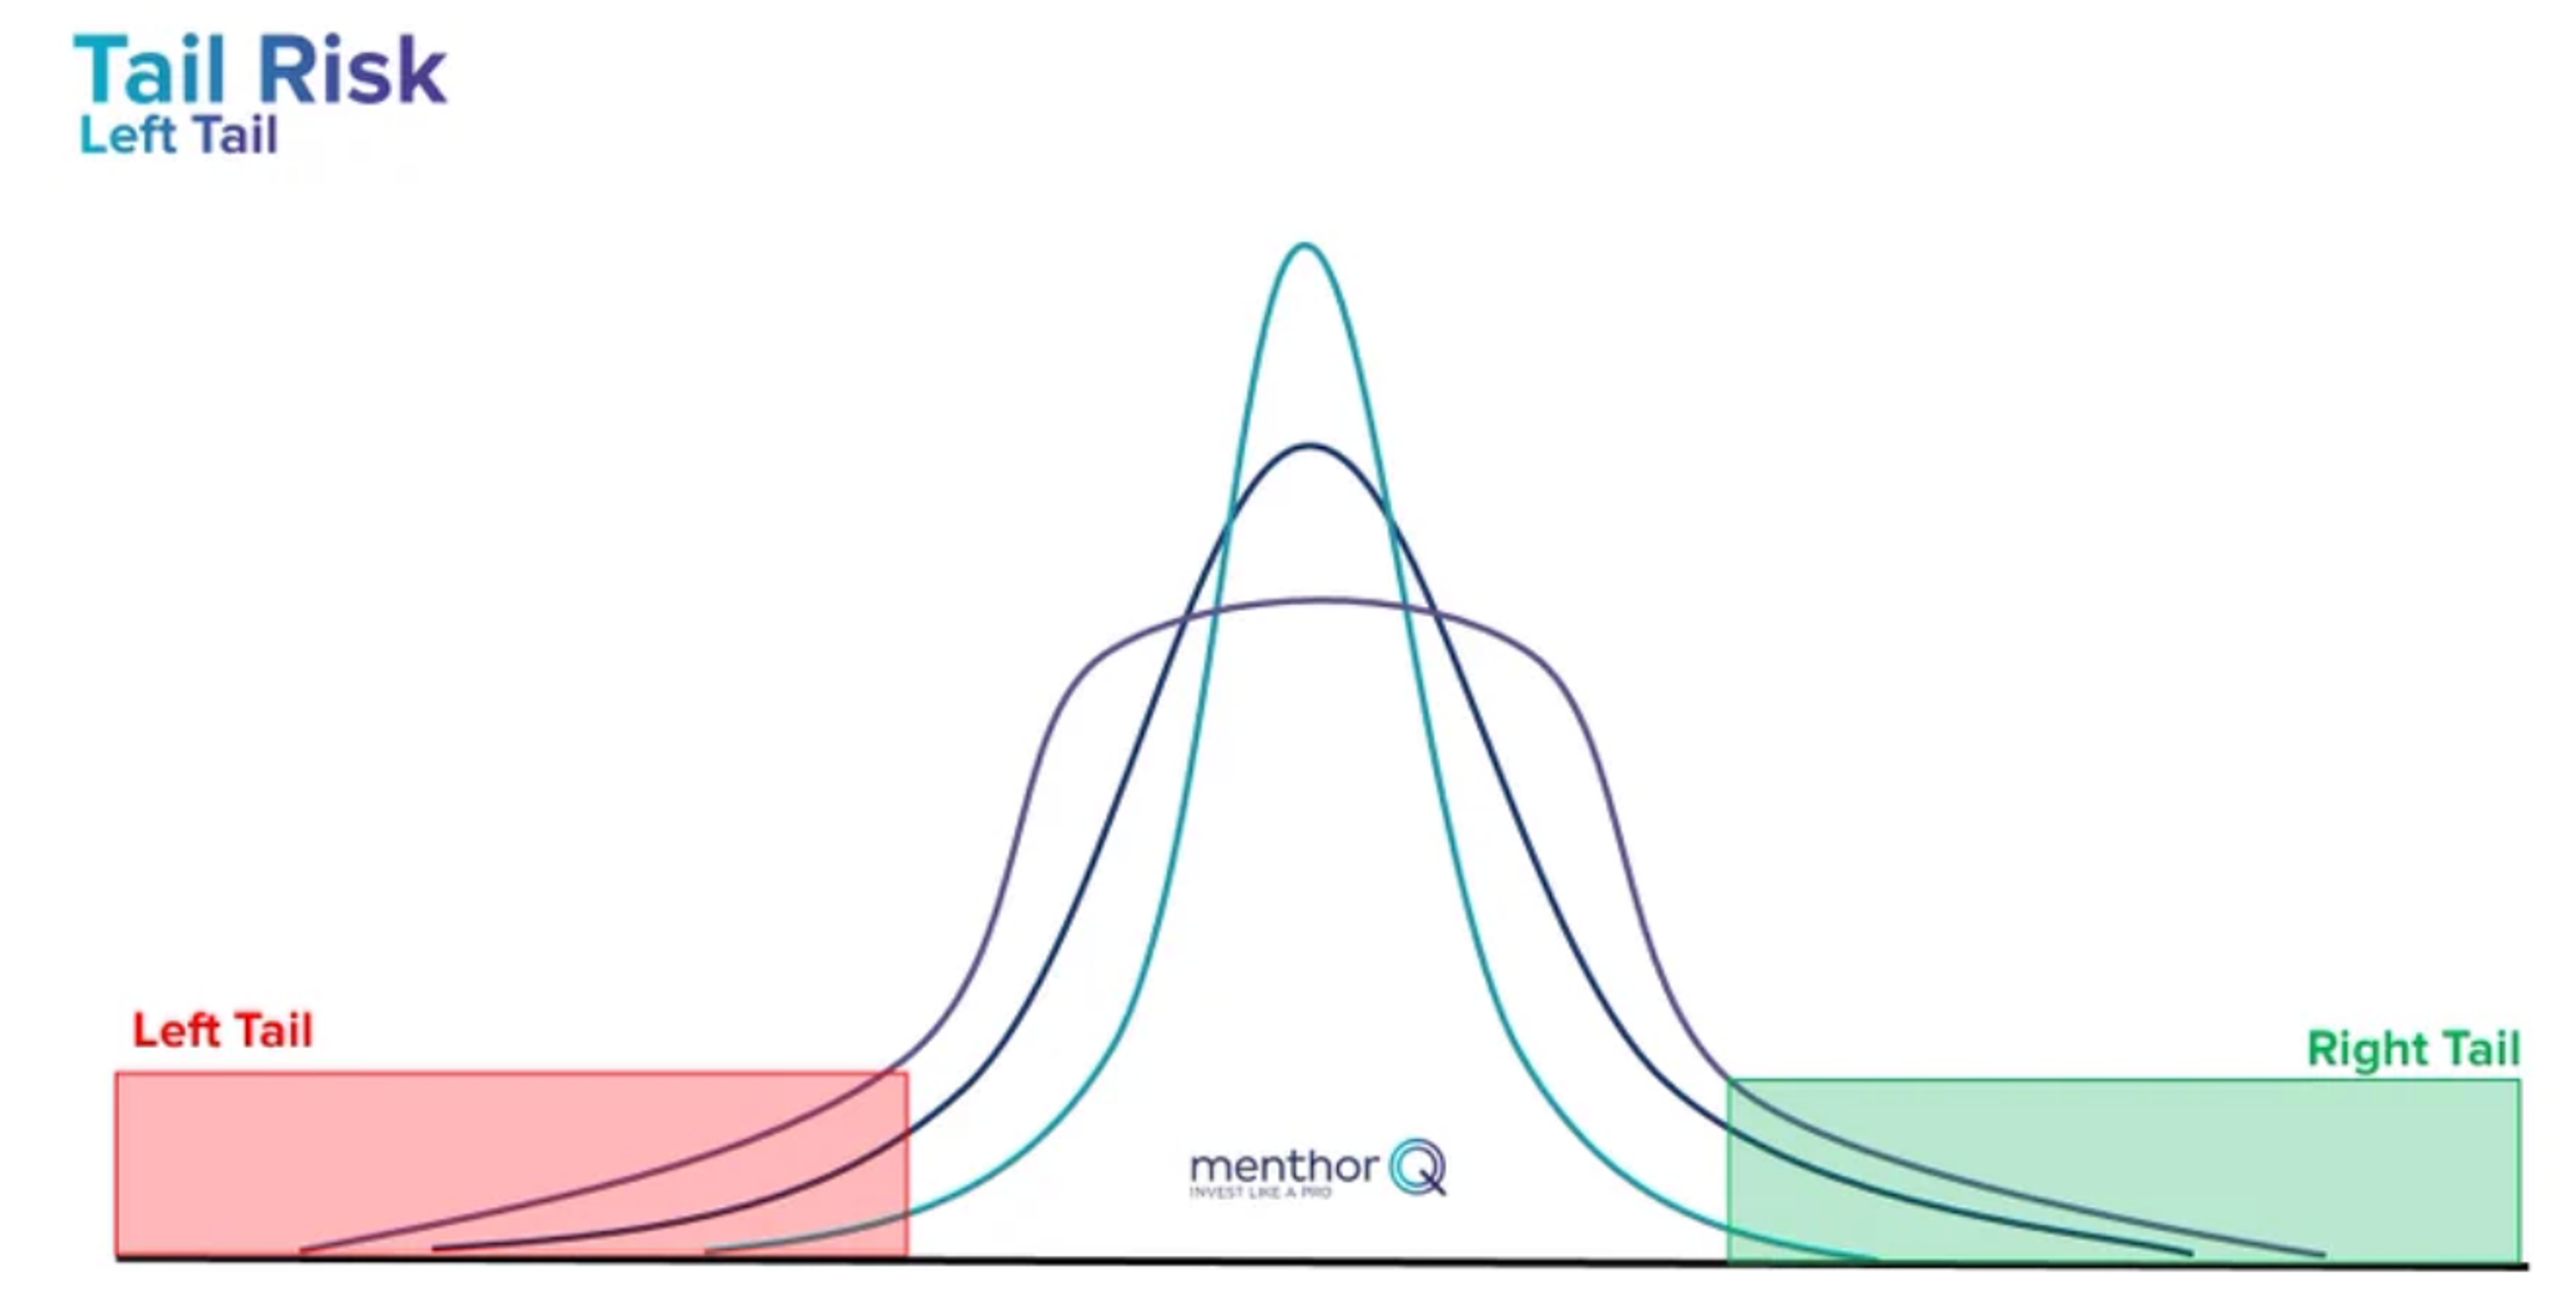
This is how the Skew was born. People do not price options based on normal distribution, but charge more for deep in the money or far out of the money options because we know abnormal events are more likely.
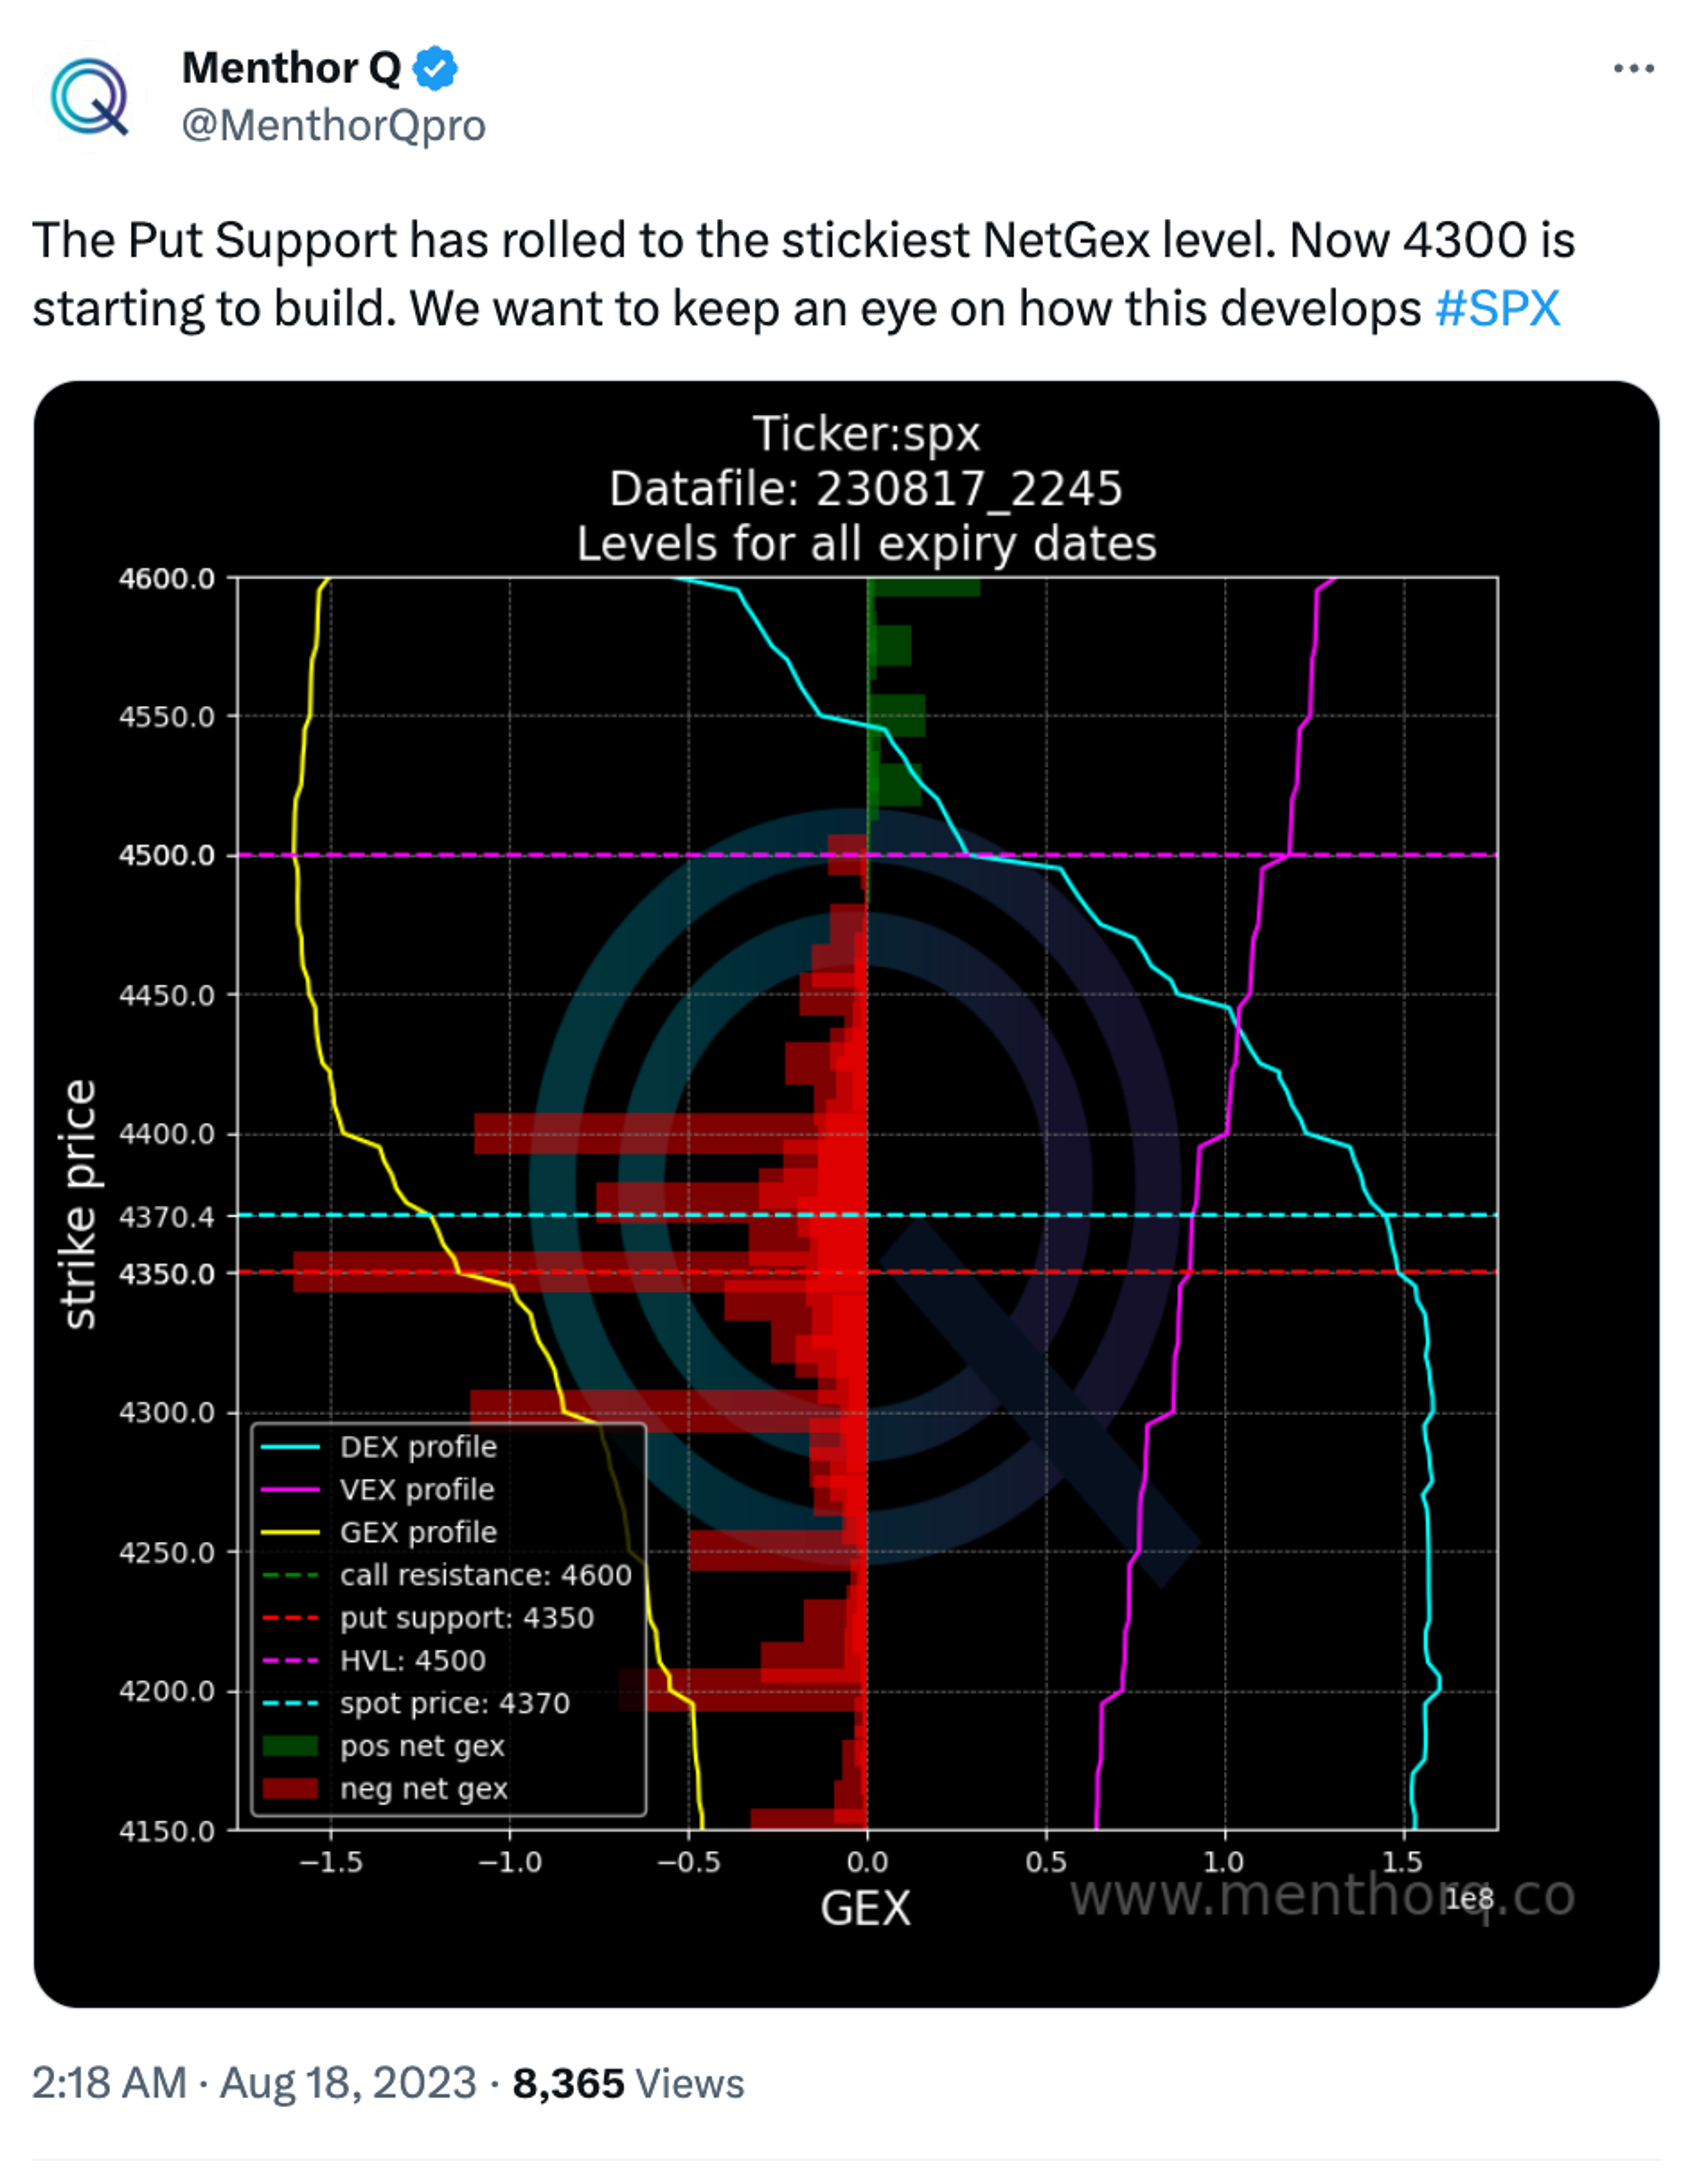
Now when we talk about sticky strikes, we refer to those strikes that are accumulating more gamma (on a net basis). Those strikes become more “sticky” because the net gamma per strike acts as i) magnet for price or ii) support resistance levels.
How Do We Track Sticky Strikes?
Sticky are trackable everyday via the Net GEX chart. The levels above the spot in green have positive gamma the ones below have negative gamma.

As the market moves in negative gamma, knowing those sticky strikes can help you understand better price action. The price tends to move around those sticky strikes as price volatility increases. Here you have an example of last week’s price action. As you can see the price tends to touch those sticky strikes during the day.

Conclusion
Understanding the difference between negative and positive gamma is essential. Because those are two completely different price regimes. Knowing what to expect during a negative gamma and how sticky strikes act can also be a good way to risk manage your book and set up your short term spread strategies.
About the Publisher: Menthor Q is a leading TradeTech company that specializes in developing advanced quantitative models for active investors. The team is made of industry experts, and is dedicated to making the financial markets more accessible and understandable to active investors. Menthor Q's models leverage the power of Big Data and AI to offer actionable and operational models to retail investors. For more information about the publisher: https://www.menthorq.co/
Disclaimer: Menthor Q LLC is a Publisher. We are not registered as a broker-dealer or financial advisor. The information, services, and materials published are purely for informational and educational purposes. It's important to note that Menthor Q LLC does not provide personalized recommendations, and any information provided should not be considered as such.
© 2025 Benzinga.com. Benzinga does not provide investment advice. All rights reserved.