
July 2023 was a good month for S&P 500, with a sizable 6-7% gain. Part of this can be attributed to July's tendency to finish positive 80% of the time over the past two decades. Some factors like positive options flow, and SPY (NYSE:SPY) breaking a resistance level played a big role. However, trends have been changing recently. We've seen seasonality drop to 63% for August, a decrease in bullish options flow, and an upcoming resistance level. These shifts could impact future prices, so it's worth keeping an eye on them.
Into The Data-Verse
Seasonality
When we review the data from July, it's easy to spot the positive trend. In fact, over the last twenty years, July has ended on a high note about 80% of the time. You can see this upward pattern clearly in the left chart, where the S&P's progress over the last two decades is averaged out.
As we transition into August though, these lines start to level off a bit. While the chance of August ending in the green is still over 50%, it's noticeably lower than July's 80% success rate – that's a 17% drop. While this shouldn't cause investors to panic, it's worth keeping in mind as a gentle reminder to be a bit more cautious.


Options Flow
Flow data has been growing in importance, especially with the uptick in options flow activity over the past five years, and now with the new introduction of same-day expiry options. While there's a ton of stuff we could look at, we'll focus on a few simple bits to get a clear picture.
One of the easiest ways to see options flow activity in the whole market is something called Daily Deltas, or DEX for short. DEX takes the options flow deltas from every stock in the market and makes a bar chart for each day. Green bars signify bullish sentiment while red bars signify bearish sentiment.
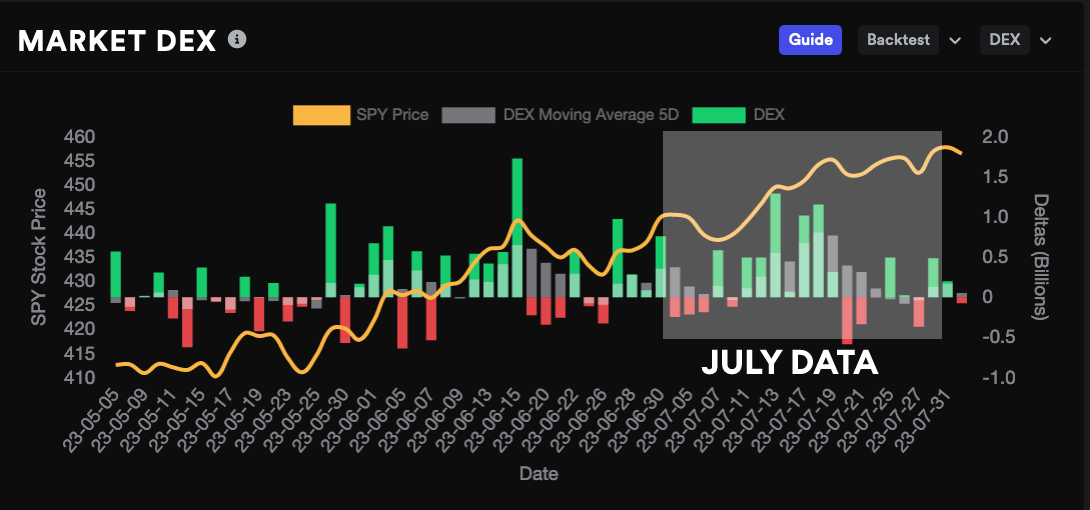


When we look at the July data, it's clear there were a lot of big green days - a lot of positive action in the options flow. If we take a peek at the past few months, July seems to have had the most green days, along with some of the tallest bars.
But as August kicks in, things are shifting a bit. The bars are still green but they're not as tall as before. Plus, we're starting to see more red bars popping up. It'll be intriguing to see if this pattern sticks around, and if it does, how prices will respond. If the options flow stays positive, we could continue to climb. But the data from the past few days has been more of a mixed bag.
Price Action
For some folks, price action is king. If that sounds like you, let's dive into some key points for the price action of SPY. There was a sticking point around the 430 mark, which had acted as both a resistance and a support level in the past. We tried to push past it a few times but couldn't quite make it. However, we finally managed to break through in late June or early July.
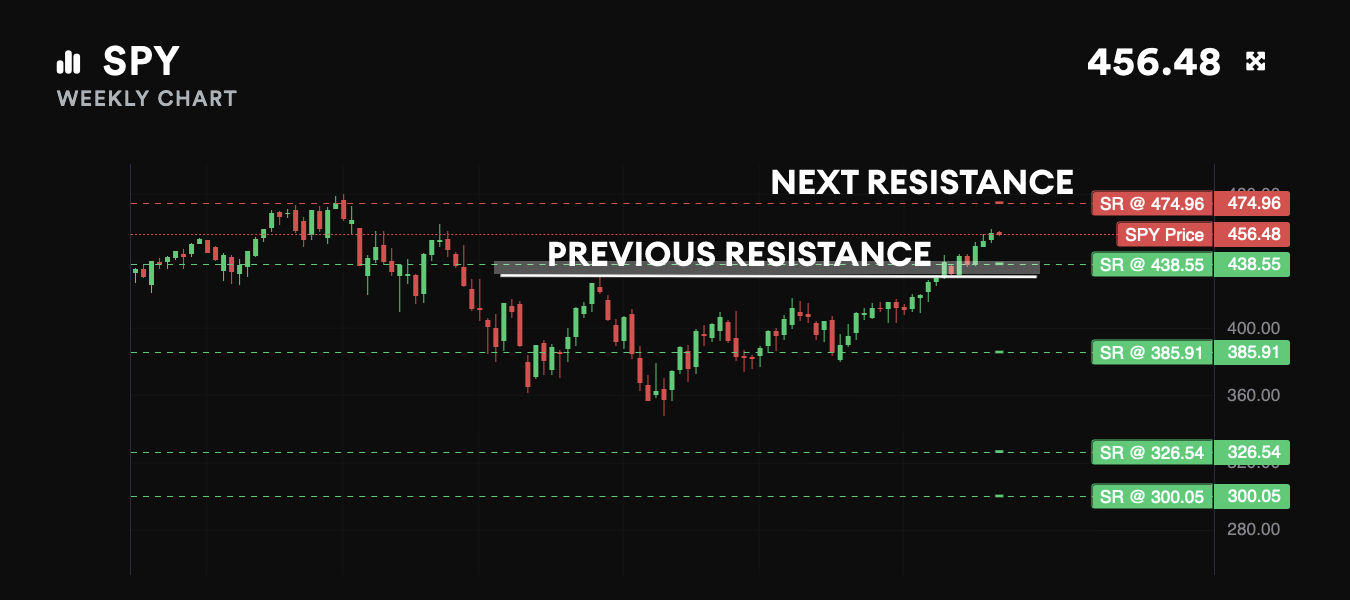


After a few days of testing, we managed to find support at the 430 level, paving the way for our upward march. From the auto-generated support/resistance levels above, you can see the next hurdle lies around the 470 mark. We still have a bit of a climb to get there, but it's definitely on the horizon! For any more upward movement, the bulls will need to push past this level. However, given how far we've come, we might hit a wall at that point instead of breezing right through.
Another useful thing to check out is the largest darkpool trades/levels over the past month. These levels can often shed light on where the big money is sitting. Here are these levels plotted on the daily SPY's chart.


Two key things stand out here. Firstly, we've got over a billion dollars worth of darkpool trades at our current price levels. But after that, there's a notable gap from 453 to 445 in terms of big darkpool trades. This could suggest that if the price drops from 455 to 445, it may not find much support. Adding to this, as we observed in the support and resistance levels above, there isn't a distinct support level on the weekly chart until we reach about 440.
Conclusion
Wrapping up, July was a fantastic month for S&P, with a noteworthy 6-7% gain. A mix of typical summer growth, breaking a critical resistance level, and enthusiastic options flow led to this outcome.
As we step into August, the scene appears to be changing slightly. Seasonality is still on our side, but not as strongly as July. Options flow data is less bullish, and price action shows potential resistance at around 470.
Adding to this, darkpool trades data reveal over a billion dollars worth of trades at our current levels but suggest less support in the event of a downward move from 455 to 445.
In conclusion, although the outlook is mostly upbeat, investors should stay vigilant, watch the data, and be prepared for any market shift.
This article was written using data from Tradytics.
© 2025 Benzinga.com. Benzinga does not provide investment advice. All rights reserved.