On the weekly chart, we can see that Gold has made a four-week push from lows of $1,680/oz to its current trading price close to $1,790/oz. However, sentiment may be slightly bearish for Gold at the moment with many indicators pointing to the price falling. For one, there is a bearish indicator on the monthly chart with a solidly formed double top pattern with intra-month prices butting up against US$2,070/oz at those peaks. From a long-term downside point of view, we might expect $1,670/oz to act as a support barrier, just as it has for the past five downside tests, going back to May 2020. But sellers would have to bust through $1,765/oz, $1,340/oz and $1,707/oz, before the sub-1,700 supports come into play. Unfortunately, the RSI is acting indifferent on the monthly frame and not suggesting momentum one way or the other just yet. Whereas the Commodity Channel Index is firmly in negative territory, although turned sharply upwards.

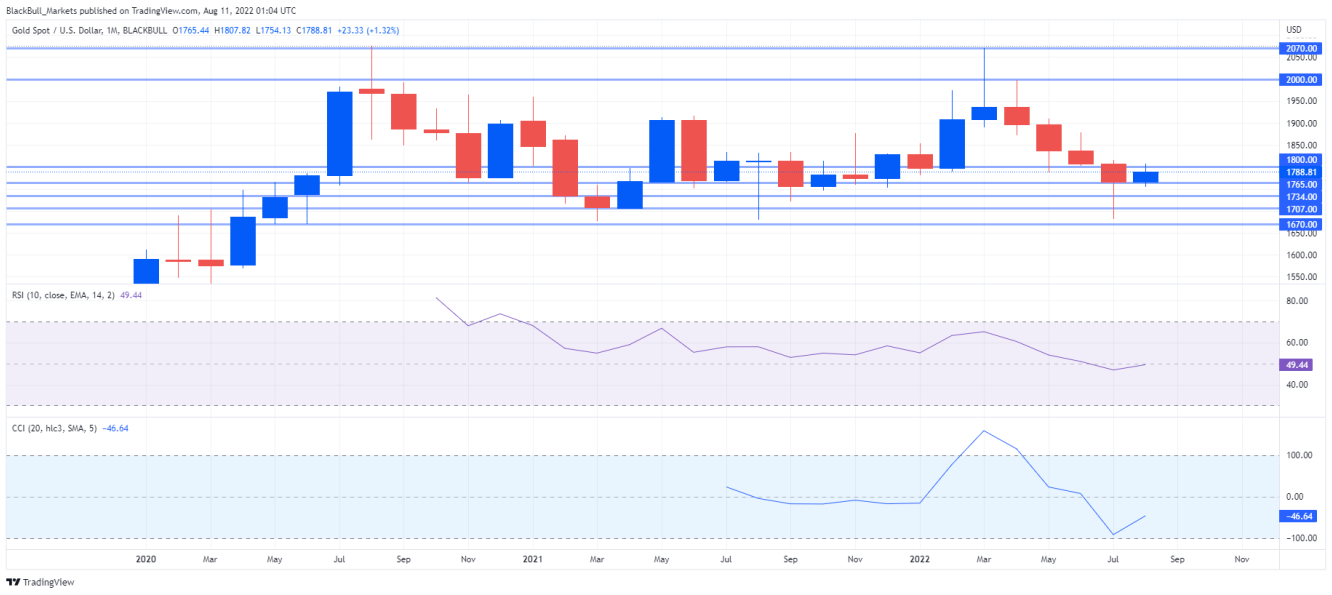
XAU/USD 1M, with RSI and CCI Indicator

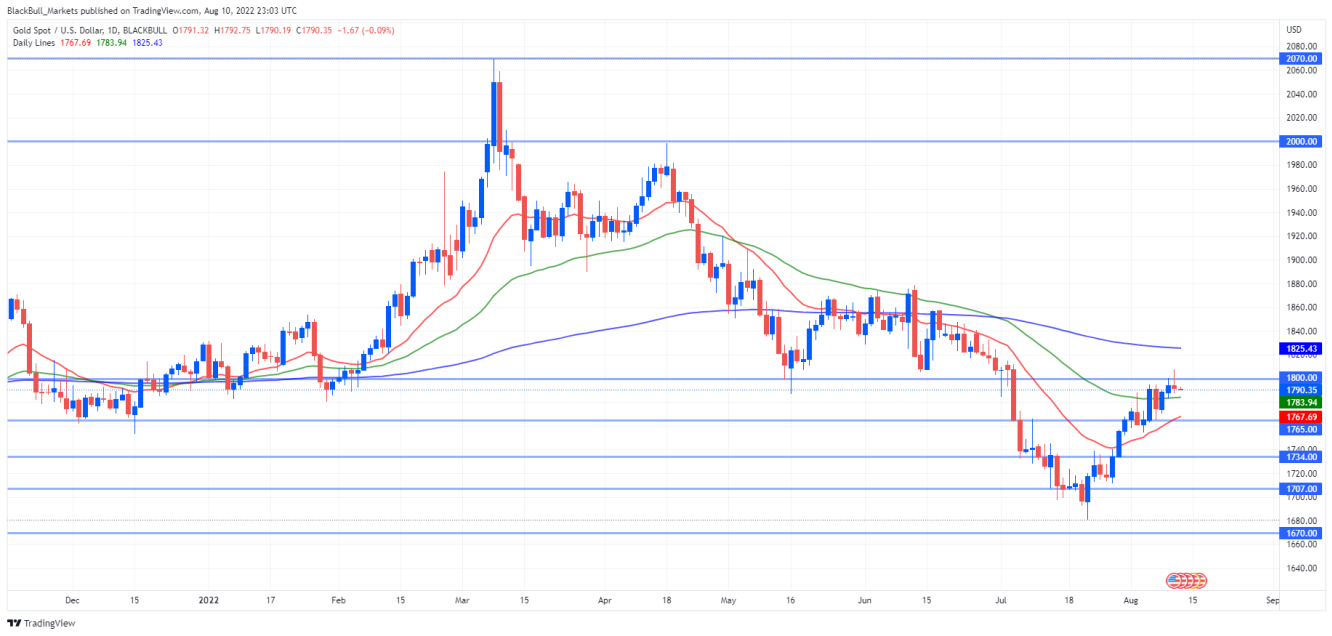
XAU/USD 1D, with 20-50-200 Daily Moving Averages
© 2025 Benzinga.com. Benzinga does not provide investment advice. All rights reserved.
Trade confidently with insights and alerts from analyst ratings, free reports and breaking news that affects the stocks you care about.

