

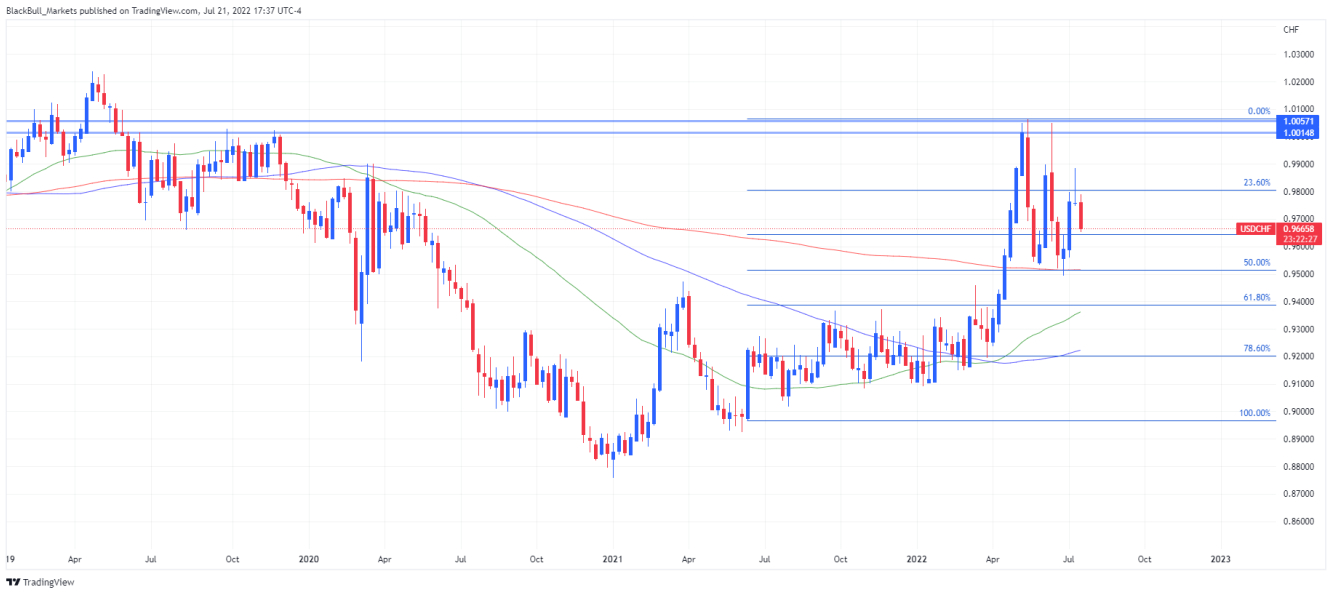
The USDCHF pair has been swinging from bullish to bearish from a weekly perspective on this pair. It has established strong resistances at 1.00571 to 1.00148, forming a double top as it tried to break these levels. The double top rejection resulted in the USDCHF pushing back down and bouncing off 0.94907. This price level corresponds to the 200 MA and the 0.5 fib level.


USDCHF 1W, with 50, 100, 200 Moving Average


From the perspective of the daily time frame, the USDCHF pair recently met a resistance around 0.974. At this point the 50 Moving Average signaled traders to possible further downwards movement of the pair. A key level to watch out for is 0.95959 or around the 100 MA. This level needs to hold for the price to move upwards and possibly test the resistance again. If this level doesn’t hold, the price could potentially reach the fib’s golden pocket of 0.618 around 0.93568 and the weekly 50 MA. If the price still goes further down the price could reach and test the 200 MA. Further afield, if the price smashes through all these supports, there could be a possible test of support around 0.883.

USDCHF 1D, with 50, 100, 200 Moving Average
The overall market sentiment for USDCHF is still bearish, as it has been since the start of April. Market participants might except further downside on the pair possibly even down to 0.883 support. Traders who choose to take a position and trade USDCHF should watch out for the levels mentioned above and position themselves wisely. Shorting the top or near the top of relief pumps might be a safer trade than taking longs on supports in hopes of a relief pump.
© 2025 Benzinga.com. Benzinga does not provide investment advice. All rights reserved.
Trade confidently with insights and alerts from analyst ratings, free reports and breaking news that affects the stocks you care about.

