When it comes to forex trading, understanding market movements and price trends is essential for success. One of the most effective tools traders use to navigate this landscape is chart patterns. These visual representations of price action reveal underlying market psychology and can signal potential trading opportunities. By recognizing and interpreting these patterns, traders can make informed decisions, manage risks, and enhance their overall trading strategies.
In this guide, we will explore some of the best forex chart patterns, including their formation, significance, and how to trade them effectively. From classic patterns like head and shoulders to more complex formations such as flags and pennants, each pattern tells a unique story about market behavior.
What is a Forex Chart Pattern?
A forex chart pattern is a sequence that repeats throughout the forex chart and plays out in a specific way that is reliable enough to predict price movement.
These patterns belong to one of three groups — traditional patterns, candlestick patterns and harmonic patterns. However, forex traders favor candlestick patterns because candlestick charts are the most popular chart pattern nowadays.
Forex chart patterns fall into three categories — reversal, continuation and bilateral. While continuation patterns signal that the prevailing trend line will resume, reversal patterns signal its shift. Bilateral chart patterns are more complex because they signal that the price can go either way and tend to require more attention and experience.
One of the best comprehensive overviews of chart patterns is the “Encyclopedia of Chart Patterns” by Thomas Bulkowski.
8 Best Chart Patterns Forex Traders Should Know
The following patterns belong to some of the most popular and reliable chart technical patterns forex traders use in their analysis. Here is a forex chart pattern cheat sheet.
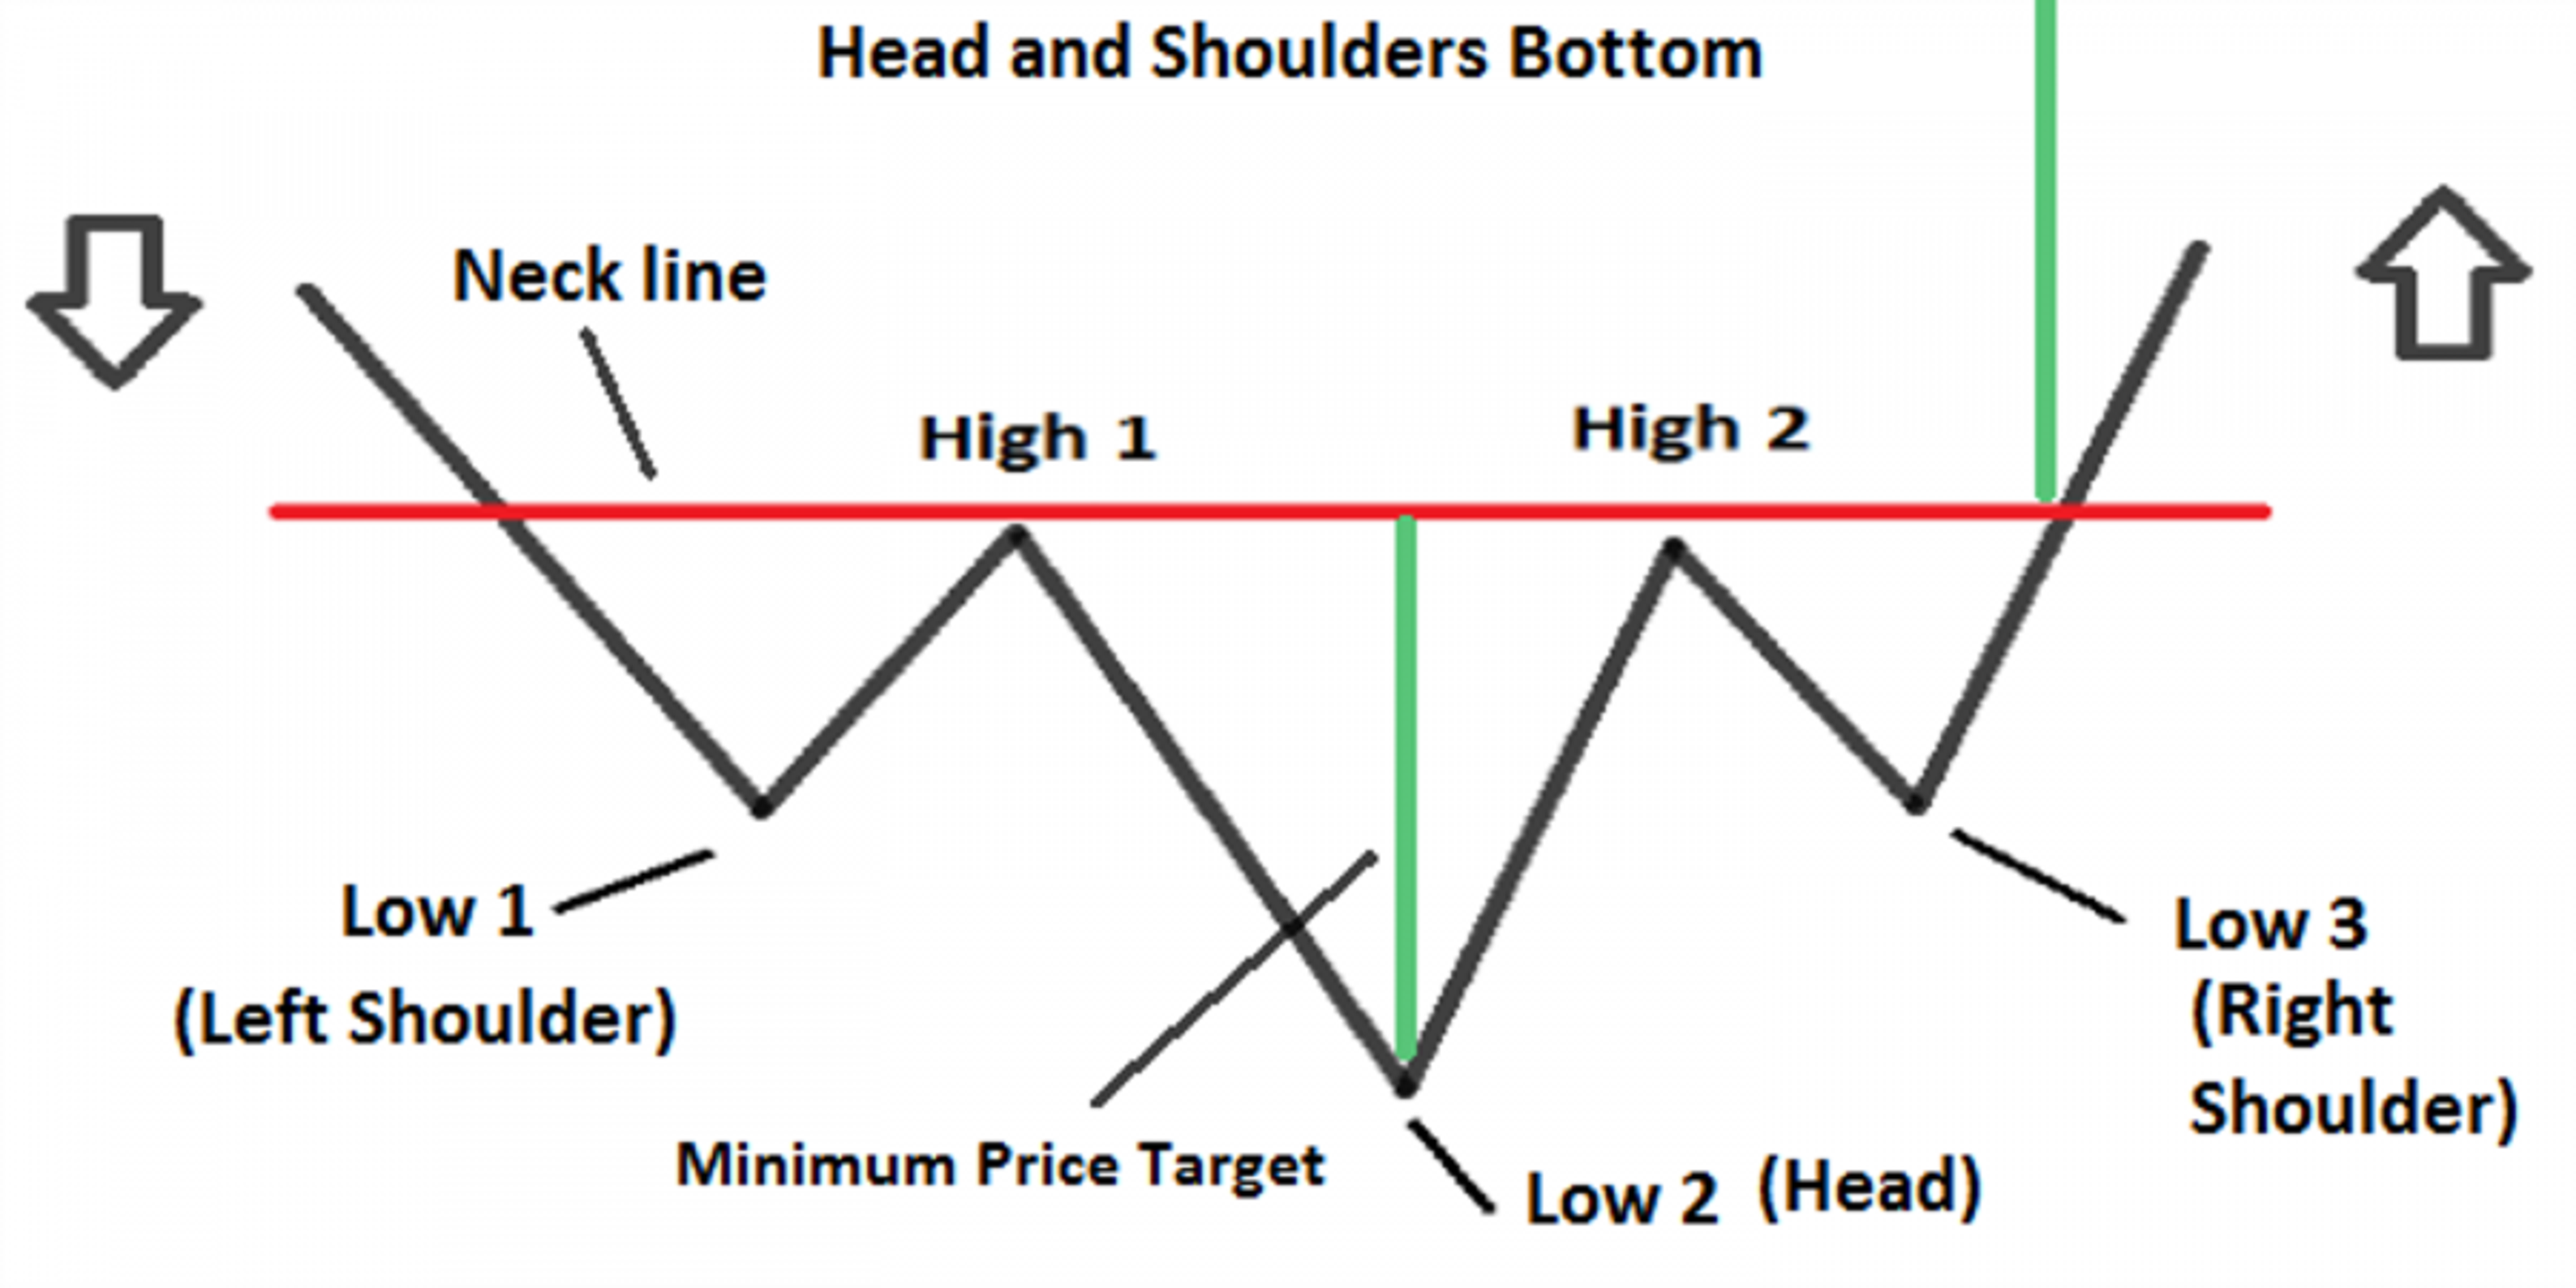
Head and Shoulders
The most famous chart pattern is characterized by three peaks, with the middle one being the most prominent. The baseline of those peaks is referred to as the neckline. The head and shoulders indicator is a reversal chart formation, with the anticipated move equal to the distance between the neckline and the highest peak.

Learn more: Head and shoulders pattern
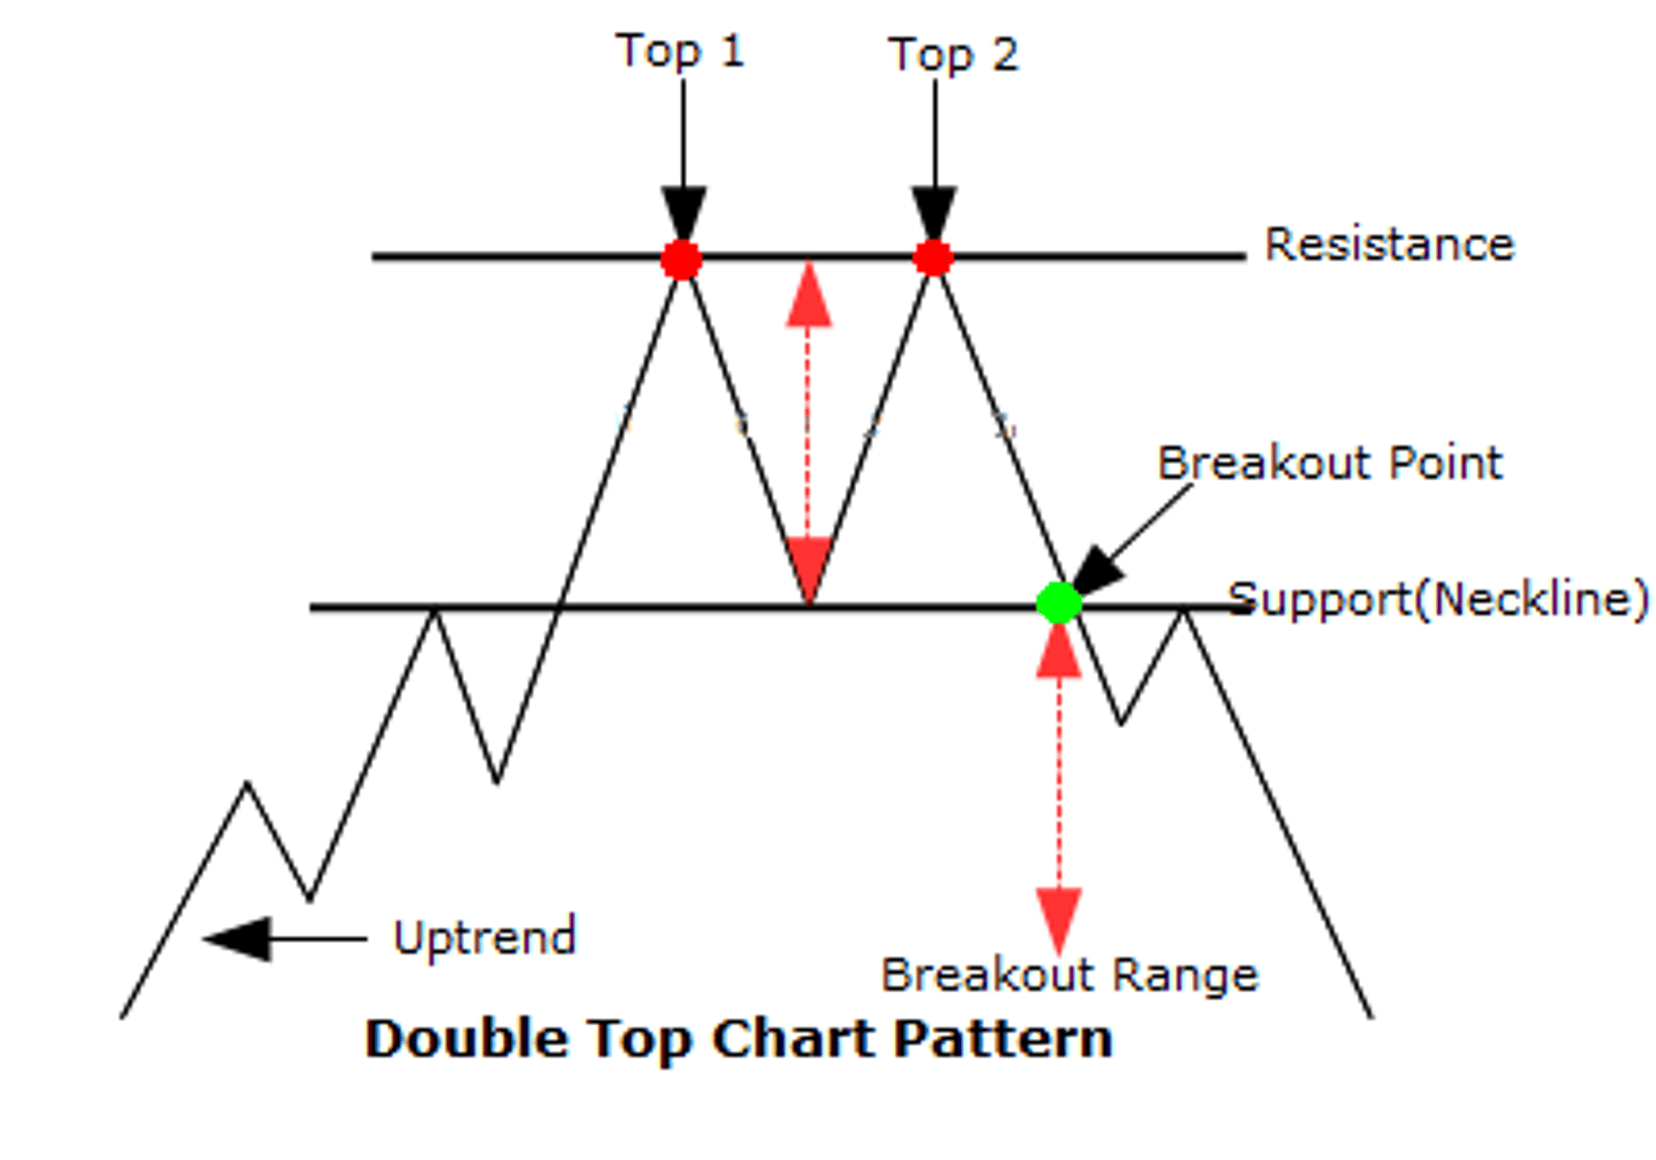
Double Top and Double Bottom
Double tops and douple bottom chart patterns are reversal patterns resembling the letters M or W. When a price rises and returns to the baseline before rising again to an equal high, it signals a potential double top. Breaking the baseline (support) indicates a likely decline equal to the height of the formation. The same works for a double bottom, just in the opposite. These patterns take some time to form, giving traders plenty of time to spot them and plan.

Learn more: Double top pattern
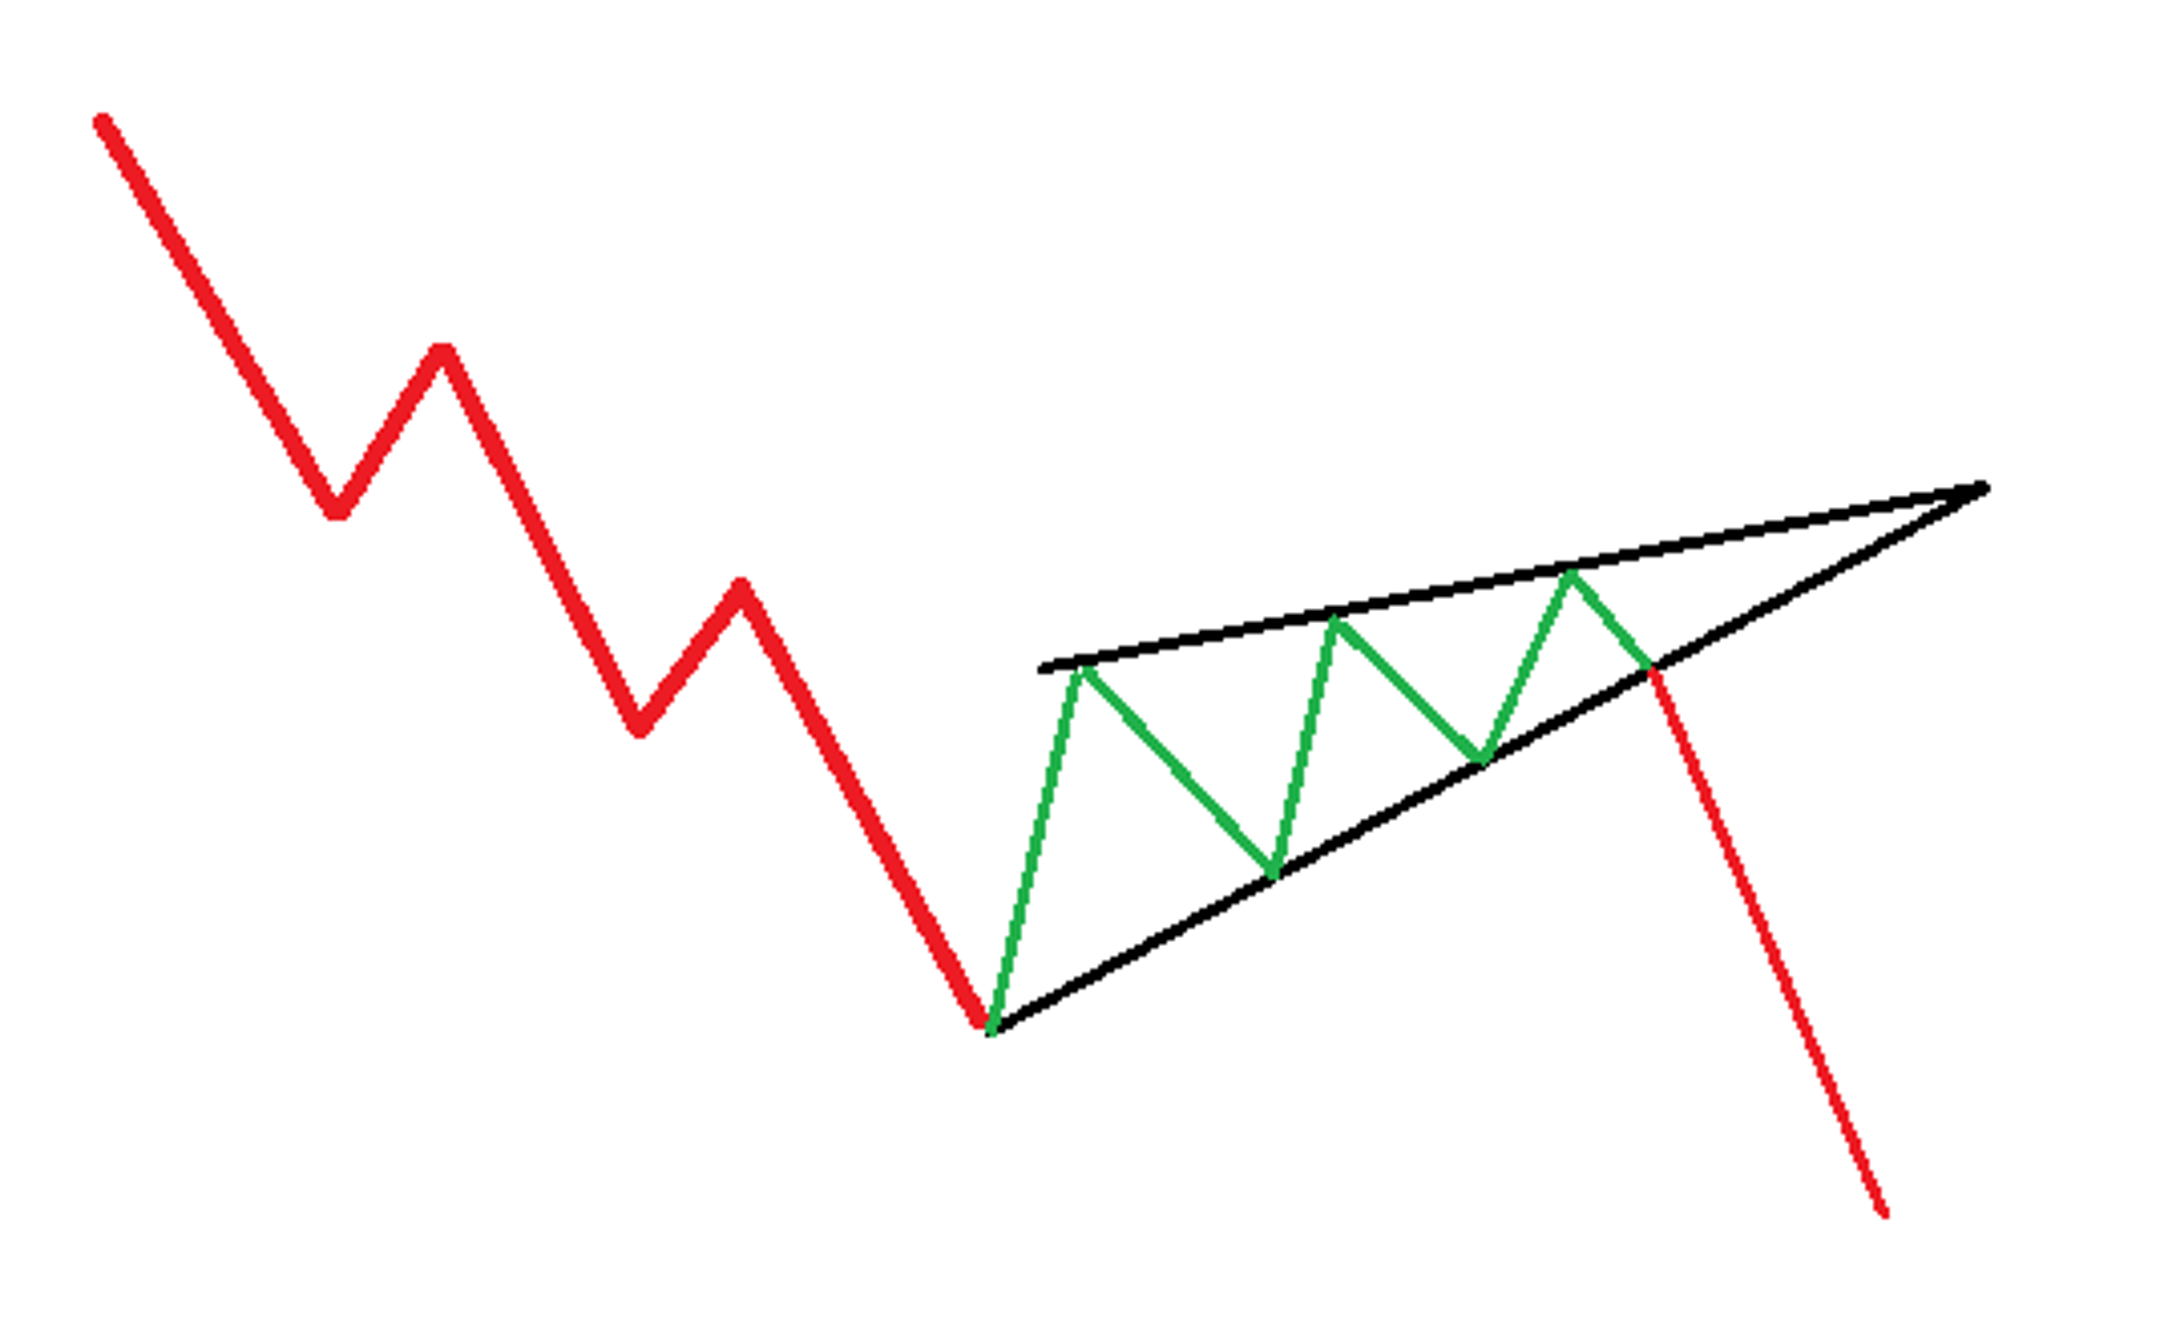
Rising and Falling Wedge Pattern
Wedge is a continuation pattern that predicts a trend continuation after a short period of indecisiveness. At first glance, a wedge might look like a flag, but the difference is in the trendline angle. Rising wedges are tradeable in the bearish trend while falling wedges make for a good setup in the bullish trend. Traders look to enter the position after the wedge breaks, using the width of the pattern as a profit target and placing a stop-loss below the support or above the resistance.

Learn more: Rising wedge pattern and falling wedge pattern
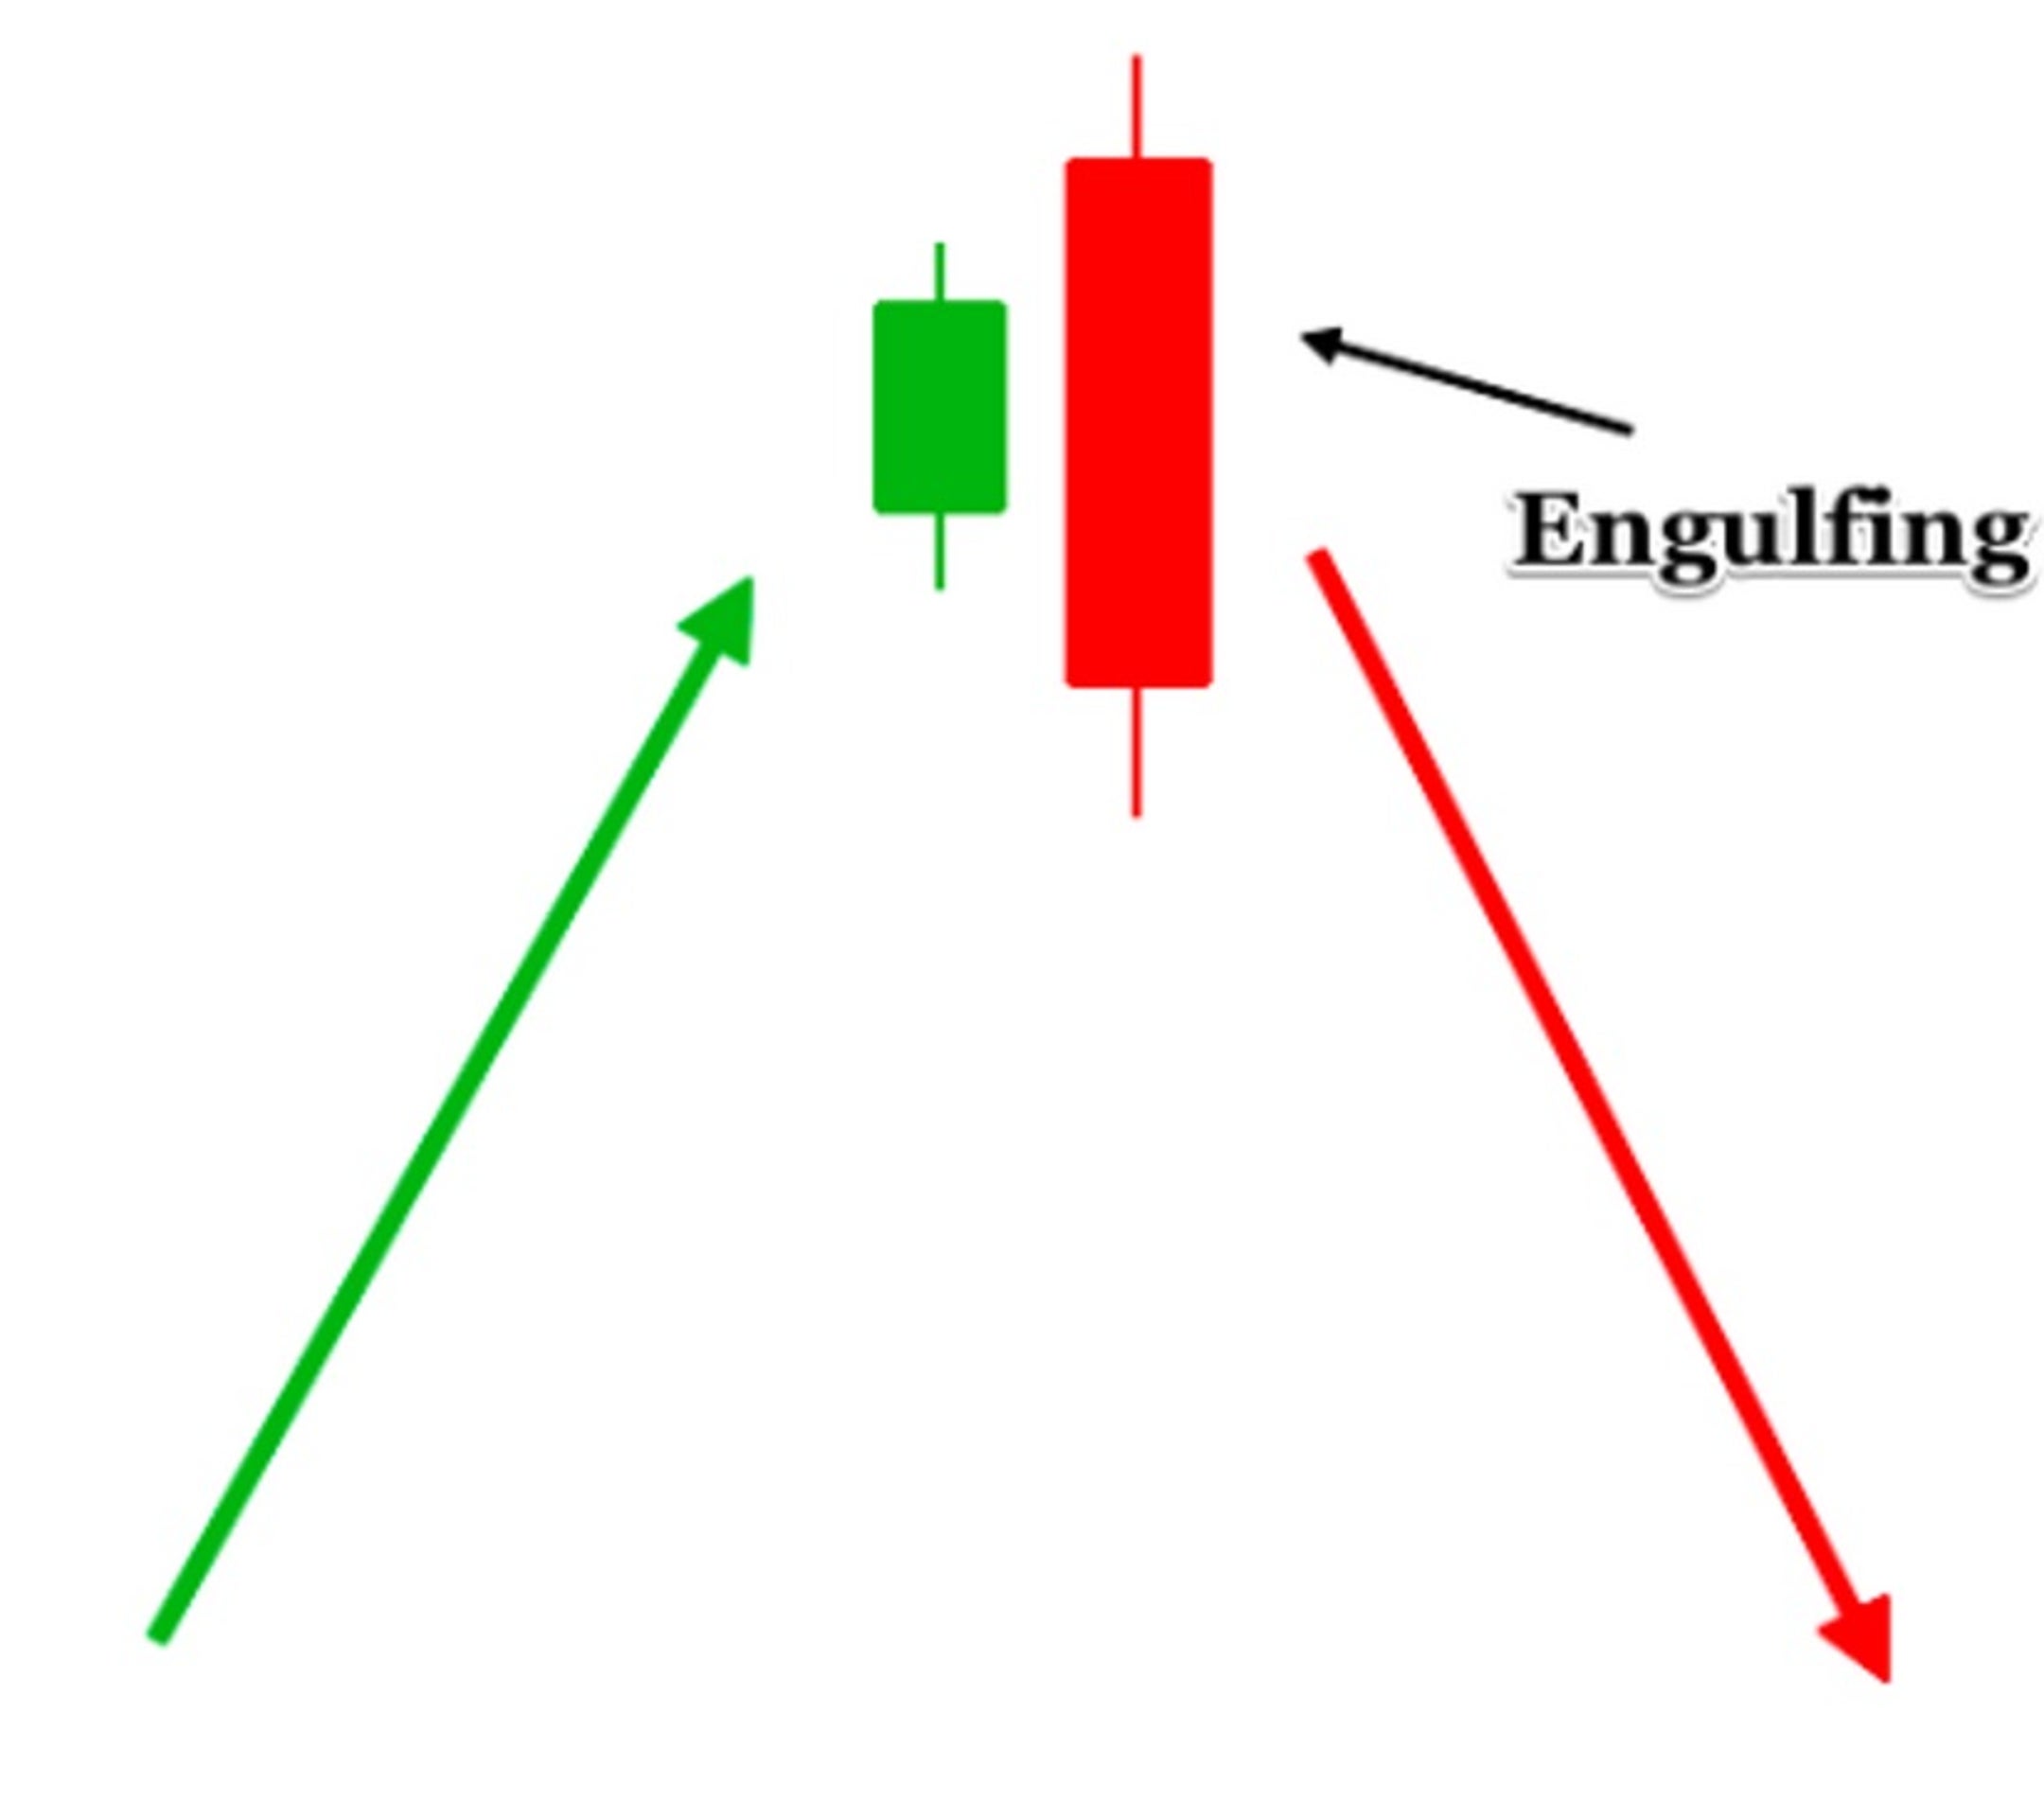
Engulfing Patterns
Engulfing pattern is a candlestick reversal chart pattern that consists of two candles. The first candle is small, while the second one is larger and completely engulfs the previous candle’s body and its wicks.
Engulfing patterns come in two types. A bullish engulfing pattern forms at the end of a downtrend when a large bullish candle engulfs a small bearish candle. Conversely, a bearish engulfing pattern forms at the end of an uptrend when a large bearish candle engulfs a small bullish candle.

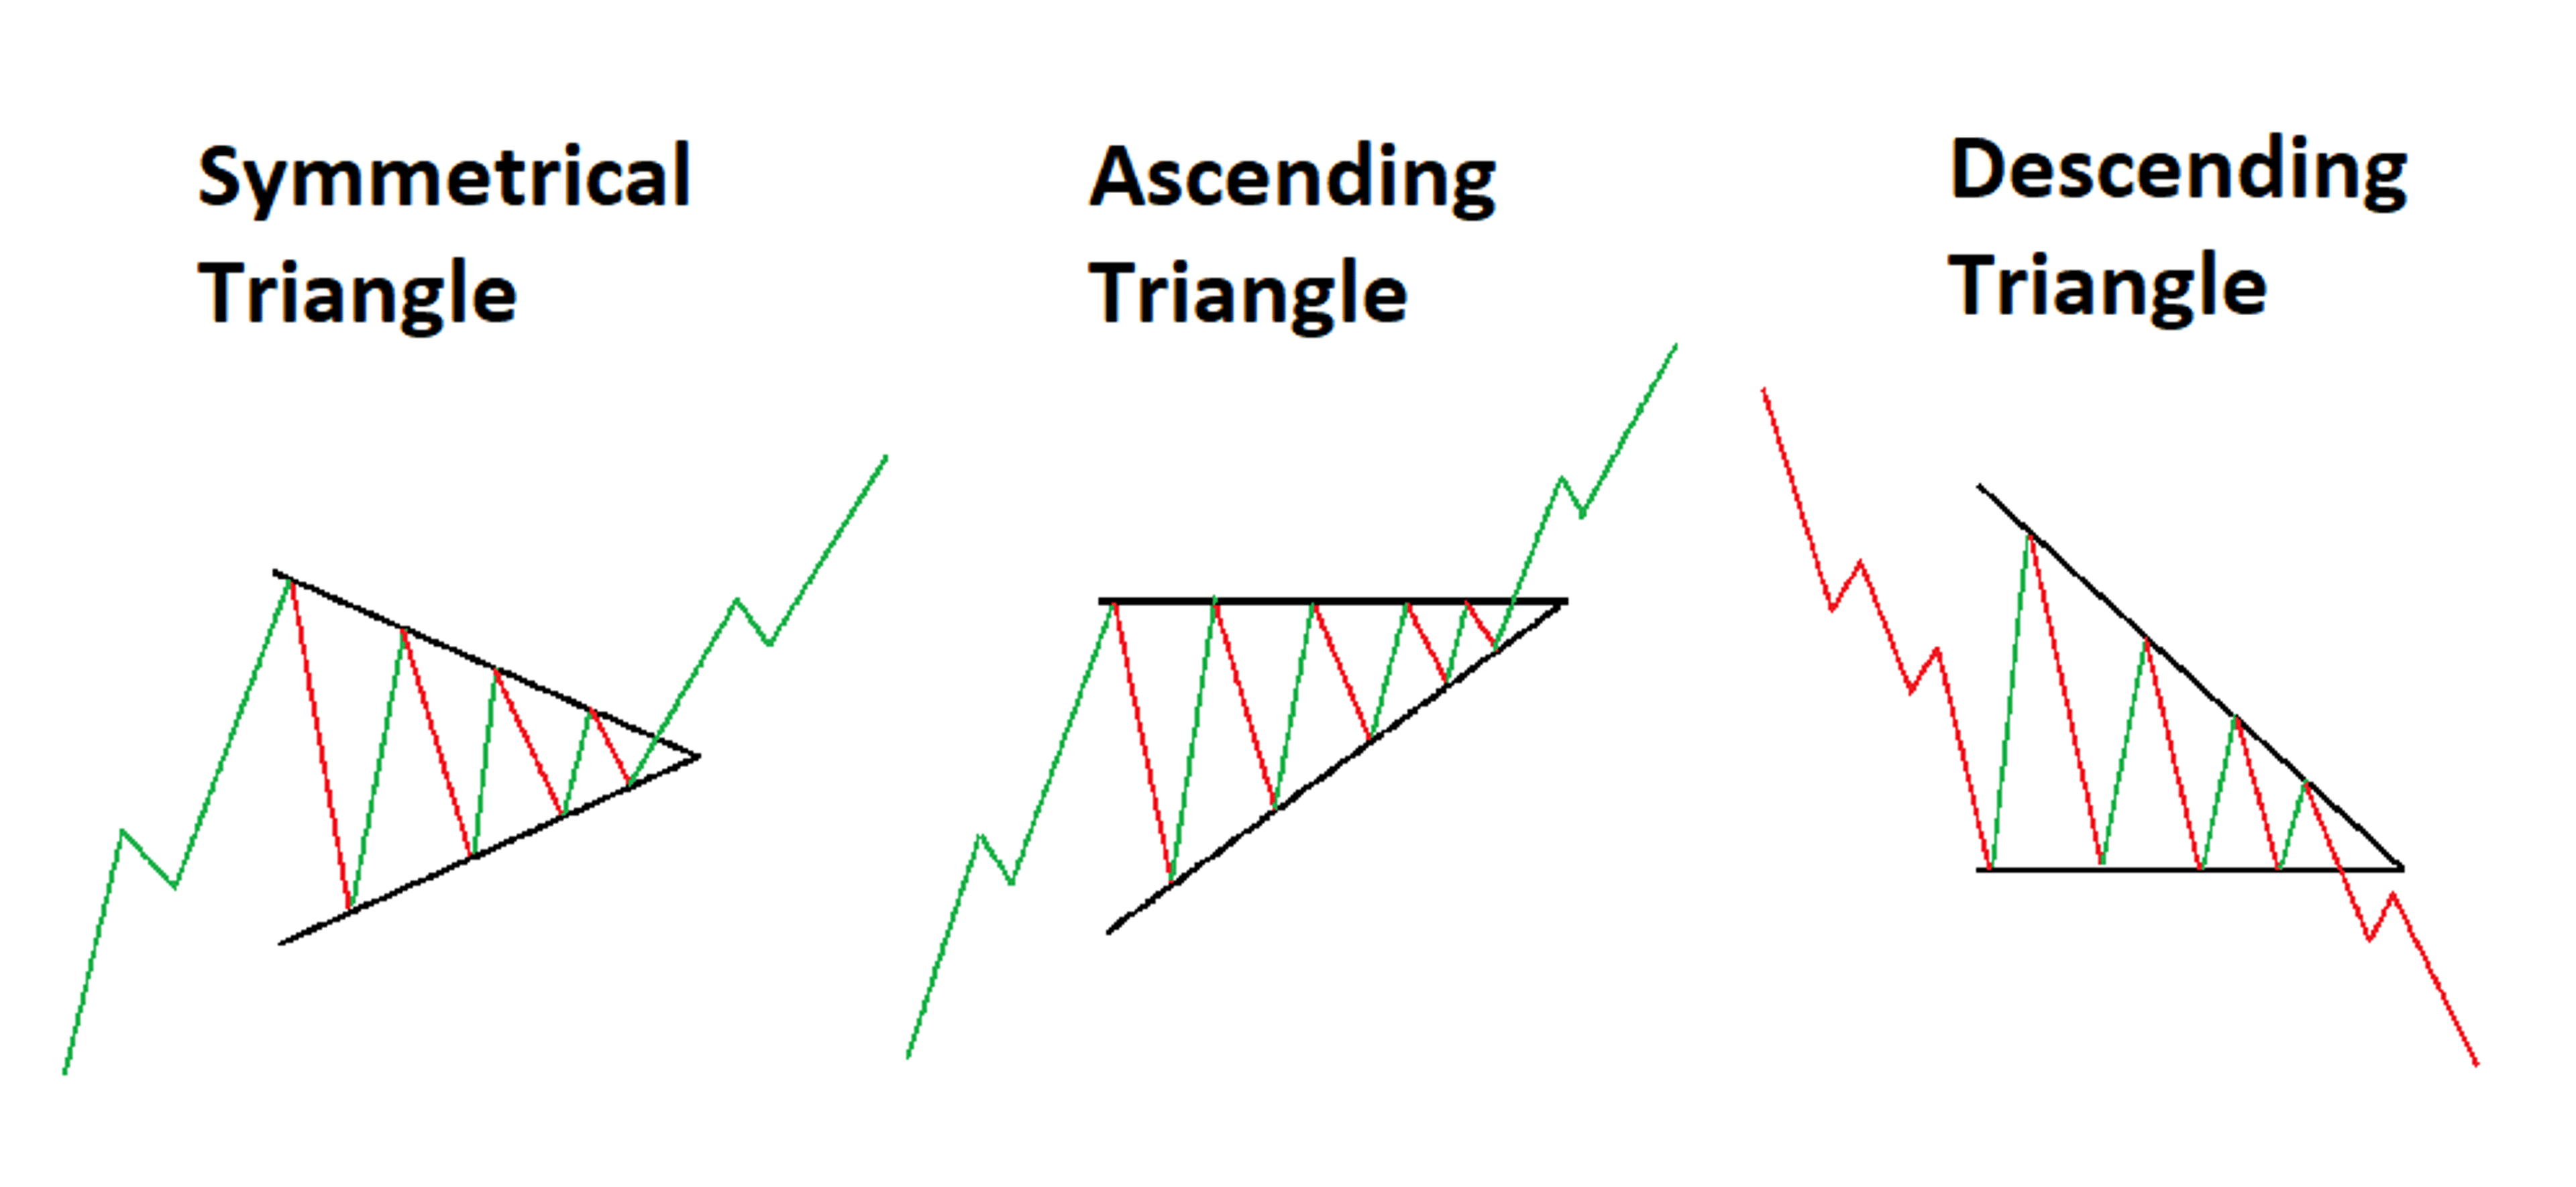
Triangle Patterns
Triangle patterns are bilateral chart formations that go either way but have one thing in common — they signal a heightened probability of a breakout as the price approaches the apex. The three types of triangles are symmetrical triangle, ascending triangle or descending triangle. Their classification depends on the slope of their trendlines, with ascending triangles having a flat upper trendline while descending triangles have a flat lower one.

Learn more: Triangle chart patterns
Diamond Patterns
The diamond chart pattern is a relatively rare but reliable reversal chart pattern, often confused for the head and shoulders pattern. It signals a shift in the trend, and when it occurs at the end of a bullish run, it is called a diamond top, and for the bearish trend, a diamond bottom.
In contrast to the straight neckline of the head and shoulders, the diamond pattern’s characteristics are simultaneous higher highs and lower lows, giving it a tilted, rectangular, diamond-like shape. When trading a diamond pattern, traders usually wait for the breakout, placing the stop-loss just behind the latest swing, high or low, and using the width of the pattern as a profit target.

Diamond pattern illustration, Source: Benzinga
Learn more: Diamond pattern
Bull and Bear Flag
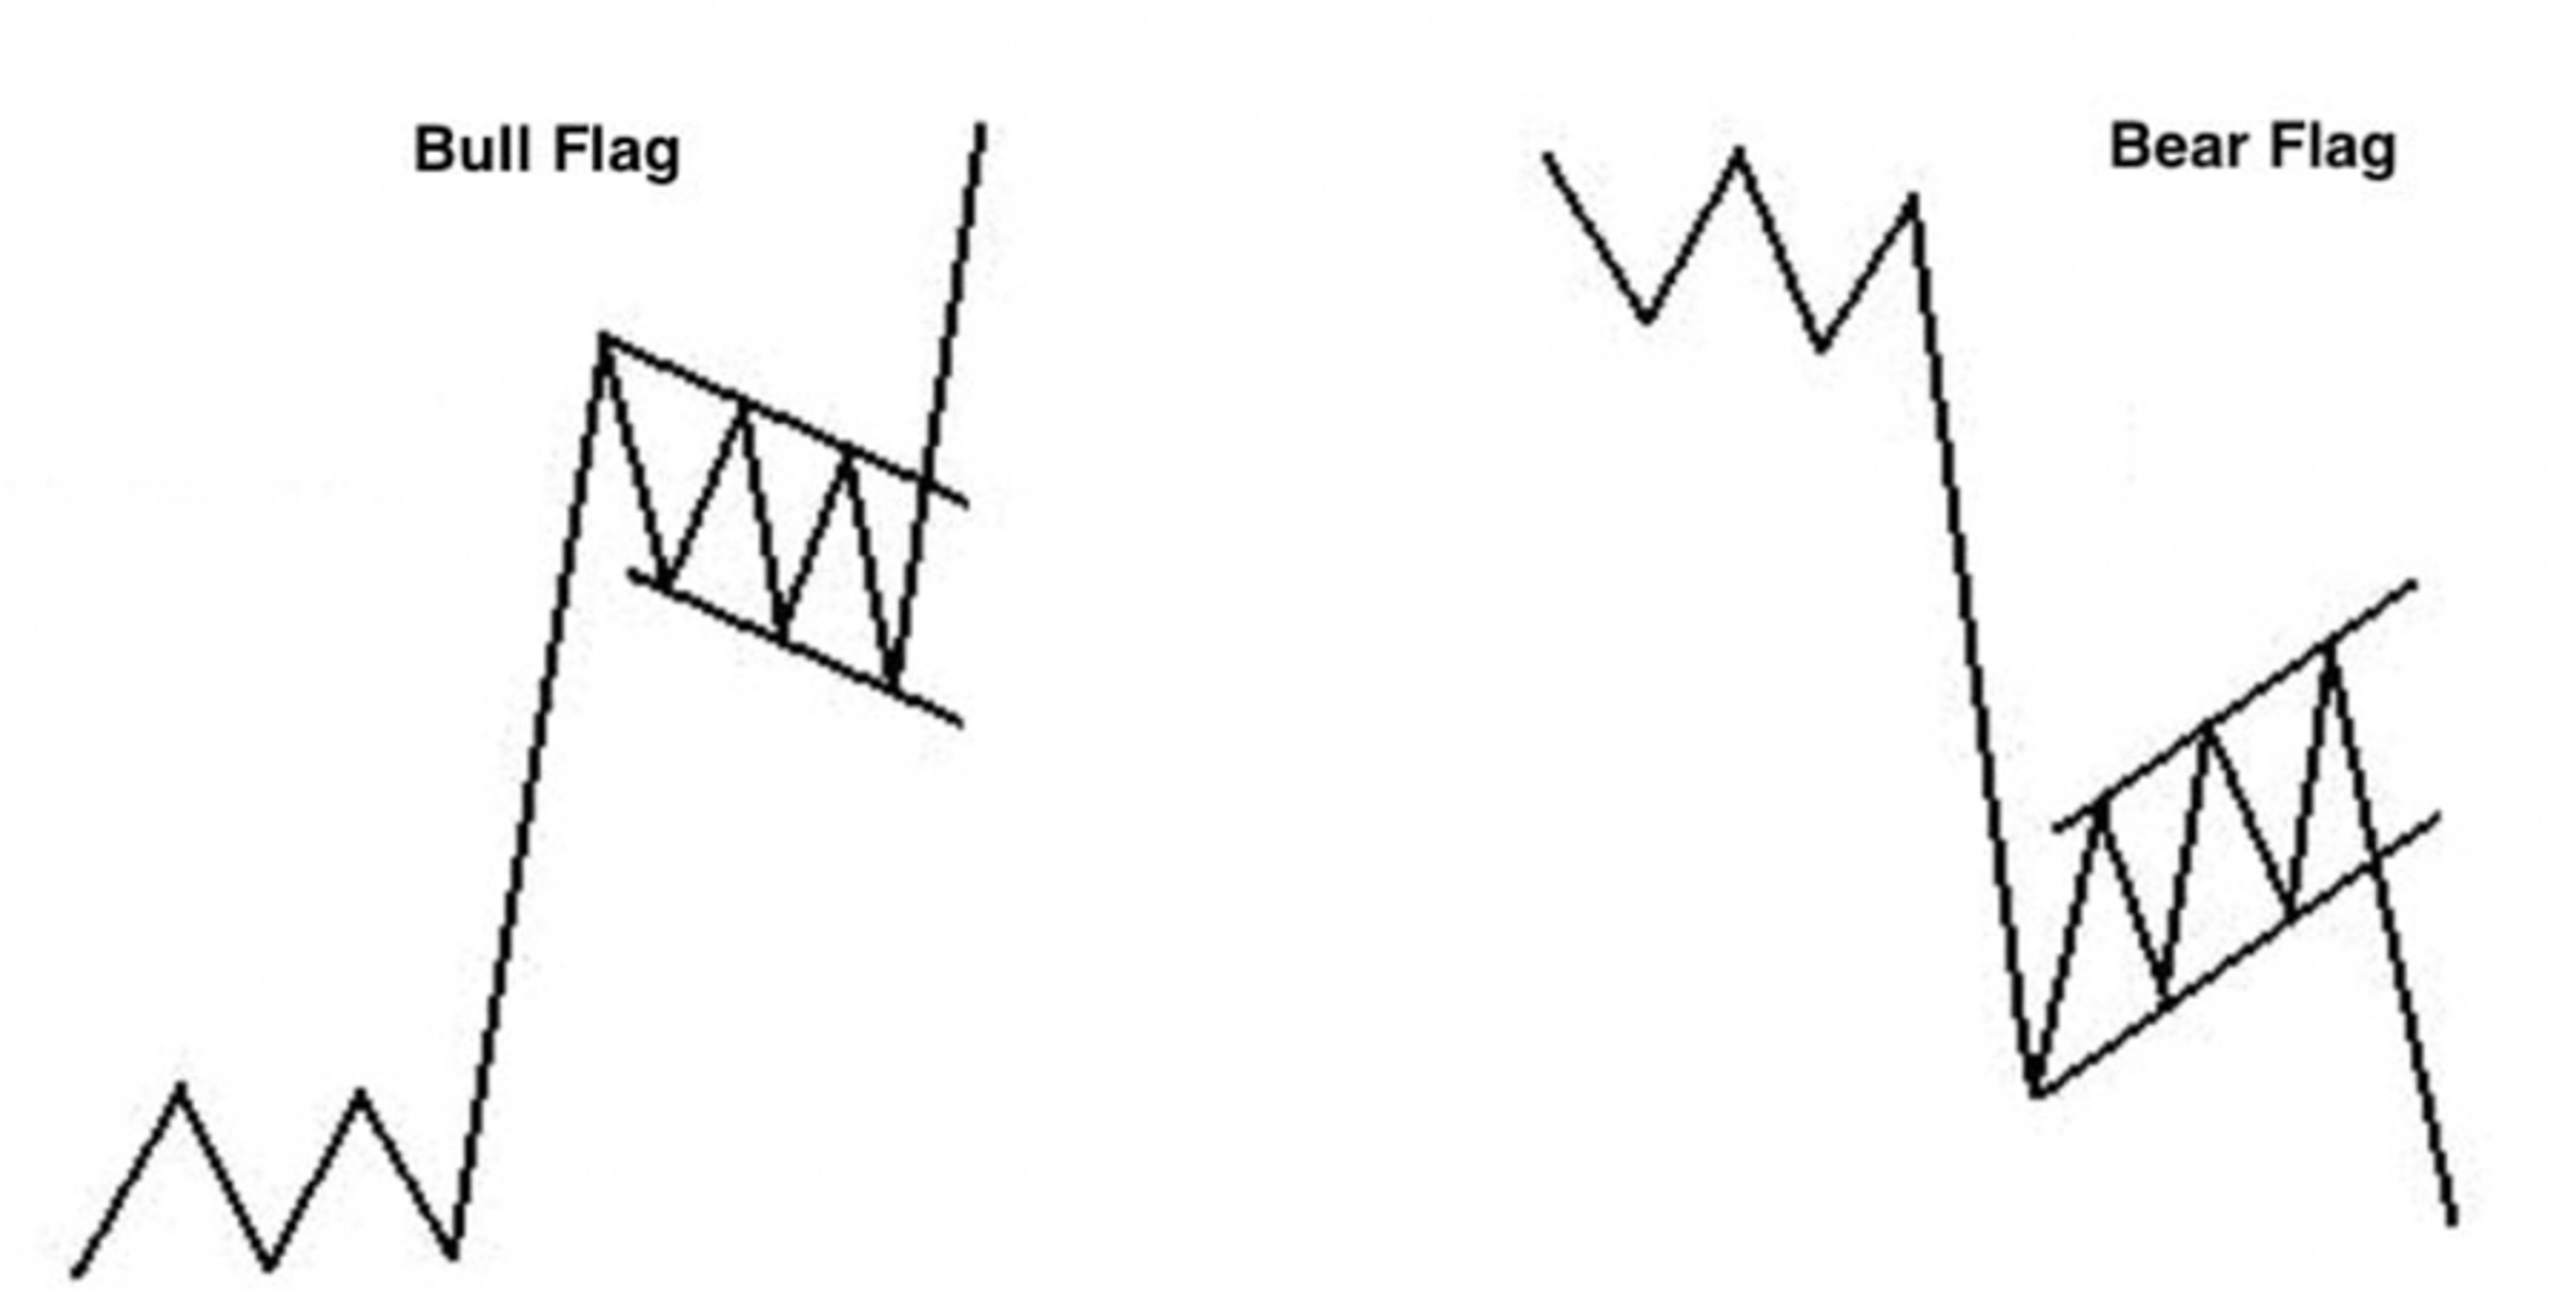
Flags are some of the most popular forex chart patterns since they’re relatively easy to spot. They are continuation chart patterns that form after a decisive move in one direction, often after a news release.
That strong price movement creates the so-called pole of the flag. Eventually, it reaches an exhaustion point. Short-term traders start taking some profits, forming the body of the flag — a tilted rectangular shape. If the price breaks out of the pattern in the direction of the prevailing trend, traders take a new position using the height of the pole as a measuring distance for the new move.

Learn more: Bullish flag pattern or bearish flag pattern
Rectangular
A rectangular chart pattern is a continuation pattern that signals that the prevailing trend might resume after a brief period of consolidation. A rectangle chart pattern shows indecision between buyers and sellers for a while, during which the price oscillates from support to resistance — forming a rectangular box.

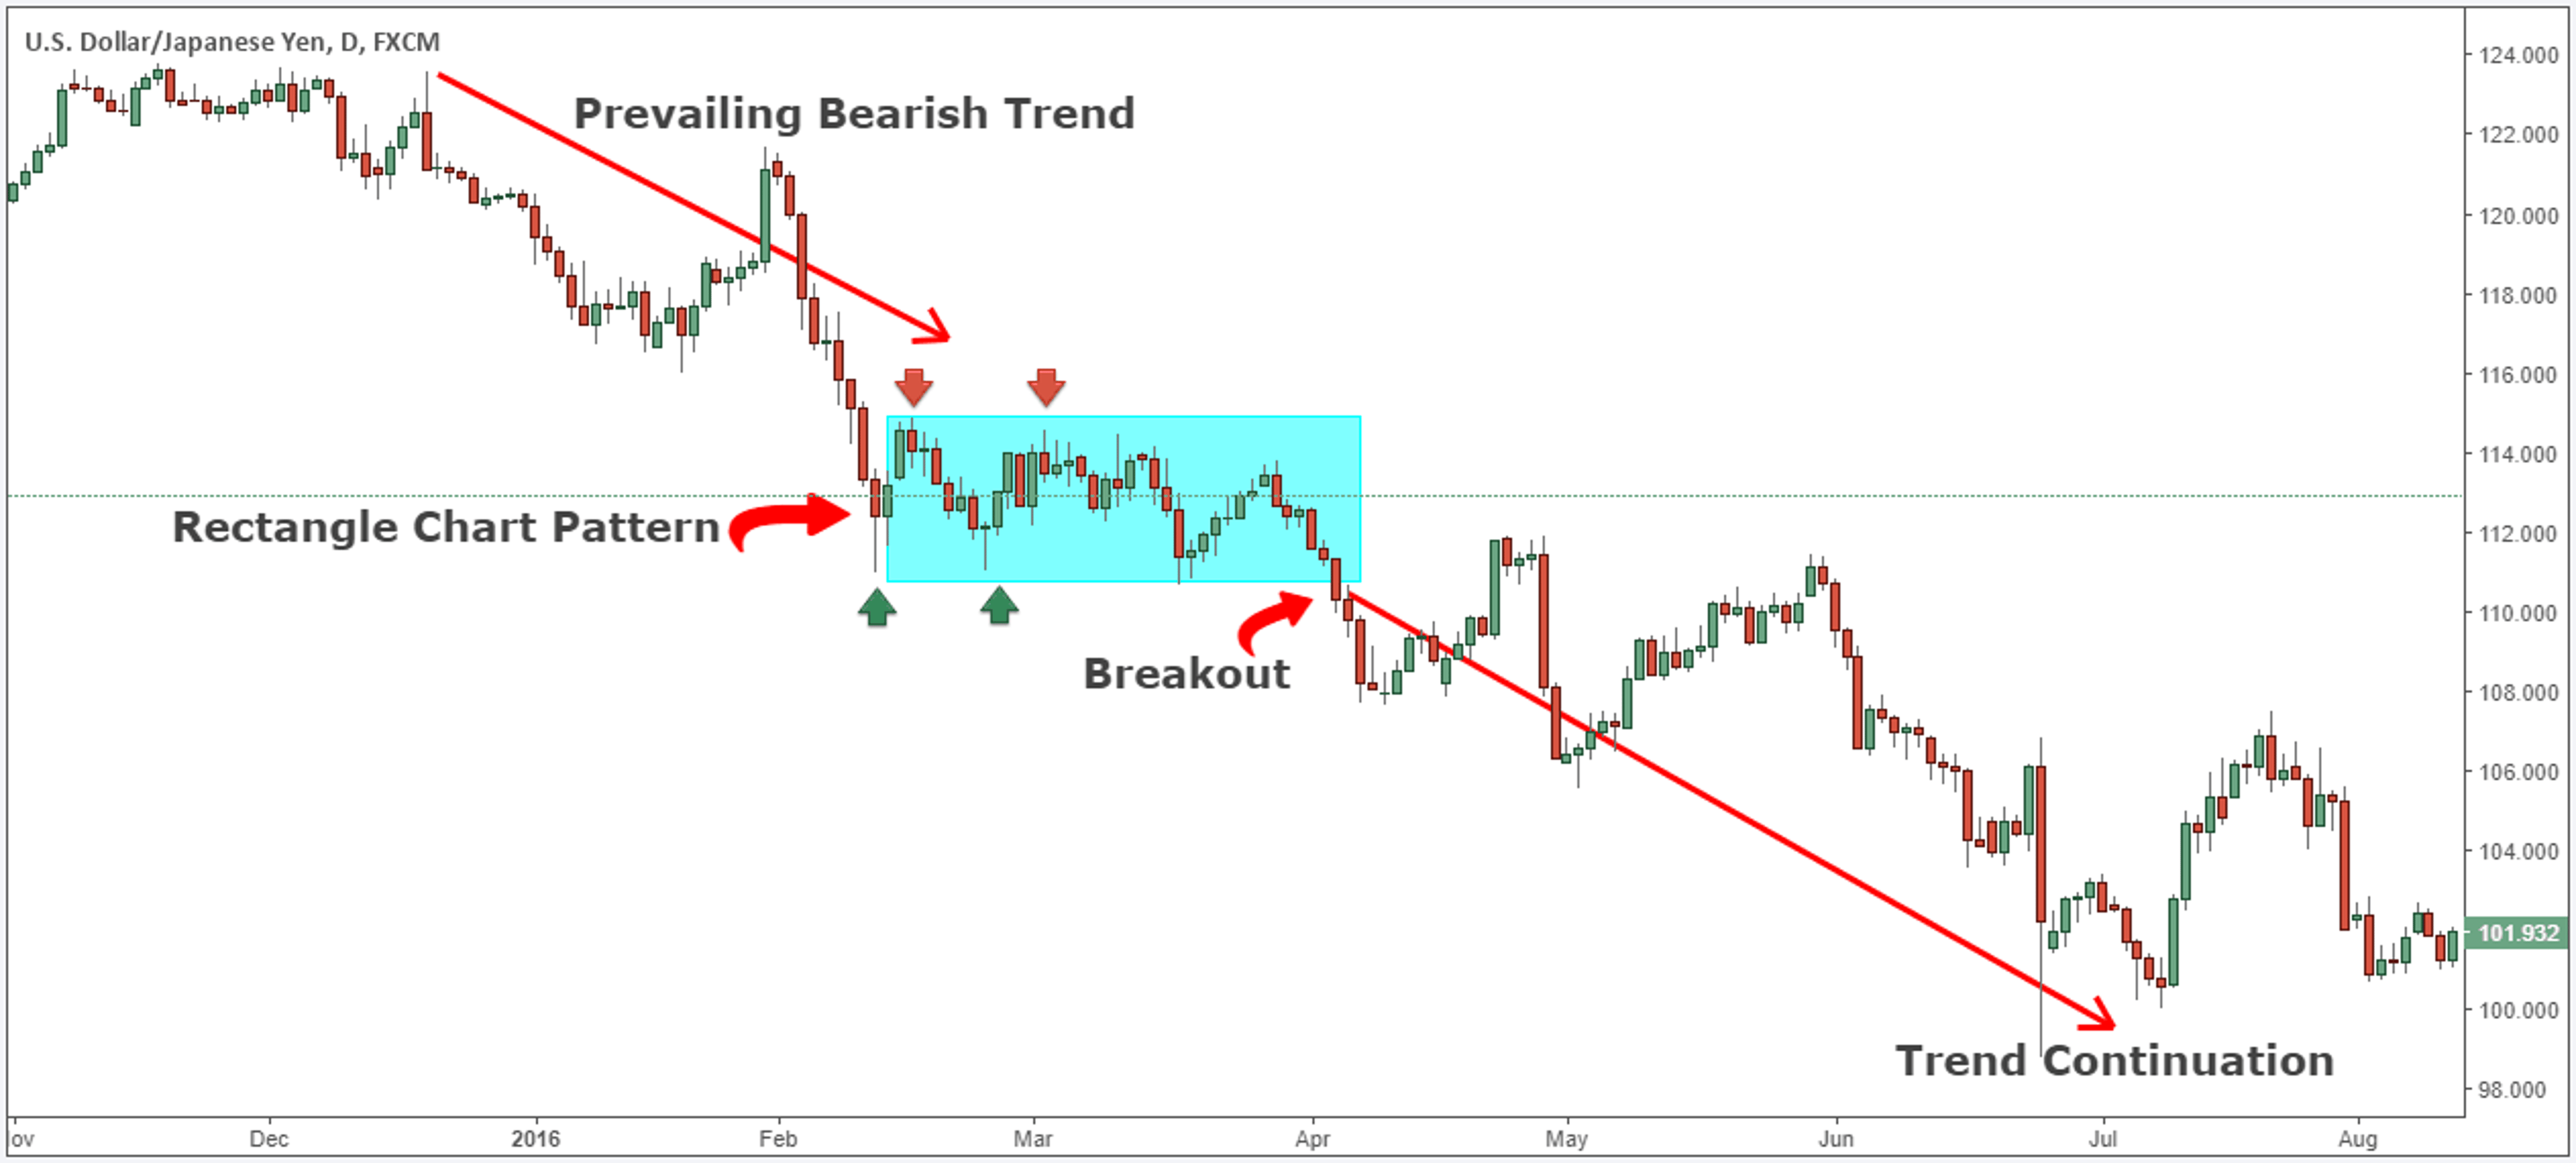
Traders wait for these support and resistance levels to break and buy the resistance breakout in the bullish trend or sell the support breakout in the bearish one.
Featured Offerings
- Best For:Overall Trading ExperienceVIEW PROS & CONS:securely through Forex.com's website
- Best For:Professional TradersVIEW PROS & CONS:Securely through Interactive Brokers’ website


Trade Chart Patterns With More Success
Between numerous indicators, expert advisors, signals and other services, the cacophony on the forex market can be overwhelming. In that environment, forex chart patterns and other candlestick chart patterns are akin to classical music — an overlooked point of origin that spawned many other styles.
Thus, for traders and analysts who want to have an evergreen tool to rely on, using these chart patterns will help in any market condition.
Frequently Asked Questions
What is the most successful trading pattern?
Head and shoulders is the most reliable chart pattern, reaching its projected target almost 85% of the time. It is a reversal pattern, meaning it signals the potential turnaround of the market. Inverted head and shoulders, which signals a bullish reversal, is slightly more successful than its bearish counterpart.
Do forex patterns work?
Forex patterns work reliably enough to create trading opportunities. However, their identification is somewhat subjective. Two traders might have a slightly different interpretation of the same setup, thus making their results different.
How many forex trading patterns are there?
There are many trading patterns, but they fall within three categories — reversal, continuation and bilateral. Reversal patterns indicate a shift, while continuation patterns indicate a further move in the direction of the prevailing trend. Bilateral patterns can go either way and require more attention.