
H1 2020 Highlights
- More than 4 million options contracts traded daily in the first half of 2020
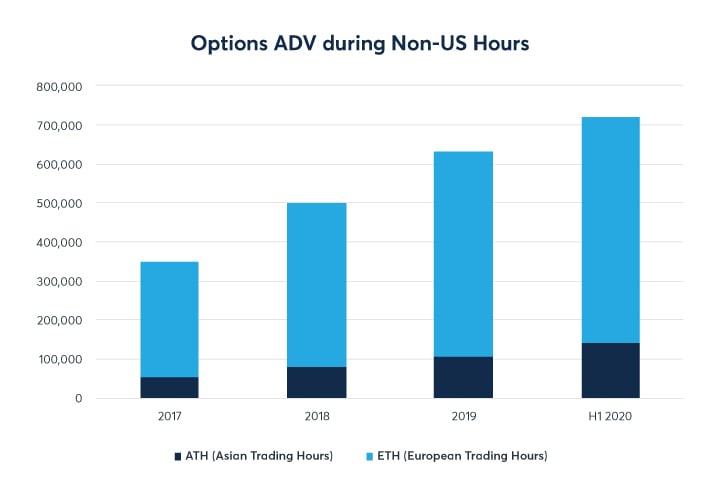
- Options liquidity continues to deepen during overnight hours. In H1, options volume during Asian Trading Hours rose 42% YoY, while volumes during European Trading Hours rose 9% YoY.
- Unprecedented volatility drove numerous trading record in Q1 (Read our Q1 report)
H1 2020 By Asset Class
|
ASSET CLASS |
H1 ADV |
ADV YOY |
% GLOBEX |
OPEN INTEREST |
|---|---|---|---|---|
|
Total Options |
4,114,606 |
-4% |
77% |
56,548,905 |
|
Interest Rates |
2,633,714 |
-13% |
70% |
42,021,203 |
|
Equity Index |
823,018 |
+33% |
97% |
3,225,466 |
|
Energy |
311,838 |
+29% |
63% |
6,399,165 |
|
Agricultural |
216,795 |
-27% |
94% |
2,915,089 |
|
Metals |
81,798 |
+17% |
79% |
1,342,812 |
|
FX |
47,444 |
-14% |
99% |
645,170 |
Open interest as of June 30, 2020
H1 2020 Most Actively Traded Options
|
PRODUCT |
PRODUCT GROUP |
PRIMARY SYMBOL |
H1 ADV |
% YOY |
GLOBEX % |
OPEN INTEREST |
|---|---|---|---|---|---|---|
|
Eurodollars |
Interest Rates |
GE |
1,679,621 |
-15% |
60% |
38,015,162 |
|
E-mini S&P 500 |
Equity Index |
ES |
781,776 |
37% |
100% |
2,982,597 |
|
10-Year Note |
Interest Rates |
OZN |
623,541 |
-3% |
87% |
2,220,660 |
|
5-Year Note |
Interest Rates |
OZF |
187,954 |
-18% |
88% |
1,099,707 |
|
WTI Crude Oil |
Energy |
LO |
172,871 |
12% |
72% |
3,312,390 |
|
Natural Gas |
Energy |
LN |
131,646 |
69% |
53% |
2,760,984 |
|
T-Bond |
Interest Rates |
OZB |
127,359 |
-5% |
90% |
541,485 |
|
Corn |
Agriculture |
OZC |
81,392 |
-45% |
94% |
1,179,170 |
|
Gold |
Metals |
OG |
69,556 |
17% |
78% |
1,218,634 |
|
Soybeans |
Agriculture |
OZS |
48,408 |
-20% |
95% |
578,744 |
|
Chicago SRW Wheat |
Agriculture |
OZW |
30,986 |
-13% |
94% |
266,838 |
|
Standard S&P 500 |
Equity Index |
SP |
22,204 |
-33% |
1% |
134,638 |
|
EUR/USD |
FX |
EUU |
21,158 |
-19% |
99% |
276,500 |
|
E-mini NASDAQ-100 |
Equity Index |
NQ |
15,760 |
58% |
100% |
78,811 |
|
2-Year Note |
Interest Rates |
OZT |
14,912 |
-39% |
85% |
143,626 |
|
Lean Hogs |
Agriculture |
HE |
14,711 |
-18% |
98% |
199,965 |
|
Live Cattle |
Agriculture |
LE |
12,429 |
24% |
96% |
190,972 |
|
JPY/USD |
FX |
JPU |
10,557 |
3% |
98% |
120,356 |
|
Soybean Meal |
Agriculture |
OZM |
9,788 |
23% |
92% |
127,214 |
|
Silver |
Metals |
SO |
9,466 |
42% |
90% |
102,088 |
|
Soybean Oil |
Agriculture |
OZL |
8,579 |
58% |
86% |
85,922 |
|
AUD/USD |
FX |
ADU |
5,479 |
9% |
99% |
66,057 |
|
GBP/USD |
FX |
GPU |
5,467 |
-36% |
98% |
101,247 |
|
KC HRW Wheat |
Agriculture |
OKE |
4,642 |
0% |
93% |
46,337 |
|
Brent Crude Oil |
Energy |
BZO |
4,576 |
-40% |
19% |
151,355 |
|
CAD/USD |
FX |
CAU |
4,430 |
-14% |
100% |
73,509 |
|
E-mini Russell 2000 options |
Equity Index |
RTO |
2,976 |
47% |
100% |
24,320 |
|
Class III Milk |
Agriculture |
DC |
2,555 |
41% |
99% |
106,648 |
|
Copper |
Metals |
HX |
2,466 |
-18% |
64% |
12,621 |
Data as of June 30, 2020 and reflects all expires in a given product (10-Year note data includes Quarterly/Serial and Friday and Wednesday Weeklies)
H1 2020 News And Highlights
- Rates
- Eurodollar options remained the most actively traded options product, averaging nearly 1.7M contracts/day in H1
- Treasury options averaged over 953K contracts/day in H1
- Use of Committed Cross in Eurodollar options has grown significantly. On July 27, CME Group will implement enhancements to committed cross for Interest rate options, including an enhanced Better Price and Volume match and an increase in the BPVM percentage to 45% from 35% (View SER for details)
- Options on 1-Month and 3-Month SOFR futures launched and have seen active quoting and 800+ contracts traded.
- Equities
- Sustained volatility in equity markets drove a 33% rise in Equity options trading volumes in H1
- E-mini S&P 500 options volumes rose 37% YoY and were the second most actively traded product
- E-mini Nasdaq-100 options +33% YoY, E-mini Russell 2000 options +47% YoY
- Bitcoin options continue to see growing volumes
- Energy
- A record 20% of WTI options (LO) volume has traded outside of US hours in 2020, up from 16% in 2019
- Natural Gas financial options (LN) volume is up 70% YTD with an ADV of 117,000
- WTI Calendar Spread Options volume is up 15% YTD with an ADV of 16,000
- Nat Gas Calendar Spread Options volume is up 167% YTD with an ADV of over 7,000
- A record 55% of total Energy options on-screen volume has traded as an RFQ strategy YTD, up from the 2019 record of 52%
- Agriculture
- The Dairy complex has experienced unprecedented volatility and price action recently, with open interest hitting record highs. Block Cheese options were launched on January 13, adding a seventh option product to the complex and have quickly built up close to 4,000 contracts of OI. Class III Milk options hit multiple volume records throughout June, the largest occurring on June 26 with 16,341 contracts changing hands.
- June implied volatility for Soybeans and Soybean meal are at historical lows, looking back to 2007. This also marks the second time implied volatility of Soybean Oil is higher than Soybeans and Soybean Meal.
- August Lean Hogs is at a historical high implied volatility due to ongoing African Swine Flu (ASF) and Covid-19 concerns.
- Metals
- Gold options volumes rose 14% YoY, led by deepening liquidity in weekly Gold options which saw a 47% jump in trading activity
- Silver options volume jumped 39% YoY
- FX
- Since launched in February, Monday weekly FX options have traded over 86K contracts. Monthly ADV reached a new high of 1,500 contracts/day in June, with open interest hitting 18.6K contracts on June 12.
- NEW ‘Big Ticket’ discounts: Trading FX Options at CME Group has never been more capital-efficient with a new 50% fee reduction on all large trades (250 contracts for G6) however executed – Globex, Block or Pit. View the details
- Read: FX options – A capital-efficient, Low-cost proxy for OTC options
Featured Tools From QuikStrike
MOST POPULAR: QuikStrike Essentials: The base version of QuikStrike’s flagship pricing and analysis platform offers an all-in-one tool for analyzing volatility, volume/open interest, delta sheets, pricing, spreads, risk graphs and more.
GROWING USAGE: QuikVol® tool: Chart and analyze historical volatility data including, implied and actual volatility, skew, constant maturity, and implied volatility cones. Like what you see? The QuikVol® datasets featured in this tool are available (via subscription or ad hoc download) dating back to 2007 through CME DataMine
NEW IN 2020: Contract Directory and Calendar Tool (NEW in 2020): Ready to trade options on futures, but need a roadmap to understand key product details and nuances? This tool can help. Browse a calendar view of all options expirations within a given product and view the contract details you need in order to trade with confidence – expiration date/time, exercise style, tick size, strike price increments, underlying futures information, resources, and more.
2019’s FASTEST GROWING: Options Calculator: Generate fair value prices and Greeks for any of CME Group’s options on futures contracts or price up a generic option with our universal calculator.
POWERFUL but UNDER UTILIZED: This Week in Options: Track intraday and weekly rolling contract statistics (such as volatility, risk reversal prices, open interest, put/call ratios, and more), and compare them to the prior week.
FAN FAVORITE: Strategy Simulator: Analyze how a position will perform based on hypothetical price scenarios, compare custom strategies and apply “what-if” scenarios based on time decay or volatility
© 2025 Benzinga.com. Benzinga does not provide investment advice. All rights reserved.