Significant differences exist between real estate investment trusts (REITs) and other types of stocks, so the valuation metrics and the methods used to analyze a REIT are different as well.
When analyzing a REIT, consider the strength of the company’s real estate portfolio, the health of the overall business and the people who manage it.
This guide will walk you through the steps to do all of this and help you pick winning REIT investments for your portfolio.This guide will focus on equity REITs. Analyzing mortgage REITs takes a separate set of metrics.
Information Needed to Analyze a REIT
Gather some information before you can begin analyzing a REIT. Most of this can be found in the investor relations section of the company’s website or by searching company filings through the U.S. Securities and Exchange Commission (SEC) database.
Some of the key pieces of information to examine can be found by looking at:
- 10-K (annual report filed with the SEC)
- 10-Q (quarterly report filed with the SEC)
- Quarterly supplemental report
- Investor presentation
- Real estate portfolio details
- Press releases
Locating this information before you start analyzing a REIT can make the process a lot simpler and less time-consuming.
Look at the Company’s Real Estate Portfolio
When you’re investing in a REIT, you are investing in a portfolio of income-producing real estate. The first step when analyzing a REIT should be to look at the properties the company owns and the tenants that lease these properties. Most REITs provide information on the real estate portfolio and who its top tenants are in the company’s investor presentation.
Tenants
Look at the REIT’s top tenants to make sure they don’t include companies that are having major financial problems and may have trouble paying rent in the near future.
Lease Terms
Depending on the type of properties a REIT invests in, the length of the leases can vary from month to month for self-storage REITs, yearly for apartment REITs or 10+ years for REITs that own commercial properties.
For REITs that typically have long-term leases, you’ll want to look at the weighted average lease term (WALT) and their lease expiration schedule. This process will help give you an understanding of how stable the company’s rental income will be over the next several years.
Rent Collection
Rent collection isn’t an issue most of the time, but it became one for several REITs during 2020 and continues to be through 2023 with rent extensions. Some REITs are still struggling to collect rent from some of their major tenants, which could result in long-term problems with the revenue.
Acquisitions and Dispositions
It’s also important to understand if a REIT’s portfolio is growing or shrinking. You can look through the company’s recent news to see if there have been property purchases or sales announced. Don’t assume that any acquisitions are good or any dispositions are bad. A REIT is often able to increase its profits by selling an underperforming asset, so look at what was bought or sold and why.
Valuation Metrics
The REIT may look like a solid investment once you’ve examined its real estate portfolio, but you want to make sure you won’t be overpaying for the REIT stock. The share price of a REIT tends to move toward its value, so an overpriced REIT has a higher risk of falling in price. Likewise, REITs that are priced at a discount are more likely to increase in price.
You can use several valuation metrics to compare the value of the REIT to its current stock price.
Funds From Operations (FFO)
A REIT’s reported net income rarely provides a clear picture of how much money it actually made and how much money you can expect it to make during the next quarter or the year.
One of the main reasons for this is the depreciation expense. Depreciation reduces a company’s taxable income, even though it’s not an actual cash expense. It’s also a significant write-off in many cases, so its impact on the reported net income can be substantial.
Another thing that can affect the net income is the capital gains or losses from the sale of property. While these gains and losses are real, they’re not indicative of how much cash flow you can expect the REIT to generate in the future.
To provide a clear picture of the true earnings, REIT investors use a metric called funds from operation (FFO). FFO adds depreciation and amortization expenses back to the net income and removes gains or losses from the sale of real estate.
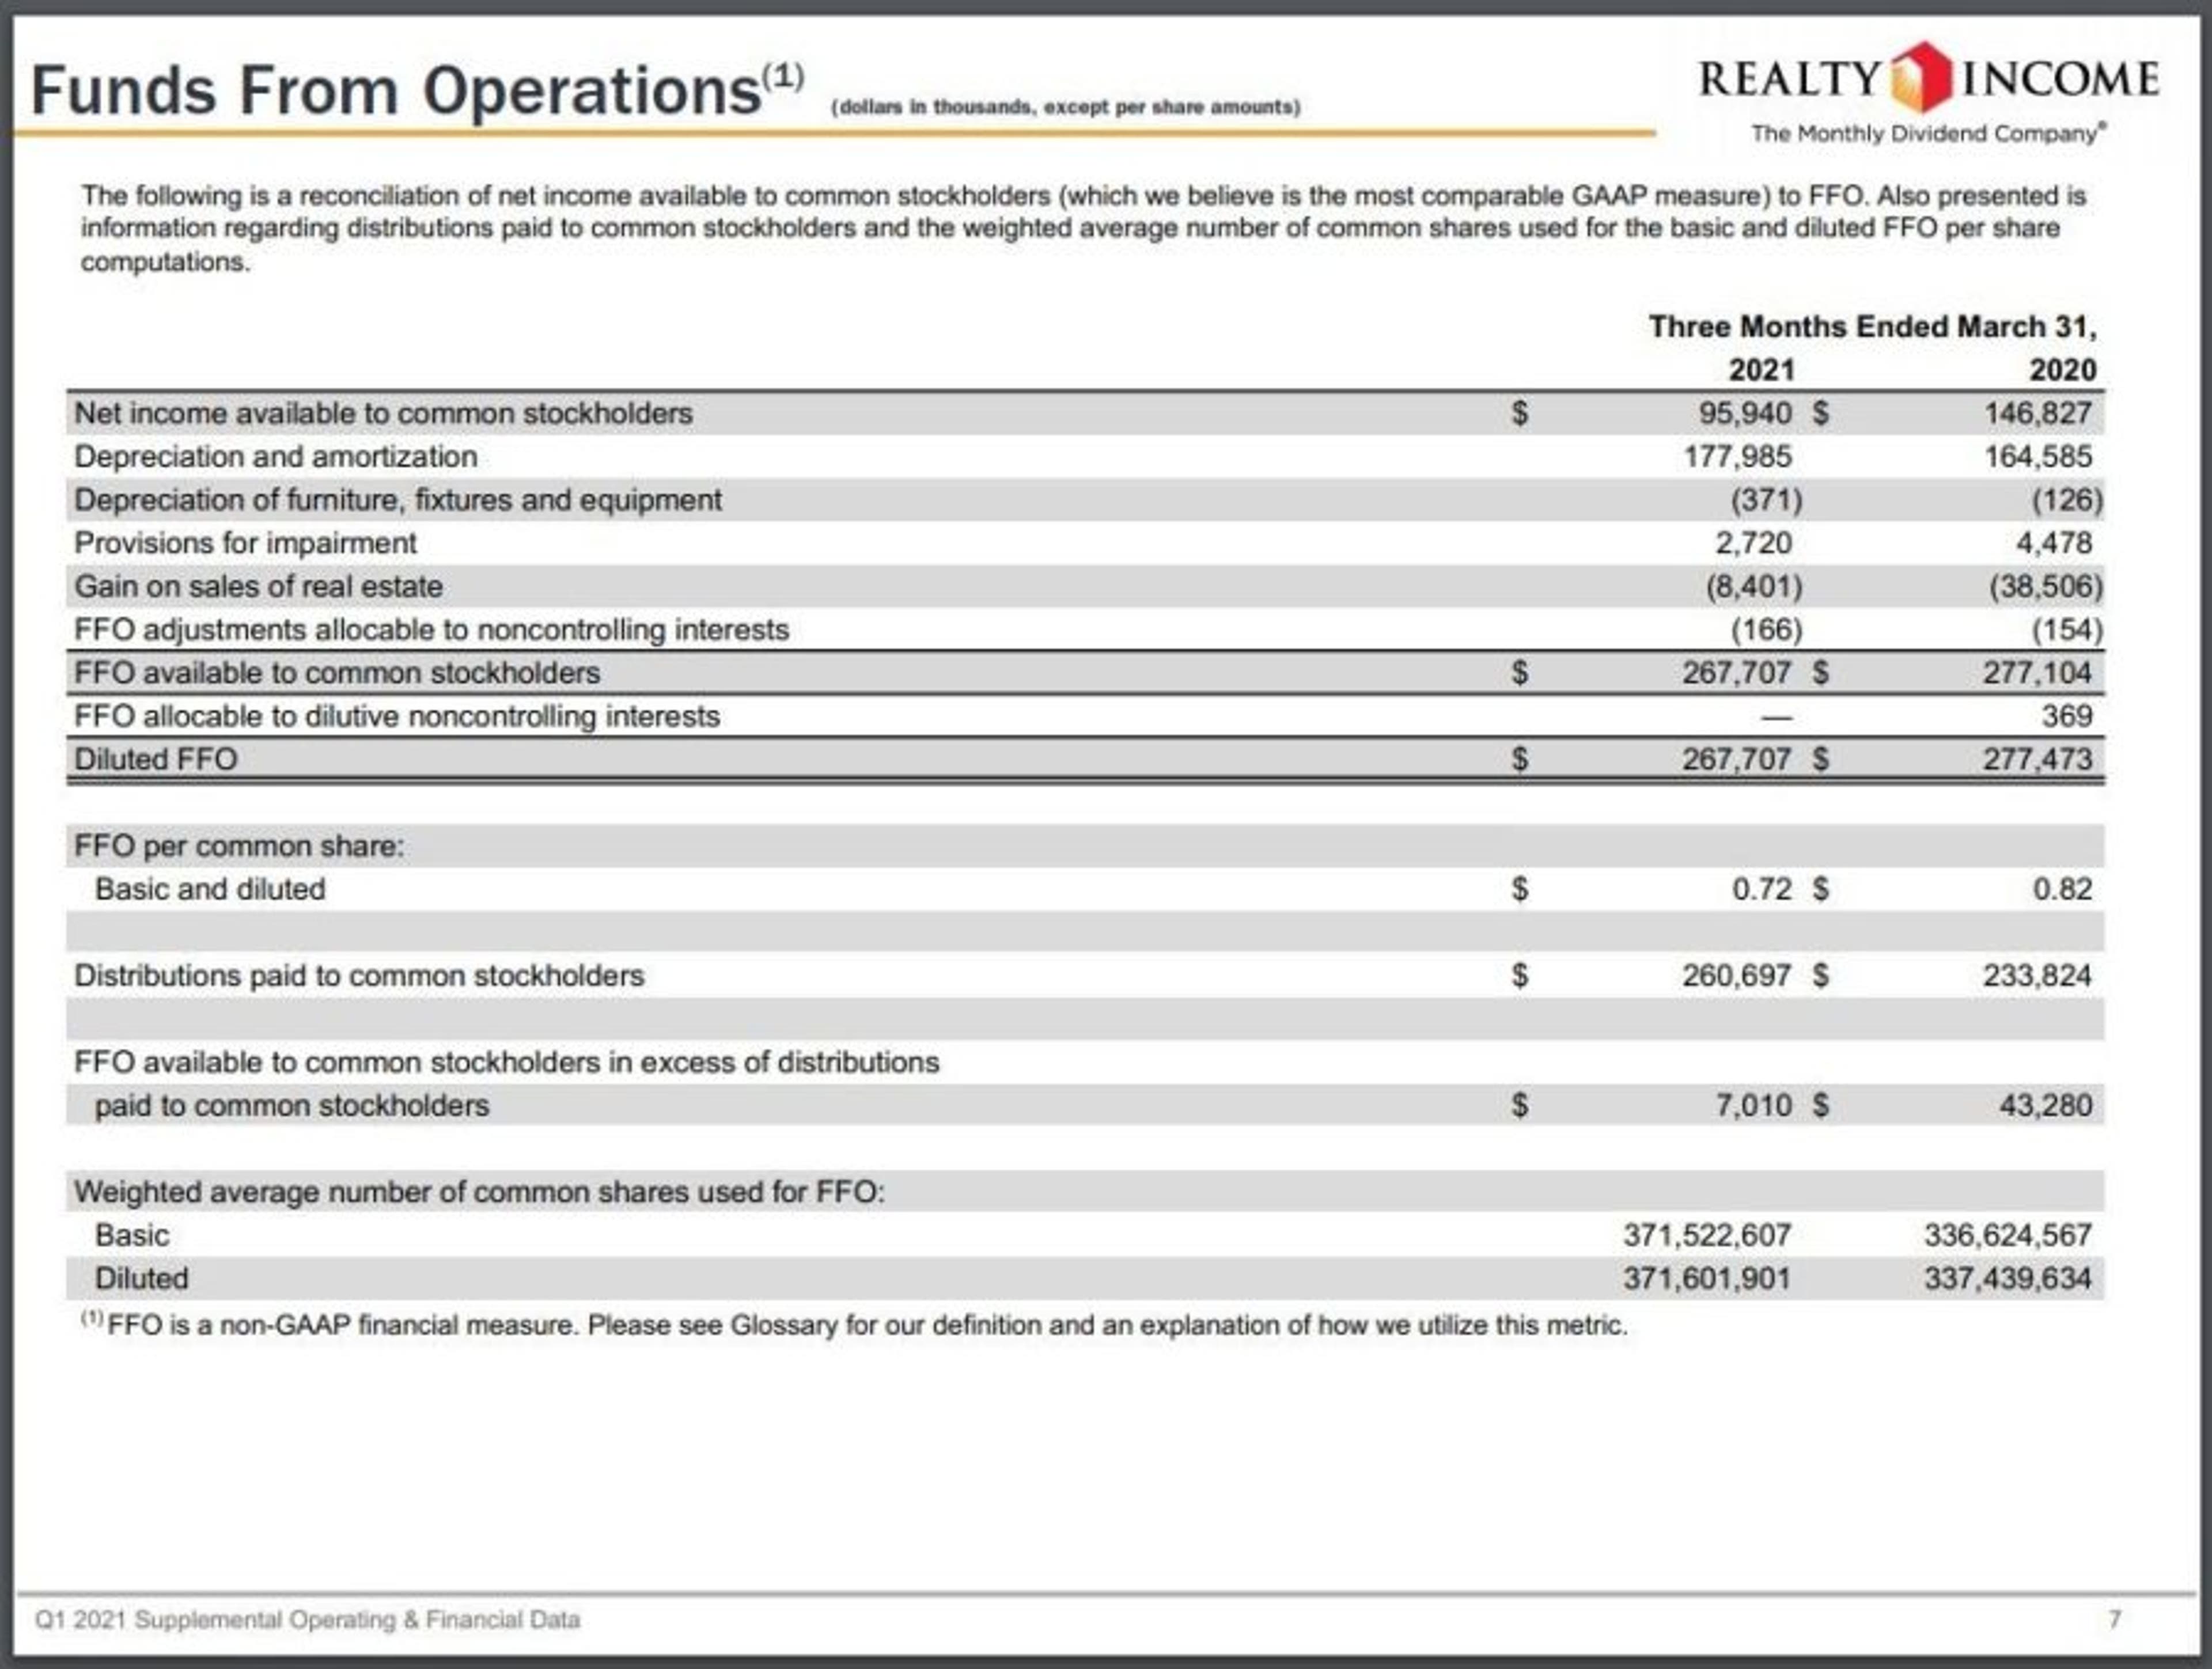
Let’s look at an example from Realty Income’s 2021 quarterly supplemental report.

Source: Company website
The company had a net income of $95,940,000 but had an FFO of $267,707,000 after making the adjustments.
Net income + depreciation and amortization - gains or losses on sales of real estate = FFO
This also shows the company’s FFO per common share, which is 72 cents per share. You can also calculate this yourself by dividing the FFO by the number of outstanding shares.
FFO / shares outstanding = FFO per share
Price to FFO
Once you have the REIT’s FFO per share, you can calculate its price to FFO multiple. This is a valuation metric used to compare the value of a REIT to its peers.
You need the FFO per share for a full 12 months. You can either:
- Annualize it with the most recent quarter
- Add the FFO per share for the past 4 quarters
- Use the most recent annual report to get the FFO per share for the full year
Once you have an annual FFO per share, you simply divide the current share price by the FFO per share to get the price to FFO multiple. You’ll then do the same thing for the REIT’s peers and calculate an average price to FFO multiple.
Share price / FFO per share = price to FFO multiple
The average multiple you come up with will be the value based on price to FFO multiple. You can use this value to see if the REIT you’re analyzing is priced at a discount or a premium to its peers.
Adjusted Funds From Operations (AFFO)
Adjusted funds from operations, often called adjusted FFO or AFFO, provides further adjustments to a REIT’s FFO and is considered an even more accurate measure of a company’s performance. However, it’s important to note that each company calculates AFFO a little differently.
Since the AFFO calculation is different between REITs, it’s not common to compare the price to AFFO of one REIT to another. Instead, REIT investors will often use this figure to analyze the performance of a REIT over time and look for growth or decline in AFFO and AFFO per share.
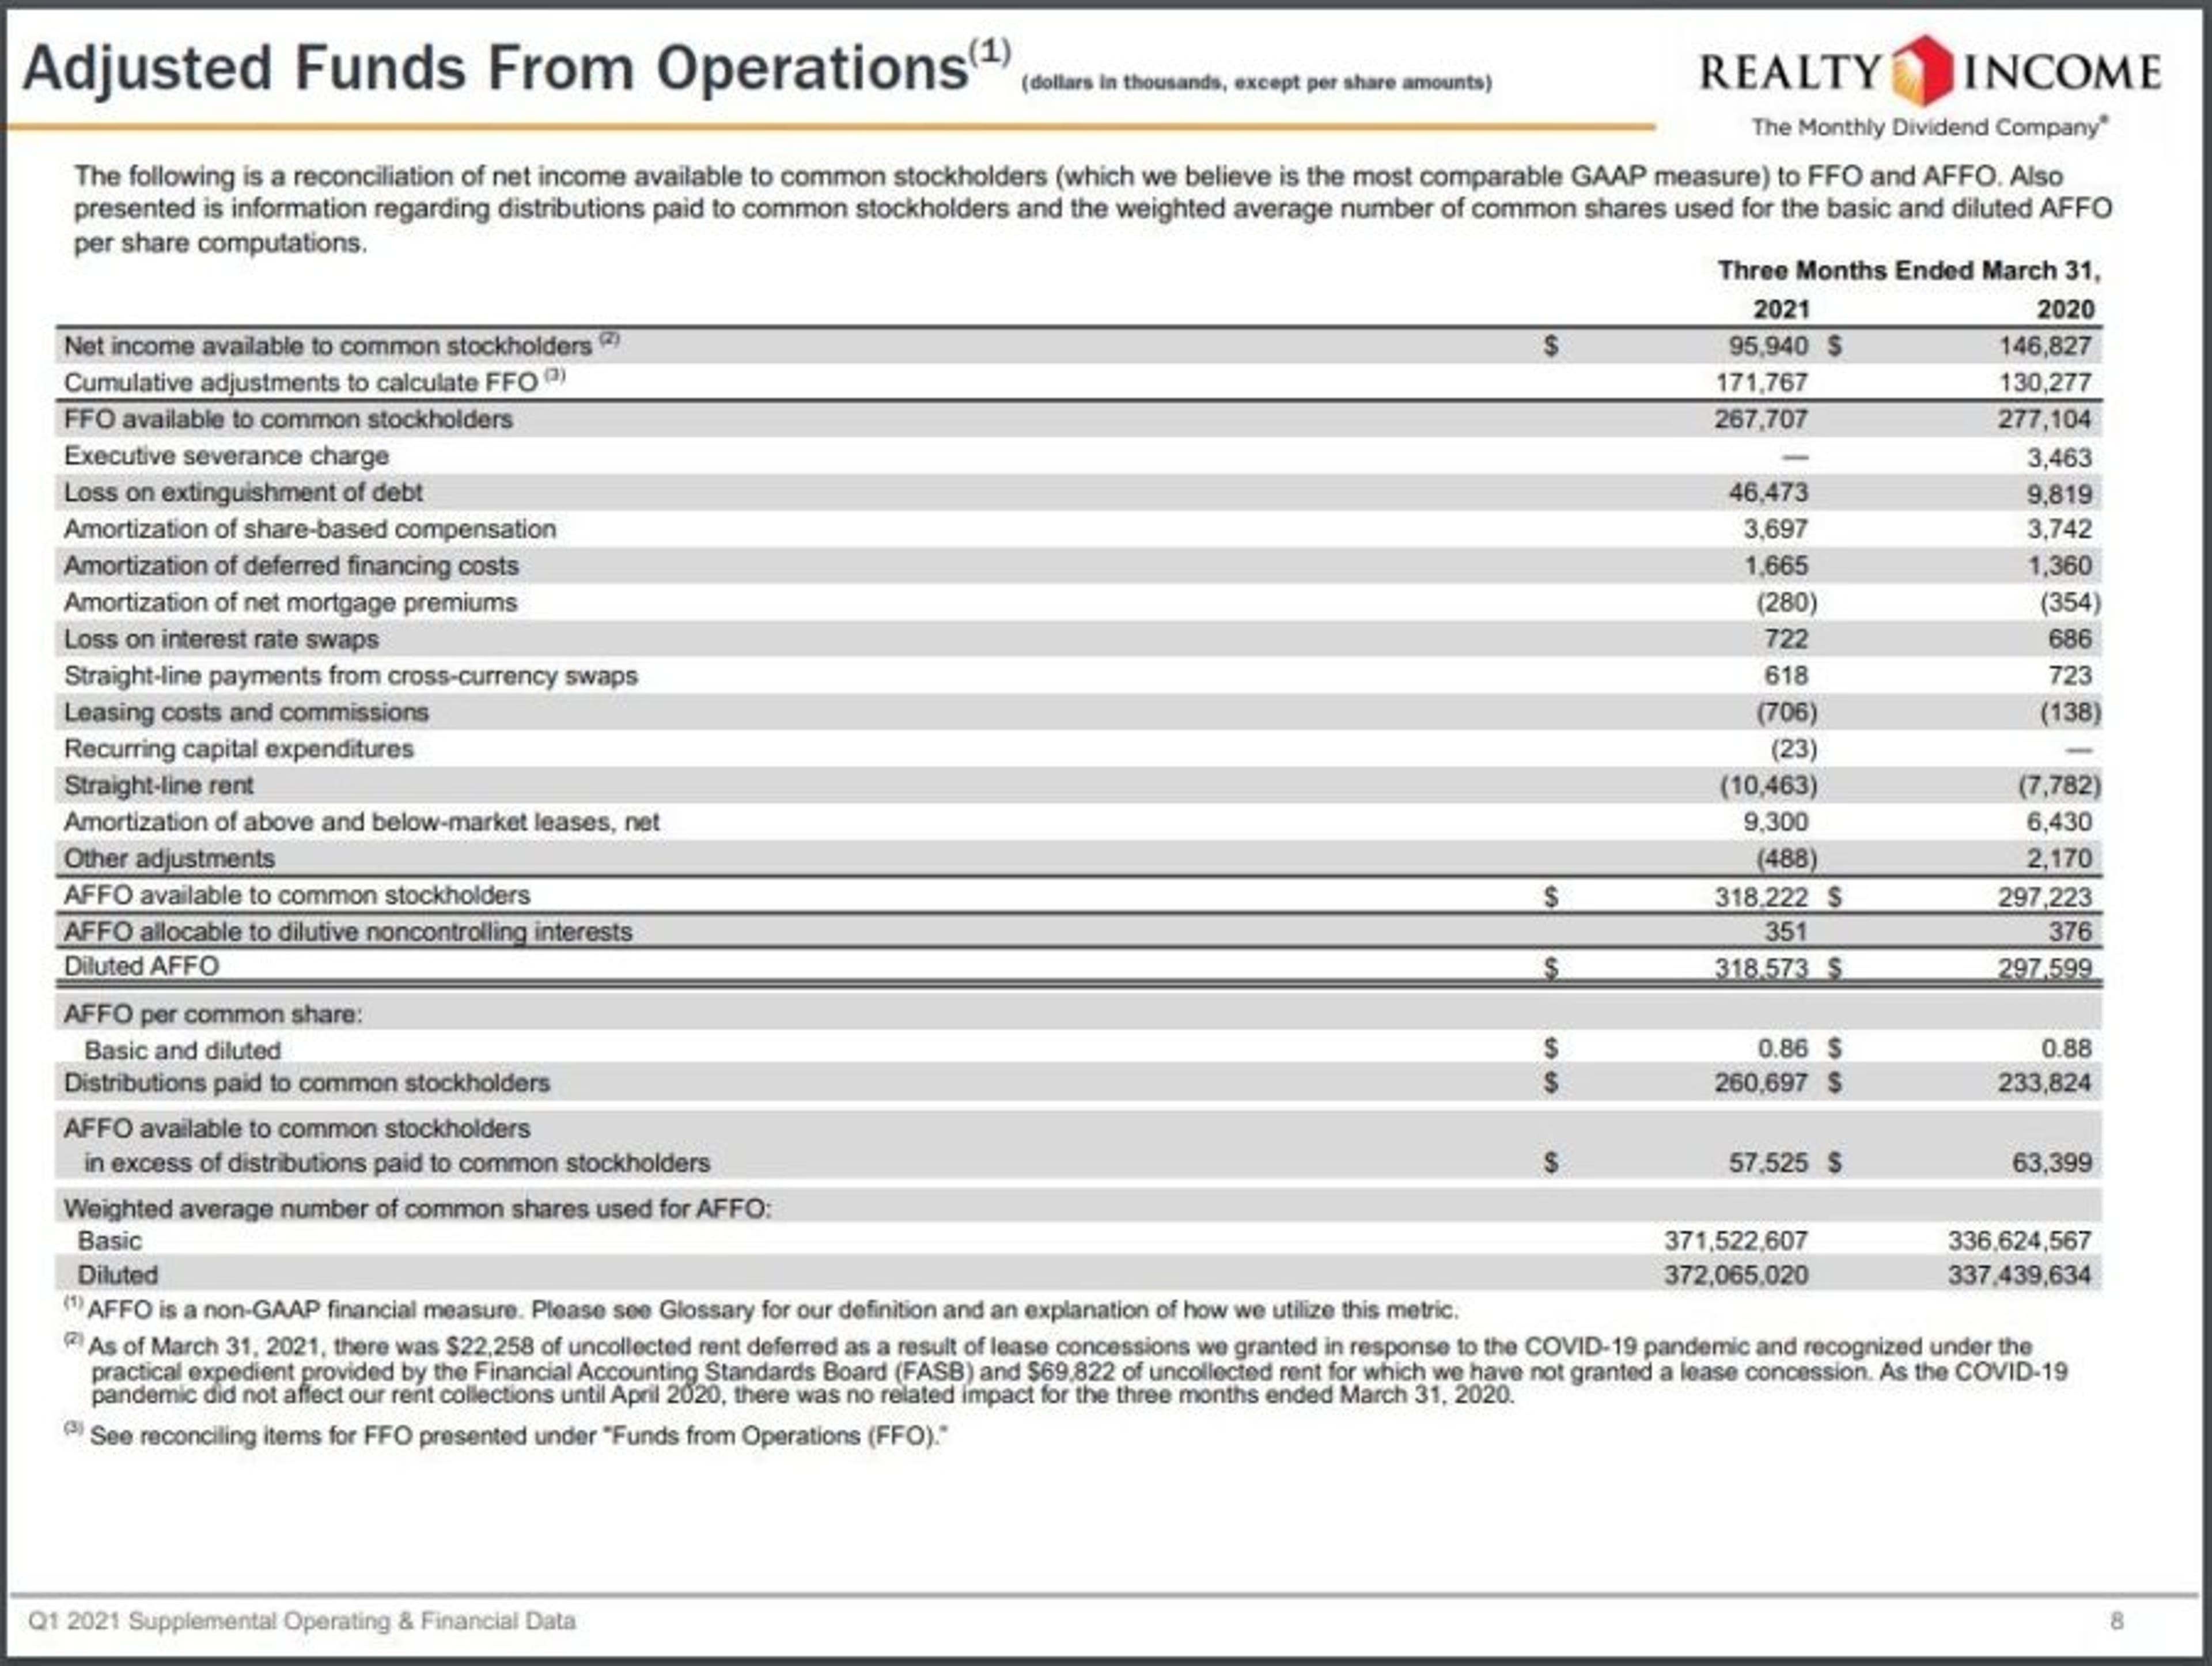
You can see an example of how Realty Income calculates AFFO from their Q1 2021 quarterly supplemental report.

Source: Company website
As you can see, the company has an AFFO per share of 82 cents compared to an FFO per share of 72 cents.
You can also compare the REIT's price to AFFO multiple over time to identify the right buying opportunity. If a REIT is suddenly priced at a lower price to AFFO multiple than it normally trades at, it may be a signal that it's a good time to buy.
Net Asset Value (NAV)
The net asset value, or NAV, for a REIT calculates the fair market value of the company’s assets and subtracts liabilities. This is similar to the book value of other companies, but just like net income, book value isn’t an accurate metric for REIT valuation.
The idea behind NAV is that the value of a REIT should be based on the current market value of its assets, so its shares on the stock market should be priced accordingly. If you were purchasing a real estate portfolio yourself you probably wouldn't want to overpay for it, so you shouldn't overpay when buying shares in a REIT either.
Finding the property values
For one, a REIT’s real estate assets are depreciated on their balance sheet. Even if you were to add back the accumulated depreciation, the fair market value of the REIT’s properties have likely changed since they were first acquired or developed.
Since the value of a commercial property is based on the income it generates, you’ll have to calculate the net operating income (NOI) of the REIT’s real estate portfolio. Some companies provide this information in their quarterly supplemental reports. If the NOI isn’t provided, you can calculate this yourself by subtracting the company’s property expenses from the rental revenue. This information can be found on the company's recent annual income statement.
Rental revenue - property expenses = NOI
You’ll also need to determine a market cap rate for the REIT’s properties. You can sometimes find this in a company’s 10-K filing or supplemental report. If not, some commercial real estate brokerages publish cap rate data for each property type and region.
Once you have a market cap rate, you’ll divide this by the REIT’s NOI to calculate the fair market value of the real estate.
Cap rate / NOI = estimated property value
Calculating NAV
You’ll then have to add the value of other tangible assets to the value of the properties. This includes cash and land held for development. These items can be found on the company’s balance sheet. Since land doesn’t depreciate or generate income, the value listed on the balance sheet for land held for development should be accurate.
Real estate value + cash + other tangible assets = total asset value
The last step to calculating the NAV of a REIT is to subtract the company’s liabilities from the total asset value. The liabilities can also be found on the balance sheet.
Total asset value - liabilities = NAV
To use the NAV as a valuation metric, you’ll first calculate the NAV per share. Simply divide the NAV by the number of shares outstanding.
NAV / shares outstanding = NAV per share
Finally, you can compare the current share price to the NAV per share to see if the REIT’s stock is trading at a discount or a premium to its NAV.
Notes on net asset value
This explanation of calculating the net asset value of a REIT is a simplified version that will give you a rough estimate of NAV. Other factors that should be considered when calculating NAV are the expected capital expenditure expenses, adjustments to straight-line rent and properties that the REIT plans to sell during the current year.
Dividend Discount Model (DDM)
The dividend discount model uses the theory that the value of a REIT today is equivalent to its future dividend payments discounted to present value. This method is useful for larger REITs with consistent dividend growth over a long period of time.
There are different variations of the dividend discount model, but the most commonly used one for REITs is the Gordon growth model. To calculate the value of a REIT based on this model you’ll need to:
- Determine the expected dividend rate for the next year (d)
- Estimate the dividend growth rate (g)
- Know your required rate of return (r)
You will then divide the dividend rate for the next year by the required rate of return minus the projected growth rate.
d / (r-g) = value
To help you better understand this model we’ll look at Omega Healthcare Investors (NYSE: OHI) as an example.
This REIT’s expected annual dividend payment for next year is $2.72, and it’s dividend growth rate over the past 5 years is 4.9%. This particular REIT comes with some added risk, so we’ll use a required ROI of 9%.
| Annual Dividend Rate | $2.72 |
| Dividend Growth Rate | 4.9% |
| Required ROI | 8% |
| Value | $66.34 |
Based on this valuation metric, Omega Healthcare Investors’ stock is worth $66.34. With its price of $36.65 on July 1, 2021, it would appear Omega is priced at a discount.
You can either use your own required rate of return to determine what the particular REIT is worth to you, or you can research data to determine the market’s current required rate of return.
Discounted Cash Flow
The discounted cash flow model determines the present value of a REIT’s future free cash flow using a discount rate.
For example, if you were to invest $100 at a 10% rate of return the investment would be worth $110 in one year. Similarly, if somebody owes you $100 and waits one year to pay you, the present value of that $100 is only $90 since you’re unable to invest it.
This model requires you to make assumptions based on the future cash flow of the REIT over a selected time period and the appropriate discount rate.
There are several variables that go into using the discounted cash flow model, so stay tuned for a future guide to talk you through the steps.
You can sign up for our REIT newsletter to find out when the guide is available as well as updates on all of our favorite REIT investments.
Dividends
Dividends are one of the things that make REIT stocks so attractive to many investors. For June 2021, the average dividend yield for the S&P 500 was 1.31% compared to 3.1% for the FTSE Nareit All REITs index. Several REITs, however, have dividend yields well above 5%.
A REIT’s current dividend yield alone won’t give you an accurate picture of what you can expect to receive from future payouts, though. You’ll want to look at the company’s dividend history and its payout ratio.
Dividend History
One important thing to look at is the history of the REIT’s dividend payouts over the past several years. Ideally, there would be consistent increases each year meaning future increases are more likely. Buying a REIT that has a 5% dividend yield at today’s share price could result in a yield of 8% in 10 years if the company increases its dividend 5% per year.
Payout Ratio
The payout ratio for a REIT is based on its FFO per share. This looks at how much of the company’s FFO is being paid to shareholders in dividends.
A high payout ratio could mean the dividend is at risk of being cut. Even if the REIT doesn’t cut dividends, it’s probably less likely that they will be increasing them.
A lower payout ratio means the REIT’s dividend payments are well covered and the company is keeping more capital that it can use to grow. It also means there’s room for dividend increases.
To calculate the FFO payout ratio, divide the most recent quarterly dividend by the most recent quarterly FFO per share. Some REITs pay dividends monthly, so you’ll have to multiply the most recent dividend payment by 3x.
Dividend rate / FFO per share = FFO payout ratio
You’ll also want to do this calculation for previous quarters going back at least a couple of years. This will help you understand if the current dividend growth rate is sustainable based on if the payout ratio is increasing or not.
The ratio you’re looking for depends on your personal investment objective. If you’re primarily investing for dividend income you’ll likely be more comfortable with a higher payout ratio. On the other hand, if you’re looking for growth you’ll want to look for a more conservative payout.
Payout ratios higher than 90% typically point to higher risk. However, you may notice that the company has maintained a similar payout ratio for several years while still increasing dividends. If that’s the case, you’ll want to make sure that they haven’t also been taking on more debt to cover the dividends and other expenses.
As a general rule of thumb, the ideal payout ratio will be below 80% with anything below 70% being considered more conservative.
Debt
It’s necessary for a REIT to have debt in order to fund and grow its operations. This is especially true since they’re required to pay out at least 90% of their taxable income as dividends, limiting the amount of cash they can retain to fund acquisitions.
Other than being a necessary tool to grow, debt allows companies to earn a higher return than by purchasing everything with cash. This is especially true with real estate since the cash-on-cash return on an investment is almost always significantly higher than the cap rate.
However, too much debt can create problems for a REIT. As debt increases, so does the amount of the loan payments. If a company’s debt service gets too high it can become difficult to cover all of its expenses, pay dividends or purchase more properties.
Debt to EBITDA Ratio
One of the simplest and most effective ways to analyze a REIT’s debt is to look at its debt to EBITDA ratio. EBITDA stands for earnings before interest, taxes, depreciation and amortization.
The common way to calculate this debt ratio is to use the company’s net debt, which is total debt minus available cash. You also need to annualize the EBITDA. The net debt to EBITDA formula looks like this:
Net debt / EBITDA = net debt to EBITDA ratio
A higher ratio means higher leverage and more risk. A good rule of thumb is to look for a ratio between 4x and 6x.
A ratio above 6x could indicate that the REIT is carrying too much debt. A ratio below 4x could indicate that the REIT is too conservative with debt and is spending more of its own cash than it needs to.
Debt Maturity Schedule
Besides the debt to EBITDA ratio, you’ll also want to look at the REIT’s debt maturity schedule. This will tell how much debt is maturing each year over the next several years.
The ideal scenario is a well-staggered debt maturity schedule, meaning the amount that must be paid off each year is consistent. Having a large portion of the total debt due within the next couple of years could mean a higher chance of the company issuing more shares, which will dilute any shares you buy, or that they won’t be able to increase dividends. If the debt that’s due is high enough, it could even mean the dividends are at risk of being cut.
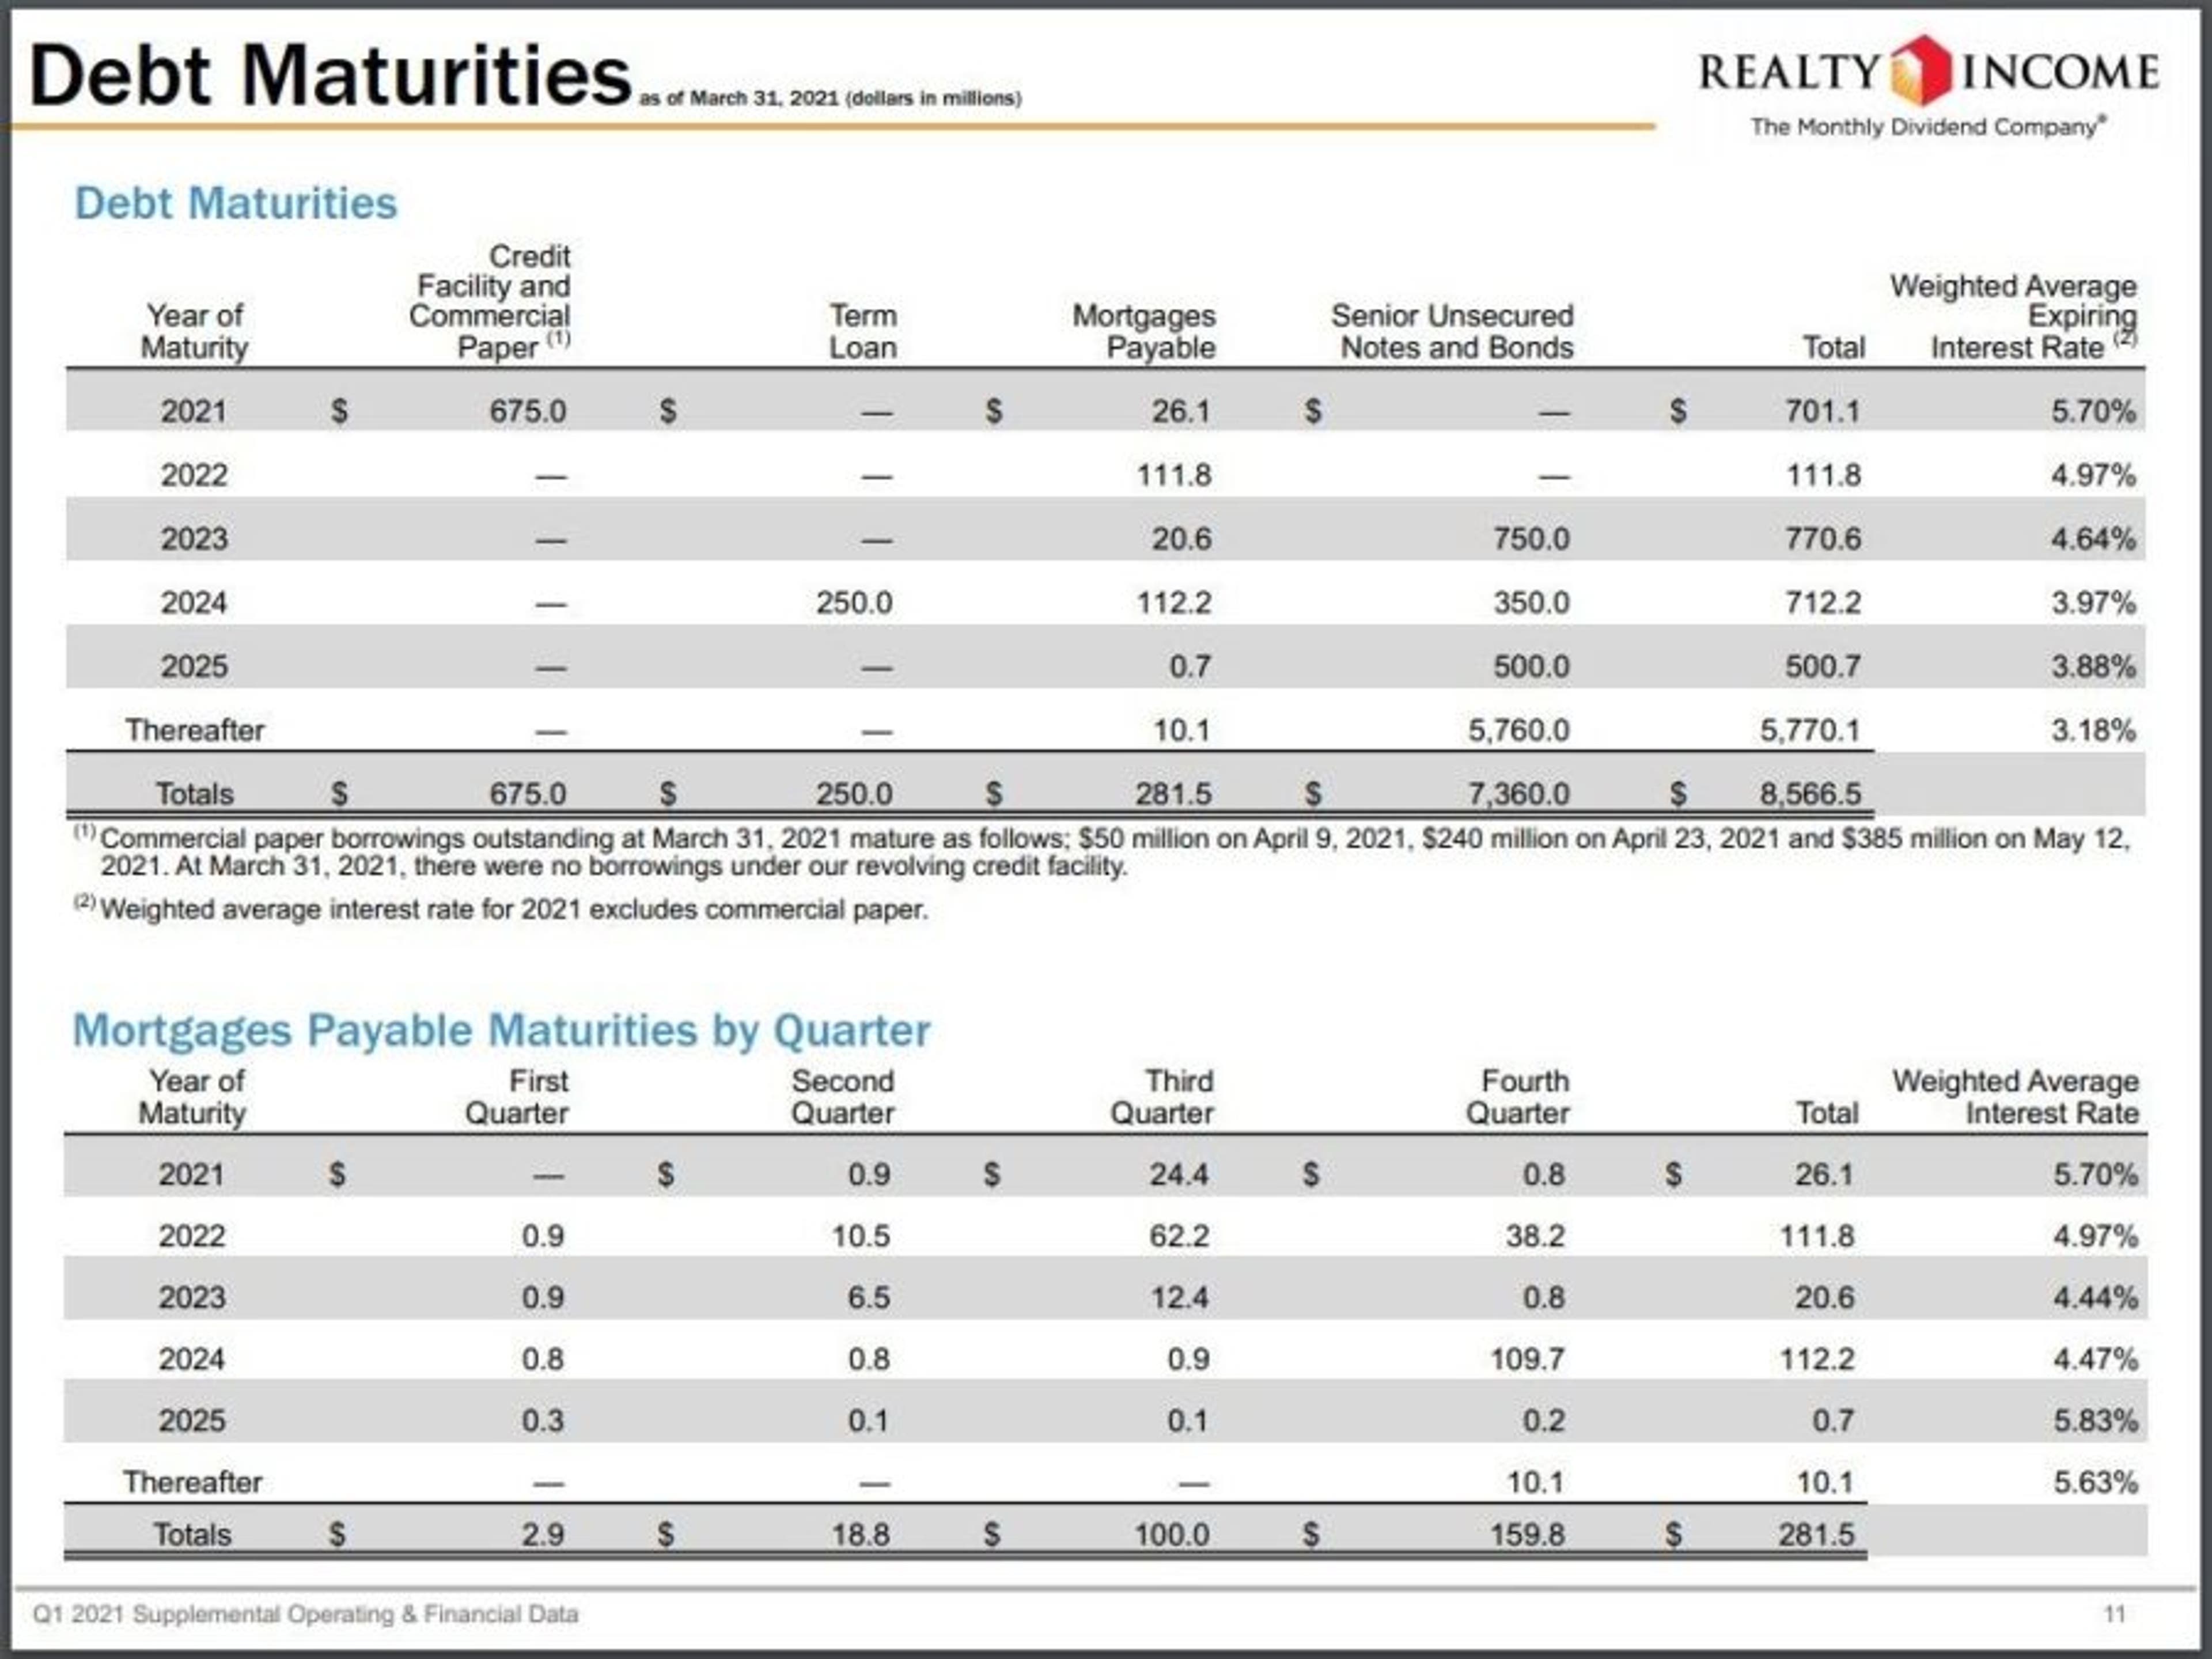
When you look at Realty Income’s debt maturity schedule, you can see that it’s fairly well-staggered over the next few years with breaks between larger maturities.

Source: Company website
Interest Rate
Another piece to consider when looking at a REIT’s debt profile is the cost of that debt. The company’s debt schedule will typically provide a weighted average interest rate for each type of loan.
This comes into play when analyzing the risk based on the REIT’s debt to EBITDA ratio and their debt maturity schedule. For instance, a large amount of debt maturing in the next year may actually be a good thing if it’s at a higher interest rate than what the REIT will be able to refinance it for.
You can also look at the company’s interest coverage ratio. This formula calculates the REIT’s interest expenses compared to its EBITDA. The formula looks like this:
EBITDA / interest expense = interest coverage ratio
Many REIT investors and analysts consider an interest coverage ratio of 3x to be the benchmark. The higher the ratio, the more capital the REIT has available to cover its interest expenses. Anything below 2.5x could indicate a high level of risk.
Management
A REIT’s management team is essential to the future success of the company. These are the people who decide how the REIT operates, how it manages its real estate portfolio and how it manages its debt.
You can analyze a REIT’s management by looking at how they’ve navigated different market conditions in their current role and how well they performed in previous roles.
You also want to pay close attention to recent changes in senior executive roles. For example, let’s say a REIT you’re looking at has been struggling with its debt over the past few years and the board just appointed a new chief financial officer (CFO).
After doing some research on the new CFO you see that they helped improve the credit rating of their previous company significantly. This could be a good sign that the REIT you’re analyzing could improve its balance sheet in the near future and see some upside to value.
You should also be cautious of REITs that are externally managed, meaning they hire a third-party to handle all of the asset management. While this isn’t necessarily a negative in all cases, you have to realize that a third-party will never be as invested in the success of the portfolio as a REIT’s internal management.
Another issue with external management can be conflicts of interest that arise since they likely manage assets for the REIT’s competitors as well.
Putting It All Together
At this point you likely have a lot of different information that doesn’t paint a clear picture on its own. You may also have conflicting data with one valuation metric saying the REIT is priced at a discount with another saying it’s overpriced.
For one, you have to consider how relevant each metric is for the particular REIT. For instance, a company might be priced high compared to its peers when looking at price to FFO, but that might be because one of its peers just had a major drop in price because of some problems specific to them. There also may be a REIT in the peer group with a significantly higher or lower multiple than the rest that’s throwing your calculation off.
Second, you’ll want to put all of the data together to weigh the positives with the risks. It’s rare to find a REIT that passes every test with flying colors. For example, the REIT may have a higher debt to EBITDA ratio than you would like to see, but also a high interest coverage ratio. The higher leverage may just be part of the company’s strategy and it’s managed that same level of debt for several years while growing in value.
Each metric is just one part of the total picture, so you have to look at them all together to understand how they all fit.
Use Your Instincts
When you’re researching how to analyze a REIT there is one thing that most experts forget to mention — use your instincts.
Perhaps all the numbers look great, but management’s projections on growth just don’t make sense to you. Or perhaps you don’t agree with what the experts think the demand is going to be for a particular property type over the next several years.
You shouldn’t have to talk yourself into making an investment. If it doesn’t feel good, it’s probably best to leave it alone and move on to the next one.
Take Your REIT Valuation Knowledge to the Next Level
Benzinga’s new REIT newsletter offers unique insight into the real estate investment industry and provides updates on our research team’s best REIT investment ideas. You’ll be the first to know when new guides are available to help you further your REIT investment knowledge.
Benzinga’s research team has identified several undervalued REITs with major upside and strong dividends.Get weekly updates on the REITs Benzinga is watching and take advantage of this major opportunity in the market right now.
Frequently Asked Questions
What qualifies as a REIT?
A REIT is a company that owns, operates or finances income-generating real estate. To qualify as a REIT, the company must meet certain criteria set by the IRS. These criteria include having at least 75% of its assets invested in real estate, deriving at least 75% of its gross income from real estate-related sources, distributing at least 90% of its taxable income to shareholders as dividends and being structured as a corporation, trust or association. By meeting these qualifications, a REIT can enjoy certain tax advantages and exemptions.
Why are REITs subject to depreciation?
REITs invest in income-generating properties that depreciate over time. Depreciation allows them to allocate funds for property maintenance and renovations, ensuring long-term sustainability and profitability. It also helps reduce their taxable income.
Why don't REITs tend to appreciate as fast as traditional stocks?
REITs have slower appreciation compared to stocks for several reasons. They are required by law to distribute earnings as dividends, limiting reinvestment for growth. REITs are closely tied to the real estate market, which has slower and more stable growth. Additionally, longer investment horizons and higher transaction costs make it difficult for REITs to generate rapid appreciation.