Fundamental analysis is a method used to evaluate the intrinsic value of a financial asset, such as a stock, bond, or currency. This analysis involves examining various economic, financial, and qualitative factors to determine whether an asset is undervalued, overvalued, or fairly valued.
Analysis helps you decide whether a stock is a good investment or something you should avoid. You can use two types of analysis known as technical analysis and fundamental analysis when reviewing a stock.
This article will give you expert guidance on how to conduct your own fundamental analysis. It will also provide an analysis of a major tech company as a concrete example.
Main Takeaways: Using Fundamental Analysis
- Technical analysis and fundamental analysis are the two main types of analysis used by stock traders. Fundamental analysis evaluates security to create a forecast for its future price.
- Fundamental analysis uses specific statistics for stocks. These include earnings per share (EPS), the price-to-earnings (P/E) ratio, beta and more. We explore what each of these is and the role they play below.
- Amazon is a great company to use for fundamental analysis. We provide an example below for this tech company.
How Does Fundamental Analysis Work?
Fundamental analysis is the process of evaluating a security to make forecasts about its future price. For a stock, fundamental analysis typically includes reviewing many elements related to stock prices, including:
- Performance of the overall industry the company participates in
- Domestic political conditions
- Relevant trade agreements and external politics
- The company's financial statements
- The company's press releases
- News releases related to the company and its business
- Competitor analysis
If some fundamental indicators of a company imply a negative impact, this is likely to eventually be reflected in its share price. On the other hand, if positive data is released, like a favorable earnings report, this can boost the price of the respective company.
Here are some examples of key company performance statistics that are commonly used to perform fundamental analysis on stocks:
- Earnings per share (EPS)
- Price-to-earnings (P/E) ratio
- Price-to-book (P/B) ratio
- Return on equity (ROE)
- Beta
Each of these key performance statistics gives information that is helpful to conduct a fundamental stock price analysis. You can then buy the stock on the assumption that the price will increase if your analysis suggests the price of the stock should rise from its present level.
Example of Fundamental Analysis
Although there's no standard way to do fundamental analysis, since stock trading is not as accurate as a math problem, you can follow certain guidelines. Also, the same information in one industry and stock may not mean the exact thing in another. A few of the most important statistics used in fundamental stock analysis are described in greater detail below.
EPS and Diluted EPS
Earnings per share relate to the portion of a company's profit allocated to each of the company's shares. The EPS is an indication of the firm's profitability. The higher the earnings per share, the healthier the company, so the better the stock should perform for an investor.
At the same time, if a stock's earnings per share are unusually high for its company's industry, this could mean one or more of the following things:
- Earnings are expected to decrease back to more normal levels.
- The price of the stock could increase to normalize the stock's EPS.
- An adverse condition exists for the company that has depressed its share price.
While EPS just takes into account the number of common shares issued by a company, many fundamental analysts prefer to look at diluted EPS that also includes convertible securities.
Price-to-Earnings Ratio
The price-to-earnings (P/E) ratio is used to evaluate companies and determine if they are under or overvalued. The ratio is computed by taking the share price of the company and dividing that by its earnings per share. The P/E ratio shows whether a share of stock pays well compared to its price.
For example, imagine that the price per share is $30 and the stock pays $2 earnings per share. The P/E ratio of the stock is computed as follows:
30 / 2 = 15
The lower the P/E ratio, the higher the earnings compared to the stock price, and the more attractive the stock. Furthermore, an unusually low P/E ratio could show extra potential for a future price rise.
If the P/E ratio is too low, below 10 for example, this means that the price per share seems low compared to the company's earnings especially if competing firms typically have higher P/E ratios. This might mean that the stock could be undervalued, so its price can increase significantly. The opposite holds true for high P/E ratios.
Price-to-Book Ratio
The price-to-book (P/B) ratio is a financial ratio that shows how much the stock is worth compared to the book value of the company. It is computed by taking the price per share and dividing that by the book value per share.
For example, if a company worth $10 million has 500,000 shares outstanding, it will have a book value per share of:
$10,000,000 / 500,000 shares = $20 book value per share
If its stock trades at $80 per share, then the P/B ratio is:
$80 / $20 = 4 P/B ratio
If the P/B ratio is more than 1, this means the market's consensus is that the stock will grow at a faster pace than its book value suggests, which is the reason why its price is higher than its book value. In some cases, you can see very high P/B ratios of 100 or more. High P/B ratios are often seen in high-growth stocks.
Return on Equity (ROE)
The return on equity is a measurement that determines how efficient a company is when using its shareholders' equity. You calculate the ROE by dividing the shareholders' equity by the company's net income. If a company has generated $5 million this year and its shareholder's equity is $50 million, this means the ROE is:
$5,000,000 / $50,000,000 = 0.1 or 10%
Note that analysts typically display the ROE result as a percentage. The higher the ROE, the more efficient the company is. If a company generates less than $5 million in income this year with the same shareholders' equity, this means it is less efficient:
$2,000,000 / $50,000,000 = 0.04 or 4%
Here, the company has a lower ROE given the same shareholder's equity, so it is less efficient in using its shareholders' equity to generate income.
Beta (β)
The beta coefficient or market beta provides information about how the stock's price correlates on average to the entire market. This can be computed by comparing the stock to a benchmark index like the S&P 500 or the NASDAQ indices. The beta usually varies between -1 and 1. Sometimes values can go much lower than -1 or much higher than 1.
Values above 0 mean that the stock correlates positively compared to the benchmark index. The higher the beta, the higher the correlation. A higher beta also usually means that the volatility of that stock is higher as well, so the risk of holding it can be greater.
Values below 0 mean that the stock is inversely correlated to the benchmark index. The lower the beta goes below 0, the higher the inverse correlation between the stock and the market index.
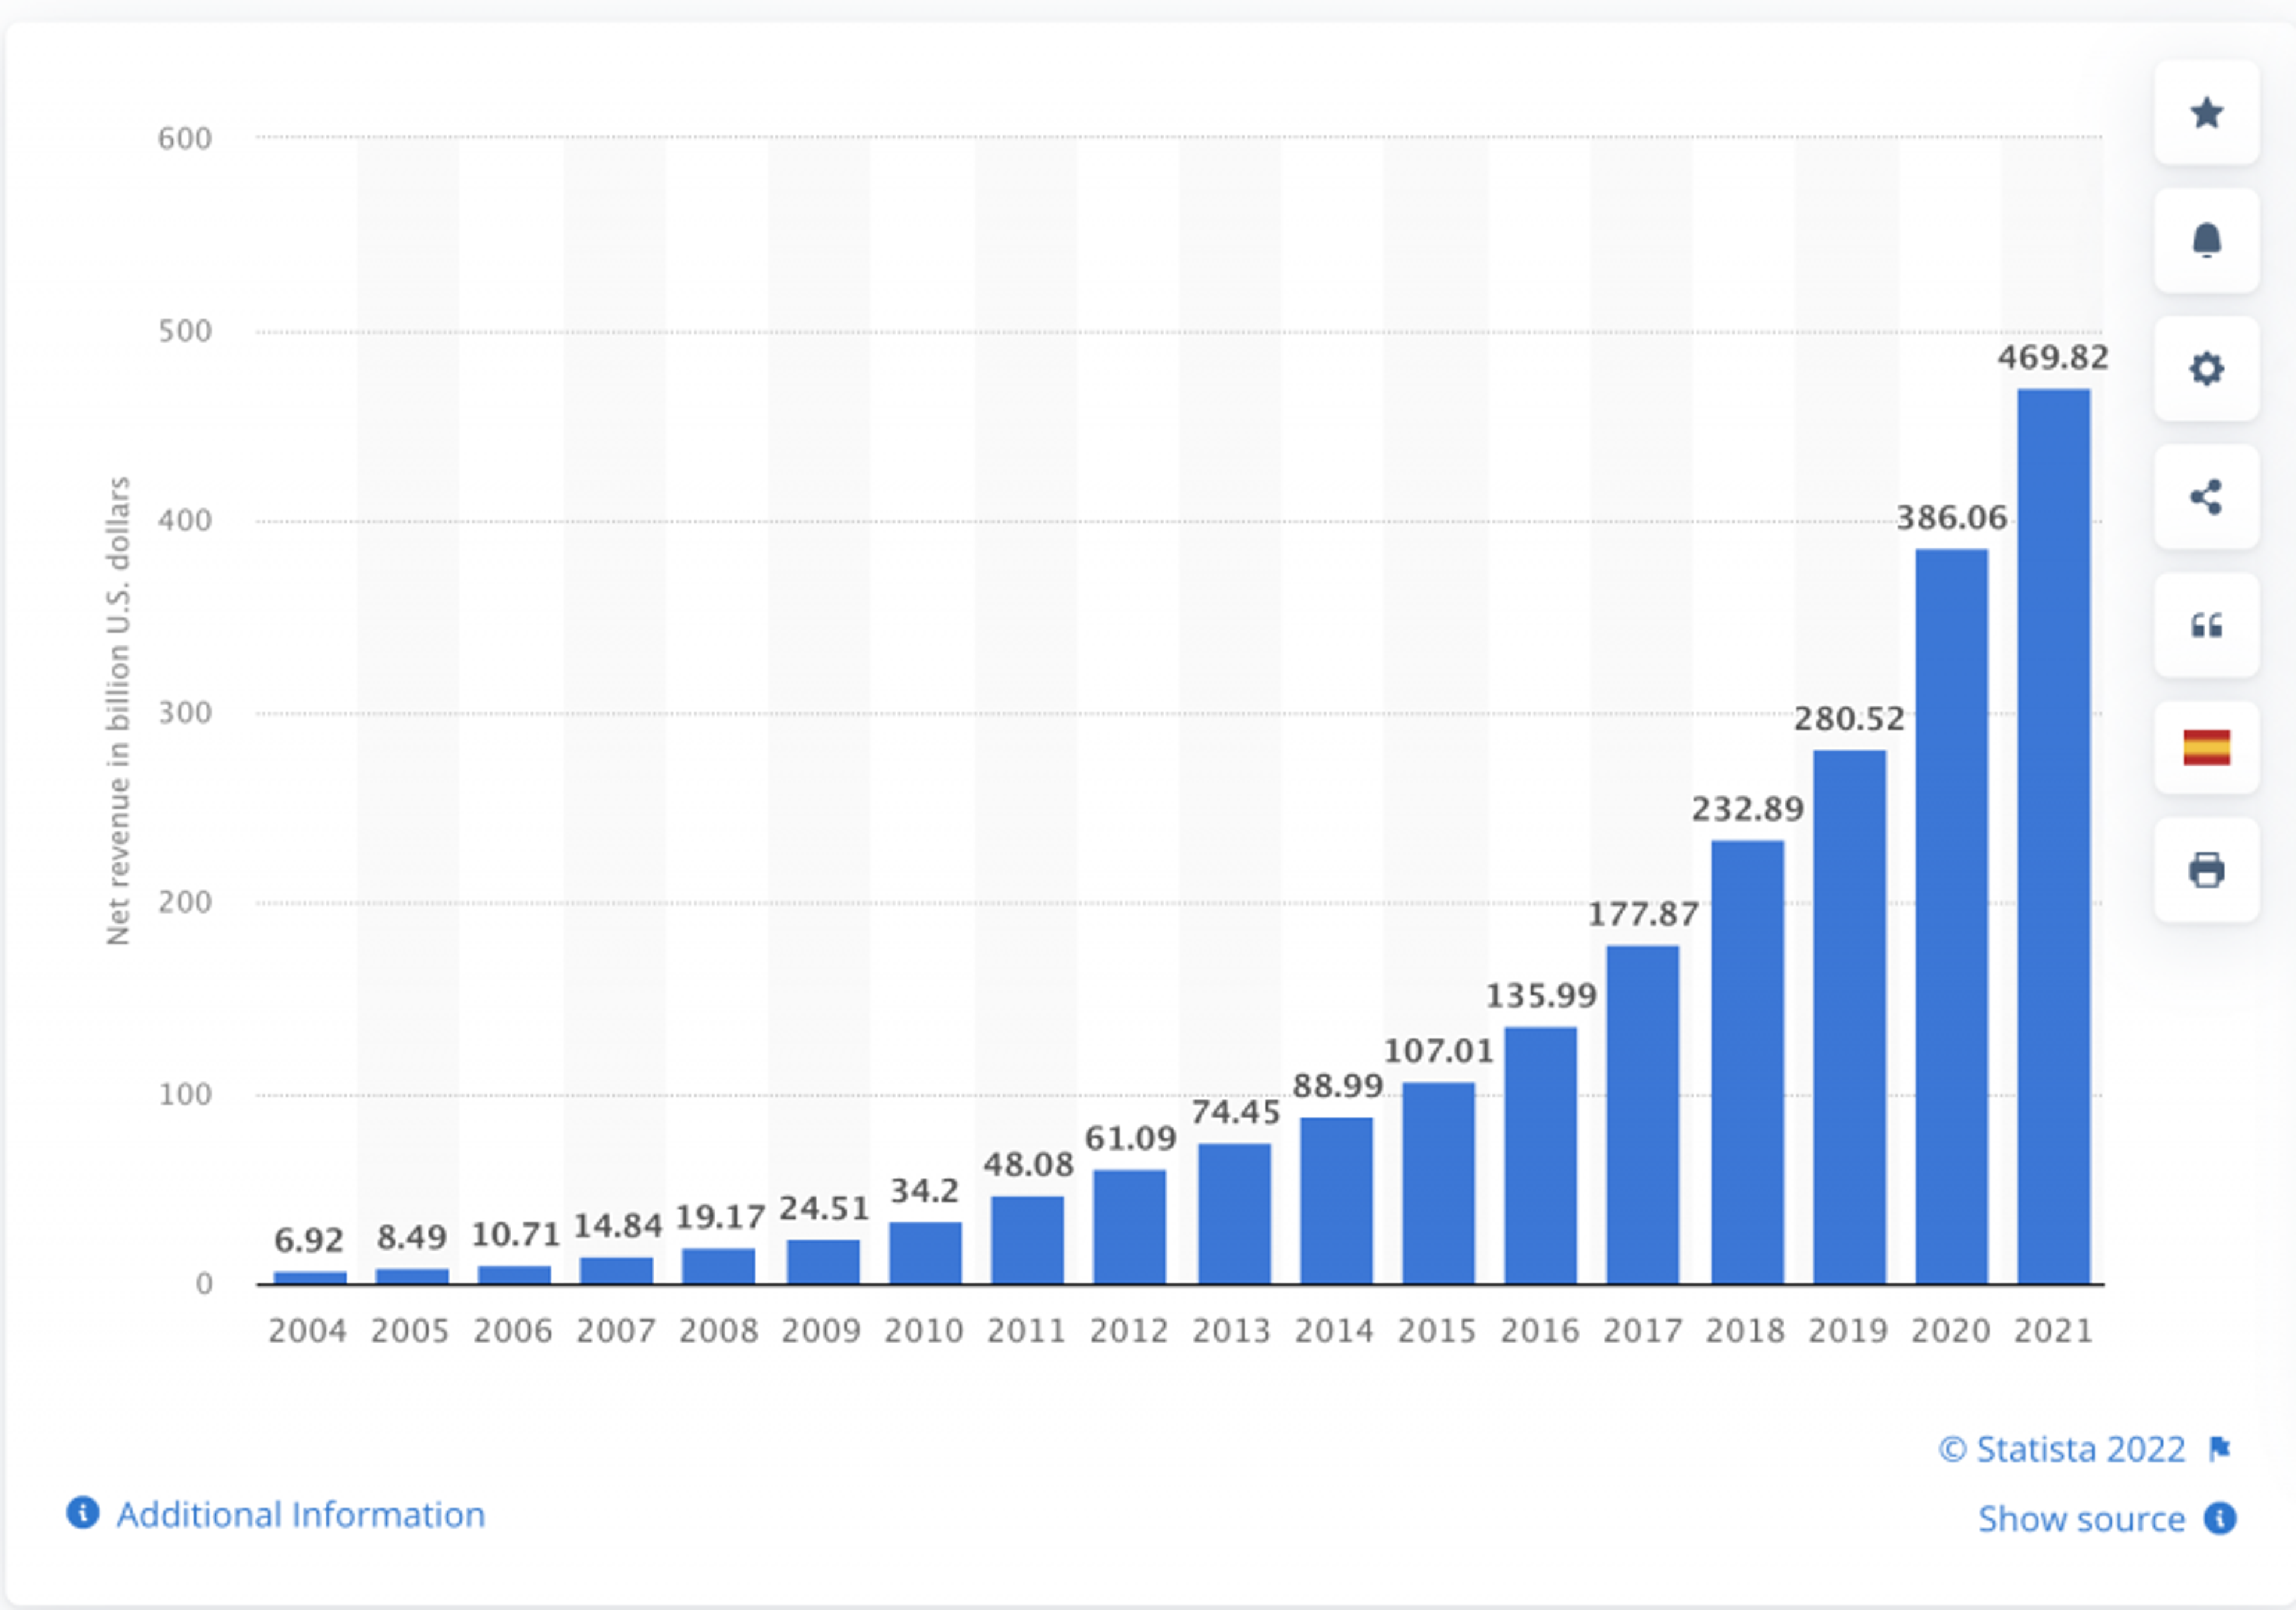
Fundamental Analysis of Amazon
Amazon.com Inc. (NASDAQ:AMZN) is a well-known stock within the tech sector. The company has shown considerable revenue growth since 2004 as the chart below shows.

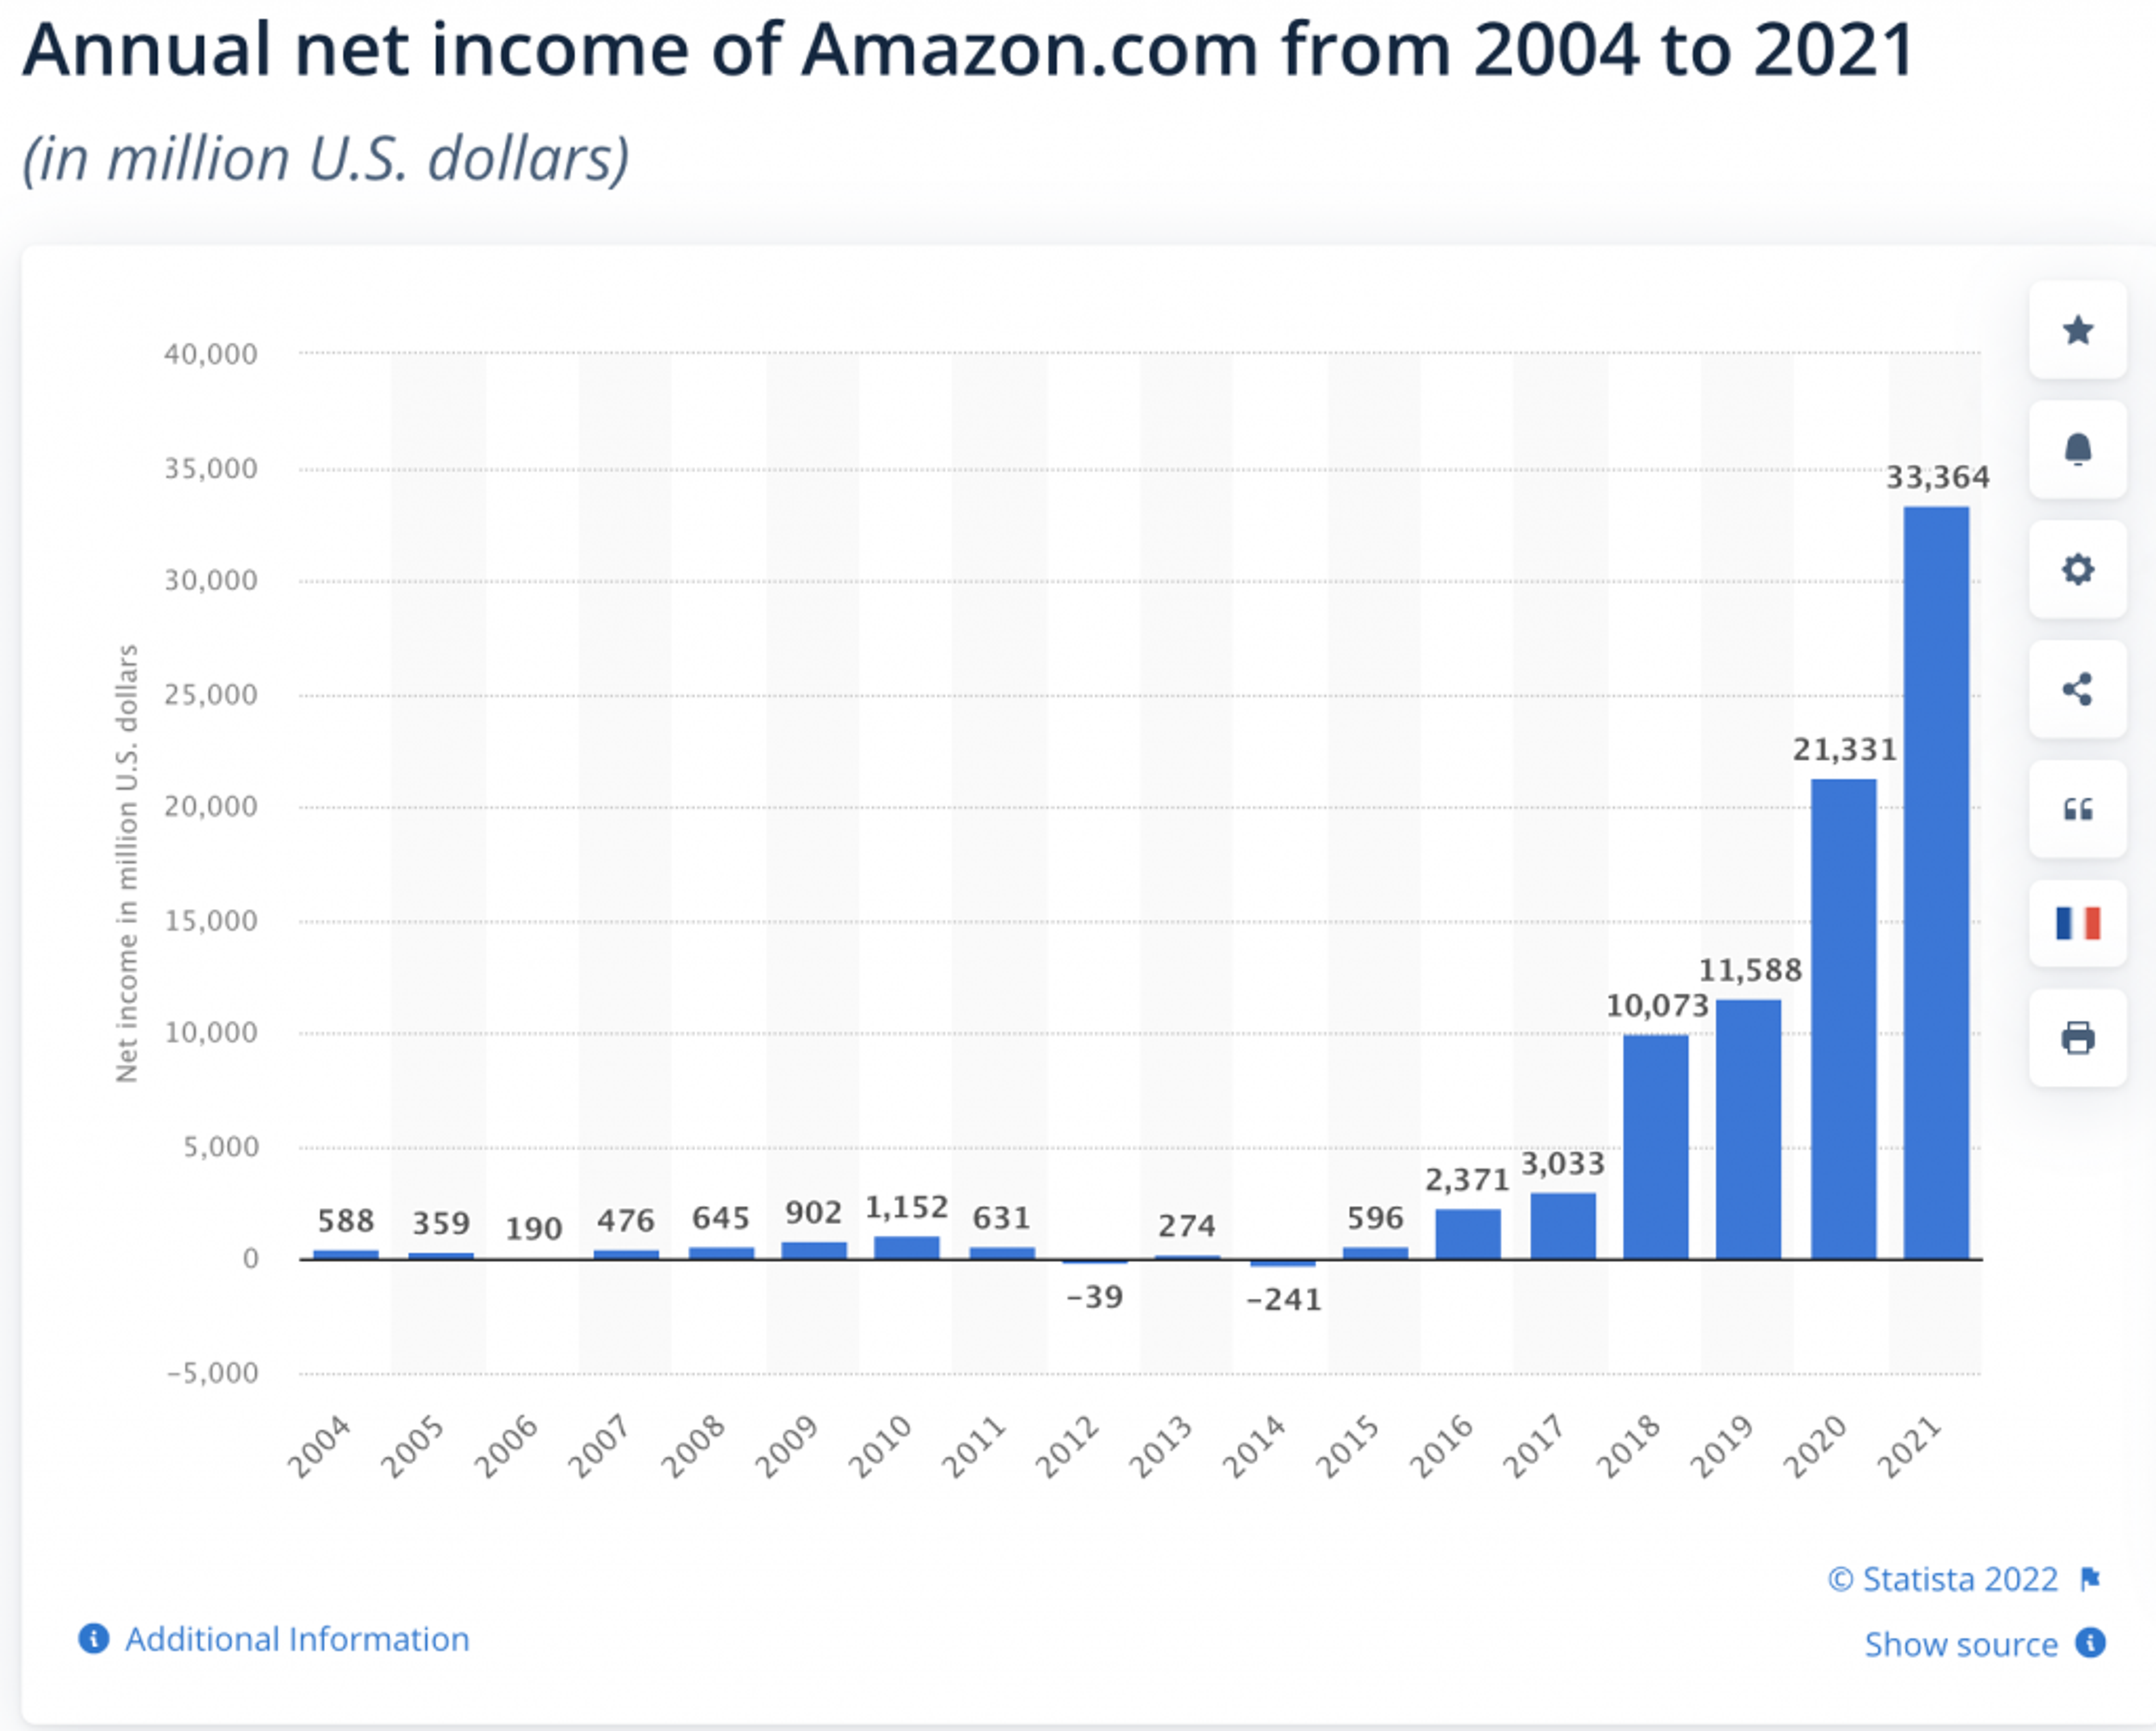
Amazon’s net income or earnings only began to rise significantly since 2015, however, as the chart below illustrates.

Another important fundamental factor is that Amazon frequently beats consensus EPS estimates.

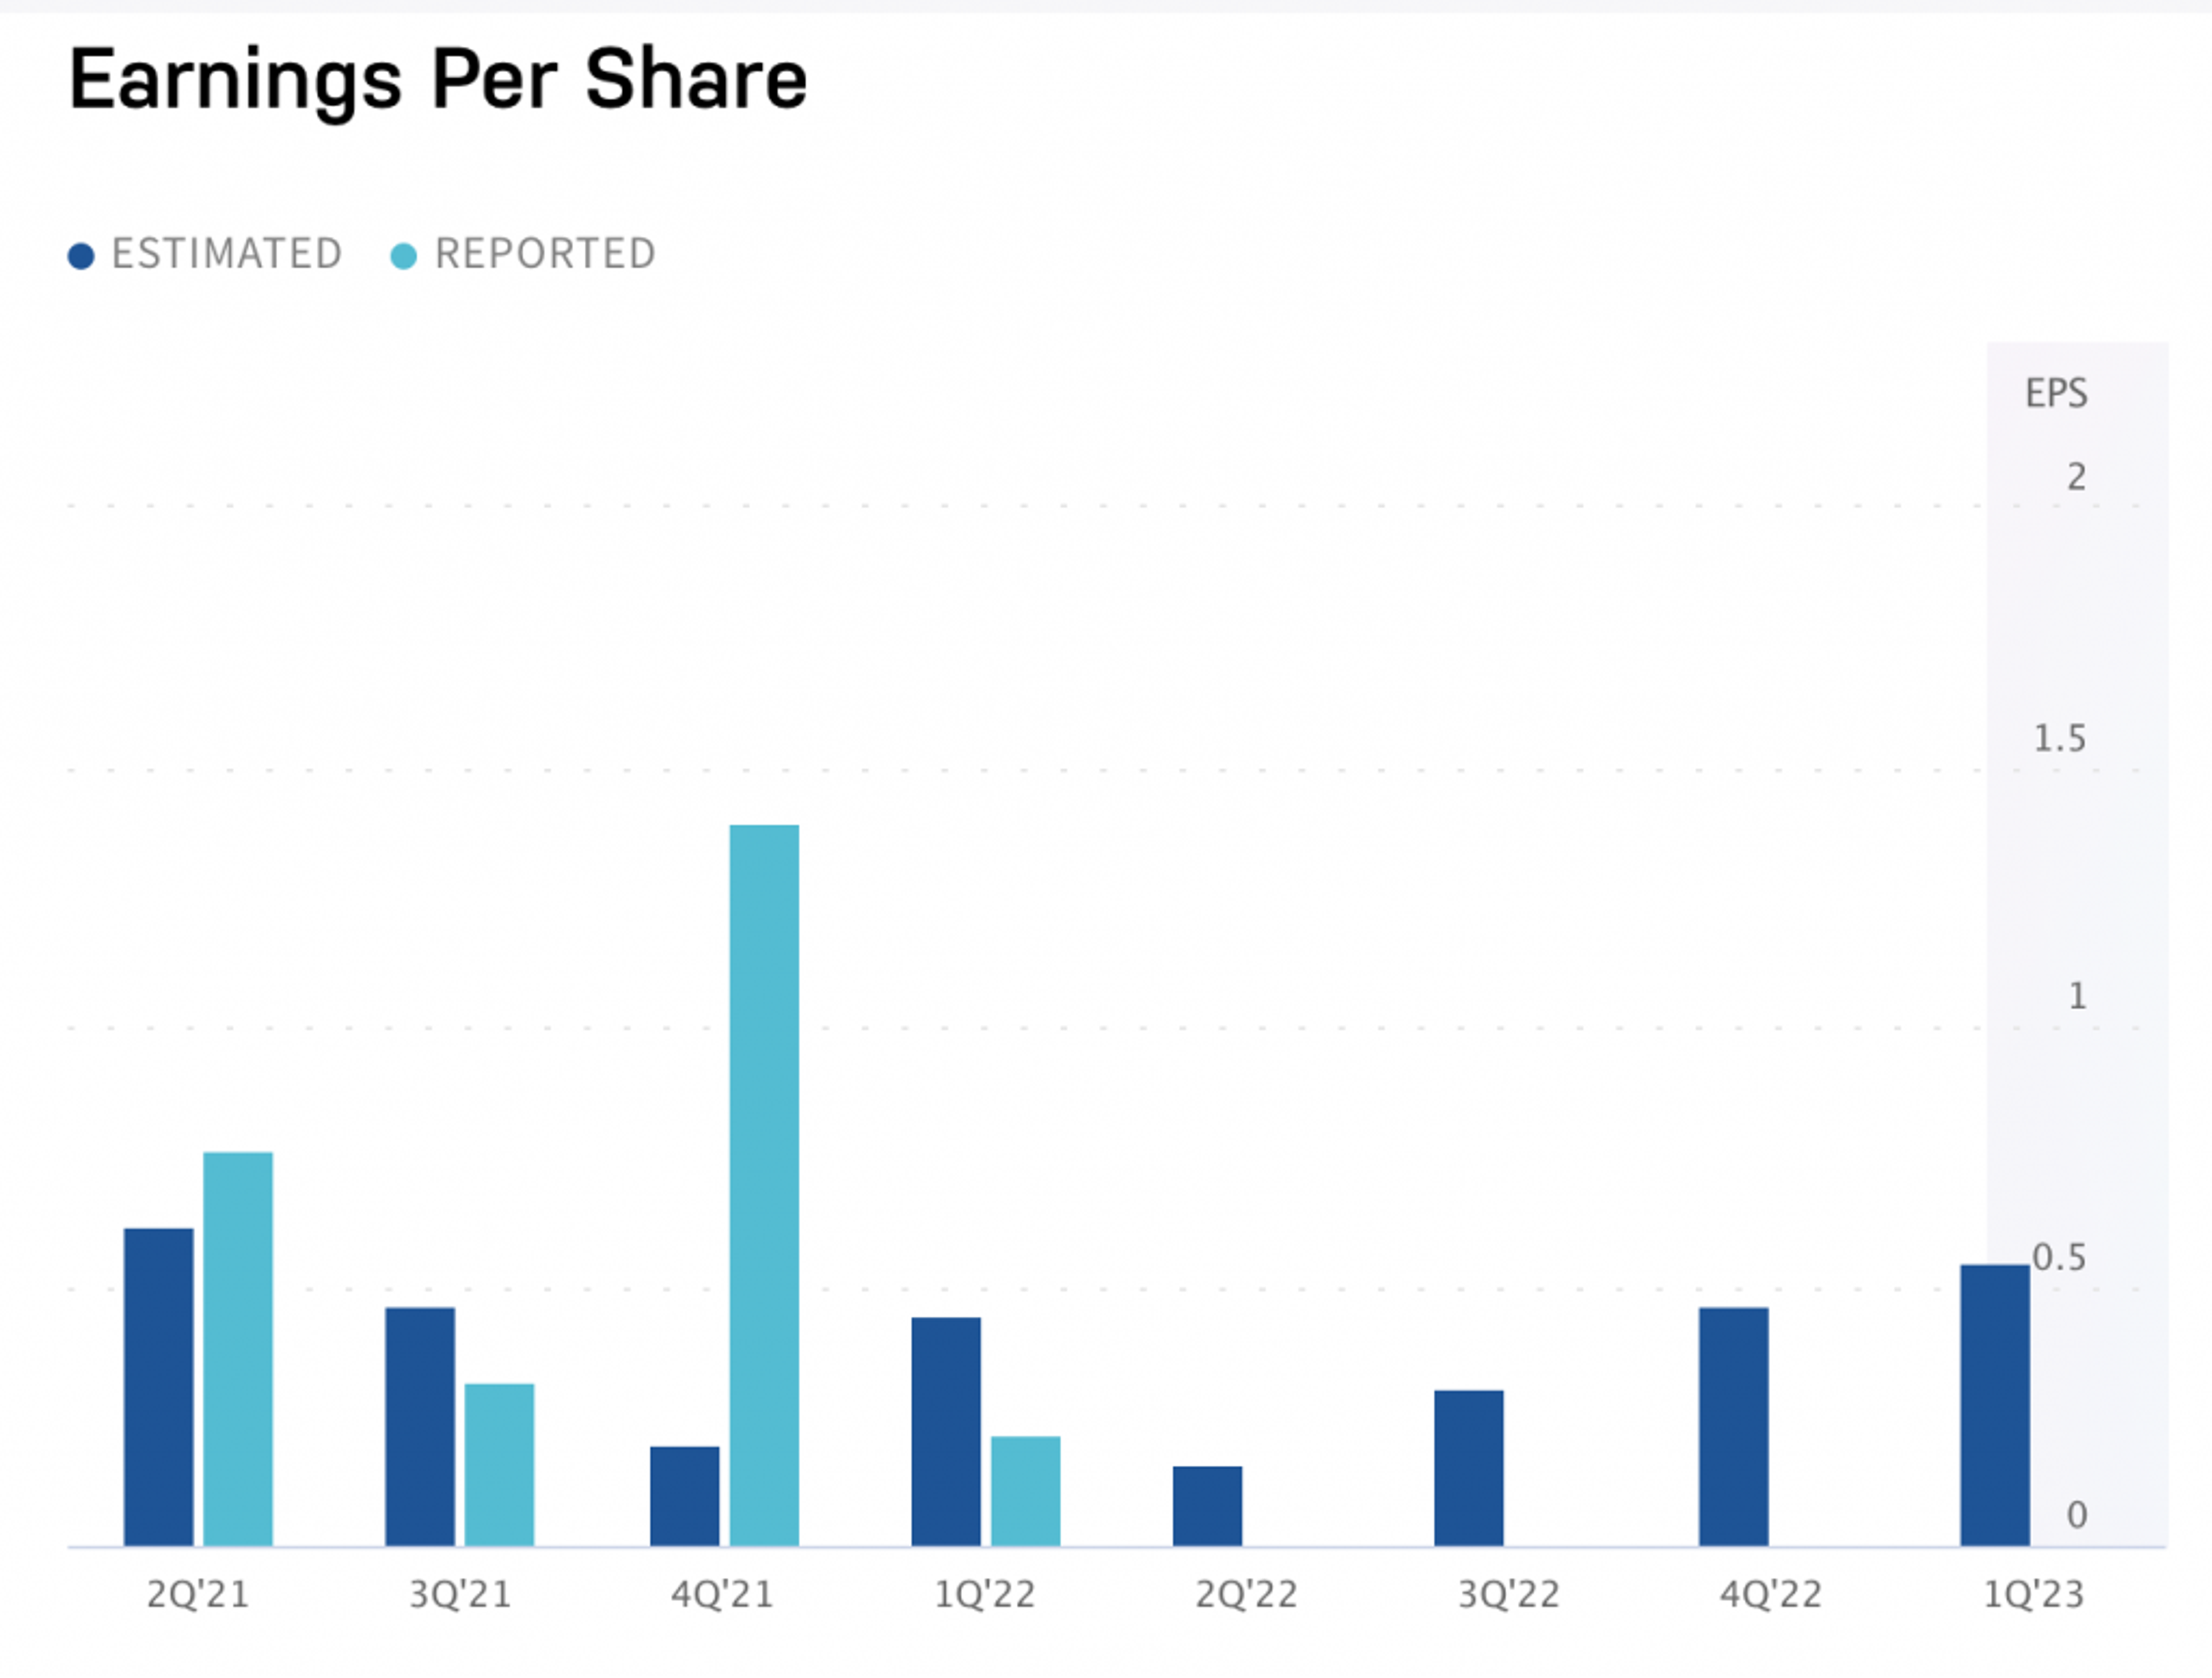
Such earnings data shows that Amazon is healthy and aims for growth that beats expectations every year. The best news is that they are succeeding, for now at least.
Diluted earnings per share: $3.99 in 2022
Note that Amazon's diluted EPS seems low compared to its current stock price of $140. This results in an extremely high P/E ratio for Amazon of:
P/E ratio: 75
This tells us that only a very small part of Amazon's earnings actually goes to its shareholders. This is totally normal for an IT company of Amazon's rank. They constantly expand and reinvest funds in research and development.
Some of the fields Amazon is currently working actively in include robotization and artificial intelligence. Since the company spends a lot on R&D there, there's not much left for the shareholders.
This offers up further information, however. Since Amazon invests a lot and aims to expand more, we can expect the company to grow even further.
P/B ratio: 8.11
That number is the ratio of Amazon's stock price divided by its book value per share. A P/B ratio of nearly 10 is very high. This means investors are currently paying nearly ten times more for an Amazon share than the book value of the company.
ROE: 8.62% as of June 2023
Amazon.com's net Quarterly income in Q2 of 2023 attributable to common stockholders was $13.1 billion. The company's average total stockholders equity (TSE) in that same quarter was $168.6 billion.
Amazon's ROE % is normally closer to 20%. The company is quickly regaining ground and should return to that level soon. Here's a general comparison with other top tech companies from the S&P 500:
- Apple's (NASDAQ:AAPL) ROE: 164.9%
- Meta Platform's (NASDAQ:META) ROE: 17.7%
- Microsoft's (NASDAQ:MSFT) ROE: 38.2%
- Alphabet's (NASDAQ:GOOG,NASDAQ:GOOGL) ROE: 23.5%
- PayPal's (NASDAQ: PYPL) ROE: 20.3%
Beta: 1.17
Beta shows the sensitivity of a stock's expected excess asset returns to expected excess market returns, and Amazon has a relatively high beta. This means its stock is well-correlated to the S&P 500 benchmark index, and it is also one of the top 10 stocks of the S&P 500 in terms of its market capitalization.
Furthermore, a beta of 1.17 means that Amazon's stock price is currently more volatile than the overall market.
Fundamental Analysis vs. Technical Analysis: What's the Difference?
Fundamental analysis for stocks relies largely on computing and reviewing a company's various financial parameters as you saw in our analysis above. Technical analysis, on the other hand, only takes into consideration past price action and other market observables like volume and open interest to forecast future price behavior.
Investors typically perform technical analysis on a chart. The goal of their analysis is to make forecasts based on past stock price performance. Pure technical analysts don't rely on company data and fundamentals. Instead they compute technical indicators and analyze charts for patterns they recognize as having a strong potential to predict future price behavior.
At first take, the idea that technical analysis might be able to predict future price behavior could seem surprising. However, there's a strong relationship between price action and the psychology of market participants.
Furthermore, since the price of a stock is based on supply (selling interest) and demand (buying interest), important psychological levels in the price of a stock could have an impact on the attitude of the market participants when those levels are attained.
An example of this is a round number level on a chart like $100 that is likely to have a psychological impact on market participants. If a stock approaches below $100 per share, this $100 psychological level could attract selling interest since many investors might think that the company has no capacity to expand above $100 per share. They therefore decide to sell their assets at or below that level, thereby creating supply and providing resistance to the price of the stock trading above $100.
Technical analysts use various tools to analyze the price action of stocks. Some of these are especially useful chart types like candlestick and point and figure charts. Others are patterns like triangles, trend lines and channels, while computed indicators might include historical volatility and momentum oscillators. Volume numbers are also often used by technical analysts to confirm chart pattern breakouts.
Each of these tools helps a technical analyst predict market behavior in different ways. When the signals obtained from them align with each other, a technical analyst can use them to trade with greater certainty.
Best Research Tools for Fundamental Analysis
In most cases, your broker will supply you with most of the important data you'll need to conduct a fundamental analysis of a stock. Some other excellent sources of information and research tools for fundamental analysis include the following.
Finviz


Finviz is a very adequate solution you can use to screen fundamental stock data, and it even has a helpful free version.
This is what you will see when you search for a stock. The data includes the most important fundamental parameters of a stock you can use in your analysis.
Benzinga Pro

Benzinga Pro gives you everything you need for market news and research in an easy-to-use platform. Powered by the Benzinga Pro Newsfeed, you’ll get lightning-fast market news and data to inform your trading decisions. Benzinga Pro offers more:
- Audio alerts to key headlines and breaking news with Audio Squawk.
- The Benzinga Pro team monitors the news you need to know from 6 a.m. to 6 p.m. EST.
- Use Movers and Screener to scan for stocks tailored to your trading strategy.
- Access to Signals notifies you about events such as block trades, price spikes, opening gaps and more.
- Chat community lets you ask questions, get trading ideas and more with traders of all experience levels.
Get access to all of this and more when you start a free 14-day trial of Benzinga Pro.
Stock Rover

Stock Rover is a comprehensive stock analysis and screening tool that gives investors access to high-quality research tools, educational content, expert analysis and more.
It goes well beyond standard analysis tools, offering account holders 1 of the most comprehensive sets of screening criteria and research qualifications that we’ve seen. For example, you can filter investment opportunities using over 650 metrics with Premium Plus access.
Stock Rover offers 4 different plan tiers, and free accounts can give you a better feel for Stock Rover’s setup. You can also sign up for a free trial of its Premium Plus.
Getting started with a Stock Rover account is also exceptionally easy — we were able to open our free account in under 60 seconds.
Get Familiar with Fundamental Analysis
Many people consider fundamental analysis an essential part of stock trading and investing. You should become familiar with the basic fundamental indicators if you want to start investing in stocks so you can build a better picture of the financial condition of a company and determine if it's financially efficient, sustainable and profitable.
Although fundamental stock analysis is important, it often makes sense to pair it with technical analysis. Keep in mind that important psychological levels on the chart might be a turning point and watch for classic chart patterns. Try to find situations where the technicals agree with the fundamentals for better opportunities. If you manage to master both of these techniques, your analysis can reach a new level of market forecasting accuracy.
Looking to improve your stock trading strategy? Check out our guide on how to create an investment strategy, or the best online stock brokers for beginners if you’re just starting to build your portfolio.
Frequently Asked Questions
What is the benefit of using fundamental analysis?
Fundamental analysis looks at the company’s financials and industry to determine if it is a good long-term investment.
What factors influence fundamental analysis?
Factors that influence fundamental analysis include the economy, industry, management and the firm’s financial condition.
Is fundamental analysis better than technical analysis?
Fundamental analysis is better for long-term investors. Technical analysis is more suited for day trading and swing trading strategies.
Related content: TrendSpider Review