Market Overview
It was a perfect storm for a pause in rate hikes by the Fed. Both inflation and the jobs numbers came in below estimates, and rate hike odds for the end of the month tumbled. This sent the Nasdaq to new all-time highs again, with the market’s biggest and strongest tech names continuing to lead the way. It finished up 0.45% on the week, while the S&P 500 and Dow Jones Industrial Average were both down 0.27% and 1.26%, respectively. Bonds are still trying to figure out how to recover, but they’ll need help from crude oil. Meanwhile, the world keeps piling their money into U.S. markets, hence the bid in the Dollar.
Stocks I Like
Bruker Corporation (BRKR) – 45% Return Potential
What’s Happening
- Bruker Corporation (BRKR) is a leading developer and manufacturer of high-performance scientific instruments and analytical solutions that enable researchers to explore life and materials at the molecular, cellular, and microscopic levels, serving applications in life sciences, diagnostics, materials science, and energy, offering investors exposure to the rapidly growing scientific instrumentation, life sciences tools, and analytical technology sector with a focus on enabling breakthrough discoveries and improved productivity.
- The last quarter had revenue of $838.5 million but a loss of $62.9 million.
- Valuation in BRKR is high. Price-to-Sales is at 2.75, Book Value is 15.63, and EV to EBITDA is at 41.77.
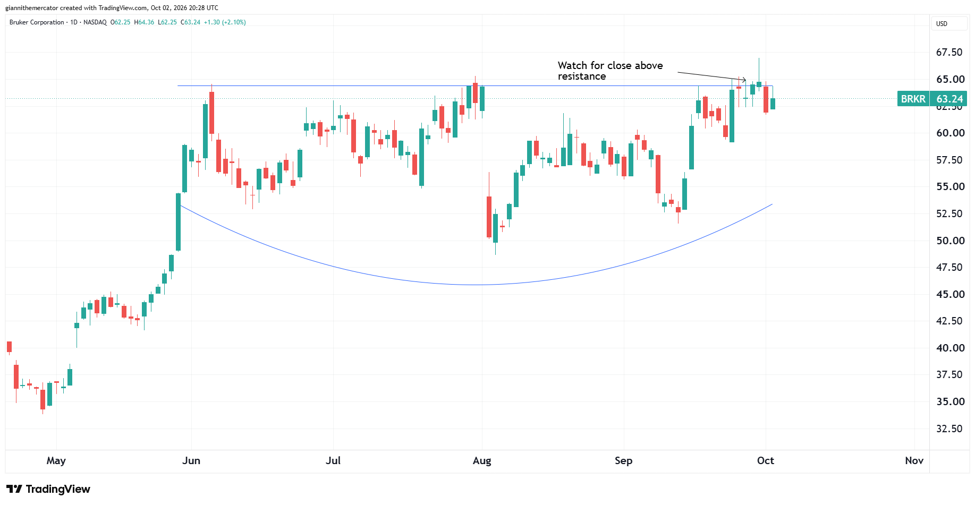
- At a technical level, BRKR is pressing into resistance of a saucer formation. A clearance of resistance should translate to a powerful surge to the upside.
Why It’s Happening
- Bruker is back to organic growth after a soft academic-funding stretch. Second-quarter revenue rose 5.2% to $838.5 million (2.8% organic), Scientific Instruments bookings jumped about 10% with a book-to-bill above 1.0, and non-GAAP EPS climbed 53% to $0.49 as cost actions took hold.
- Biopharma and China are pulling the order book forward. Management pointed to the first meaningful China order rebound in several quarters—more than 20% growth—and broad-based biopharma demand across regions, which is more important for 2027 than the still-muted U.S. academic lab spend.
- AI-era semiconductors and energy research are new demand engines. Semiconductor metrology tools are seeing AI-driven bookings, some of which slipped from Q3 into a heavier Q4. Energy-research orders more than doubled in the first half, BEST organic revenue rose nearly 9%, and Bruker’s superconductor unit partnered with Luvata to supply high-performance RRP wire for magnetic-confinement fusion.
- Proteomics and diagnostics keep getting thicker. At HUPO 2026 Bruker launched timsUltra AIP and timsOmni workflows for deeper protein-sequence coverage, glycoproteomics, and nucleic-acid analysis. It also bought the DISQVER metagenomic blood-pathogen platform and took a majority stake in MIMETAS organ-on-a-chip models—pushing from instruments into functional biology and infection detection.
- Earnings can outrun modest top-line growth. Bruker is targeting $140 million of annualized cost savings, delivered $30 million in Q2 alone, guided non-GAAP EPS up 15–17% for 2026 on only 1–2% organic revenue growth, and is lining up a heavy fourth quarter of ultra-high-field NMR installations plus delayed semiconductor shipments.
- Analyst Ratings:
- UBS: Neutral
- Citigroup: Neutral
- Guggenheim: Buy
My Action Plan (45% Return Potential)
- I am bullish on BRKR above $52.00-$53.00. My upside target is $92.00-$94.00.
Qorvo (QRVO) – 27% Return Potential
What’s Happening
- Qorvo, Inc. (QRVO) is a leading semiconductor company that designs and manufactures radio frequency (RF) solutions, connectivity chips, and power management products for smartphones, IoT devices, automotive, defense, and infrastructure applications, offering investors exposure to the rapidly growing wireless communications, 5G/6G, and connectivity semiconductor sector with a focus on high-performance analog and RF technologies that enable faster, more efficient wireless connections.
- The previous quarter delivered $784.79 million in revenue and $85.8 million in earnings.
- Valuation is high in QRVO is slightly elevated. P/E is at 26.99, Price-to-Sales is at 2.95, and EV to EBITDA is at 13.39.
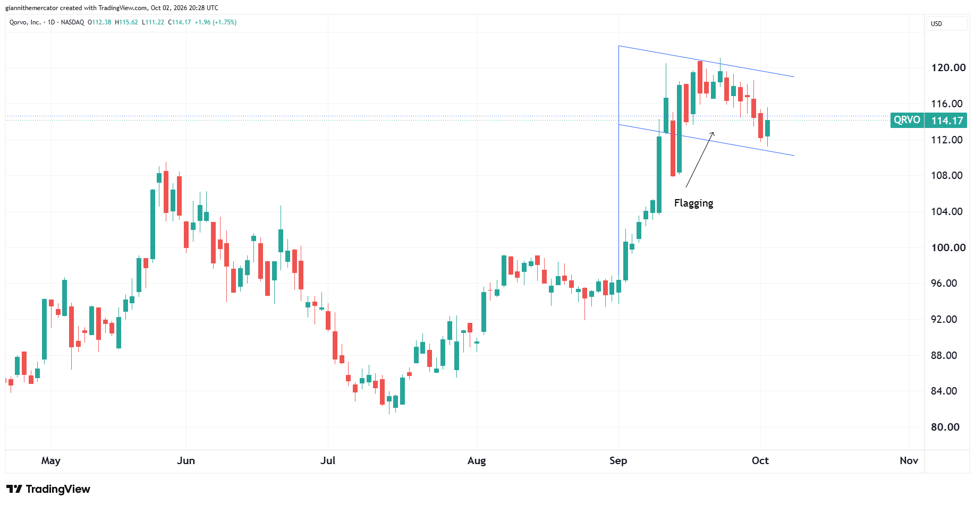
- From a technical standpoint, QRVO looks to be completing a bull flag formation, which is one of the most powerful patterns in all of technical analysis. This is setting up for another explosive rally higher.
Why It’s Happening
- Qorvo is running a cleaner, higher-margin business even as handset revenue resets. Fiscal first-quarter revenue was $784.8 million, but non-GAAP gross margin jumped to 52.8%—up nearly 9 points from a year earlier—and non-GAAP EPS rose to $1.64 from $0.92 as the company exited lower-tier Android and kept higher-value placements.
- Defense, aerospace, infrastructure, and power are now the growth engine. High-Performance Analog revenue surged about 50% year-over-year to $206 million on double-digit gains in defense and aerospace, infrastructure, and power. Management expects defense-and-aerospace sales near $500 million in fiscal 2027, helped by radar upgrades, drones, SATCOM, and programs such as Golden Dome.
- Content, not unit share, is the mobile story. Advanced Connectivity Group revenue is down as Qorvo walks away from mass-tier Android, but the remaining smartphone work is tilting toward premium RF front-end and antenna-tuning content—including 3D RF-SOI designs that pack more switching into less board space.
- Manufacturing is being simplified while mix improves. Qorvo sold its North Carolina fab and is concentrating SAW filter production in Texas, pairing a leaner footprint with the mix shift that already lifted GAAP gross margin above 51% in the June quarter. For fiscal 2027 it still expects non-GAAP gross margin above 50% and non-GAAP EPS above $7.00.
- The Skyworks combination is the near-term corporate catalyst. Shareholders of both companies have approved the deal—$32.50 in cash plus 0.960 Skyworks shares per Qorvo share—and the related note exchange is more than 90% tendered. Closing still needs remaining regulatory approvals, but the logic is a broader RF portfolio spanning handsets, infrastructure, and defense with identified cost synergies.
- Analyst Ratings:
- UBS: Neutral
- Citigroup: Neutral
- JP Morgan: Neutral
My Action Plan (27% Return Potential)
- I am bullish on QRVO above $98.00-$100.00. My upside target is $145.00-$150.00.
Amazon (AMZN) – 30% Return Potential
What’s Happening
- Amazon.com, Inc. (AMZN) is a leading global technology and e-commerce company that operates the world’s largest online marketplace, cloud computing platform (Amazon Web Services), digital streaming services, and a growing portfolio of AI and logistics solutions, offering investors exposure to the rapidly growing e-commerce, cloud computing, digital advertising, and artificial intelligence sector with a focus on customer-centric innovation and scalable infrastructure.
- The previous quarter delivered $200.61 billion in revenue and $62.65 billion in earnings.
- Valuation in AMZN is solid. P/E is at 19.80, Price-to-Sales is at 3.45, and EV to EBITDA is at 10.84.
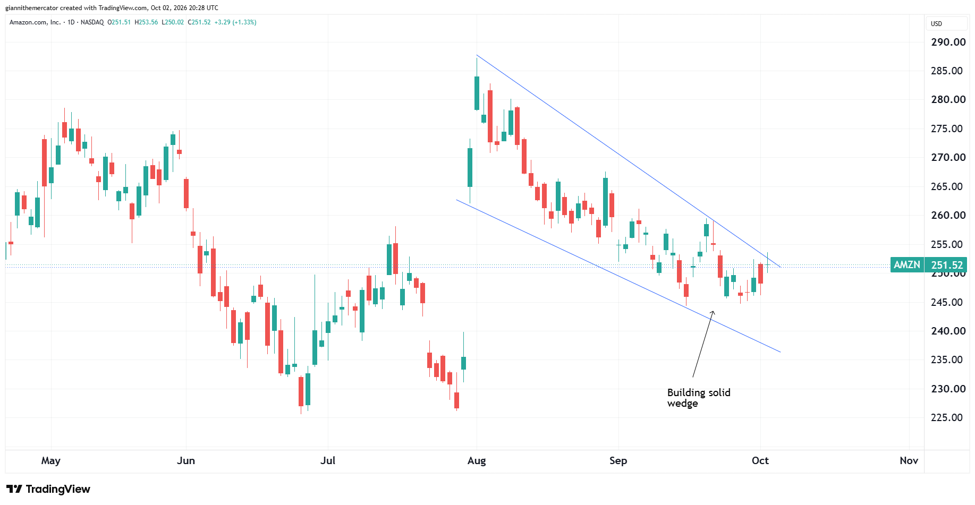
- From a charting point of view, AMZN has corrected into a falling wedge. A break above the upper trendline of the pattern should take it back to new all-time highs.
Why It’s Happening
- Amazon just posted its first $200 billion quarter. Second-quarter net sales rose 20% to $200.6 billion and operating income jumped 43% to $27.5 billion, with North America up 16%, International up 15%, and the stores network delivering more than 40% more same-day or overnight items for Prime members.
- AWS is accelerating again, not just growing. Cloud sales rose 37% to $42.2 billion—the fastest pace in 18 quarters—on a $169 billion annualized run rate. Operating margin reached 39.4%, AWS supplied about 60% of company operating profit, and the contracted backlog stood at $496 billion.
- AI and custom silicon are already large businesses inside AWS. Amazon said both its AI services and its chips franchise (Trainium accelerators and Graviton CPUs) have crossed $25 billion annual run rates and are growing at triple-digit rates as customers move inference into production on Bedrock and related tools.
- Advertising is the third profit engine. Ad services grew 26% to $19.8 billion, faster than retail, helped by Sponsored Products, Prime Video inventory, and Ads Agent—an AI campaign tool now in more countries that is cutting cost-per-impression and cost-per-acquisition for advertisers who use it.
- The flywheel still has room to compound. Grocery and Everyday Essentials are outgrowing the rest of retail, Amazon Now same-day service is expanding city by city, Project Kuiper has about 400 satellites in orbit ahead of initial service later in 2026, and Q3 guidance still points to $197–$202 billion of sales heading into a record U.S. holiday season.
- Analyst Ratings:
- Truist Securities: Buy
- TD Cowen: Buy
- Argus Research: Buy
My Action Plan (30% Return Potential)
- I am bullish on AMZN above $210.00-$215.00. My upside target is $325.00-$330.00.
Market-Moving Catalysts for the Week Ahead
Fed Hike Expectations Slip
Perhaps the biggest economic data drop last week was how Core PCE came in well below estimates. As a result, rate hike odds tumbled, and markets are now pricing in only a ~33% probability of a hike at the October 28 meeting.
This may be setting up a major squeeze on the long-end of the bond market, which has collapsed. In time, it may even be setting up a recession a couple years form now if the yield curve inverts. That happens when long-term rates drop below short-term rates.
It’s worth keeping in mind that the slower the Fed raises rates, the more bullish it tends to be for stocks. Also remember that if a company isn’t growing above the "risk-free" rate set by Treasuries, there’s little-to-no-incentive to own them. This could end up sending more money into the mega-cap tech names.
Respect Relative Strength
Market breadth has been a persistent source of frustration for many participants, because the advance has been extremely narrow. A large share of stocks have lagged, stalled, or even declined, so anyone diversified across the broader market, equal-weight indexes, or smaller names has felt little of the upside.
At the same time, the headline S&P 500 and Nasdaq have held up because both are market-cap weighted. The largest 10–20 companies therefore dominate the index calculation, and strength in those mega-caps has been enough to offset weakness elsewhere and keep the benchmarks elevated even when most stocks are not participating.
The best way to outperform the market is to own the strongest stocks in the strongest sectors. The strong get stronger, and the weak get weaker. Crashes don’t tend to form from highs, and surprises tend to occur in the direction of the underlying trend.
Magnificent ELEVEN Leadership
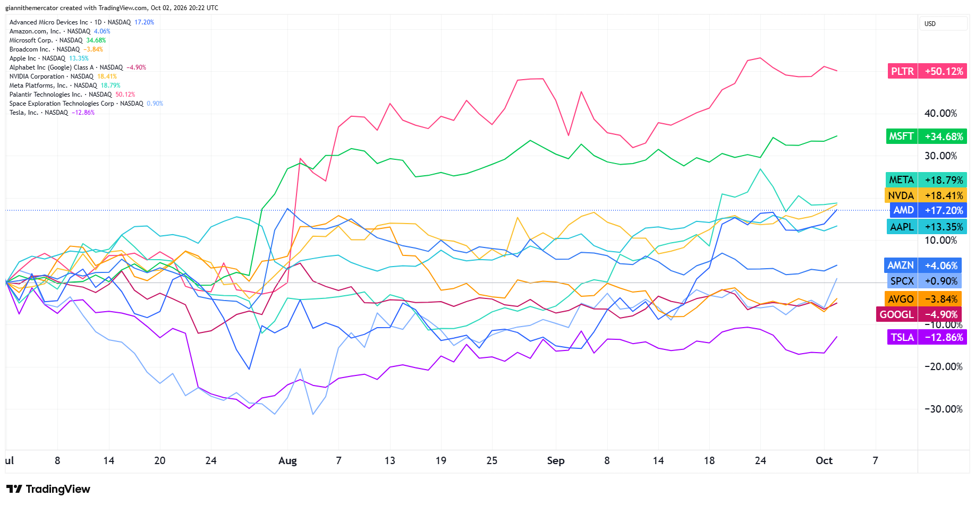
Now that Q4 is underway, I’m tightening up the timeframe to the start of the third quarter to measure relative performance amongst the mega-cap tech names. By far and away, PLTR is the top name in the category, but I’m still keen on rotation in this final quarter of 2026. It just so happens that Tesla’s seasonal factors favor the bullish side going into year-end. Since SPCX is owned by Elon too, don’t be surprised if it has a strong quarter too. Note how MSFT is strong too. The rotation into software is accelerating.
Sector & Industry Strength
Tightening up the timeframe on the sectors to the start of Q3 as well. Energy has been the top performer since Q3, but technology is trying to catch up now. It’s still good to see utilities at the bottom of the pack. Would be ideal to see consumer discretionary flip consumer staples in the coming weeks too.
| 1 week | 3 Weeks | 13 Weeks | 26 Weeks |
| Technology | Technology | Energy | Technology |
Editor’s Note: No change – bulls still carry the momentum.
A Chance for China? (Sector ETF: FXI/SPY)
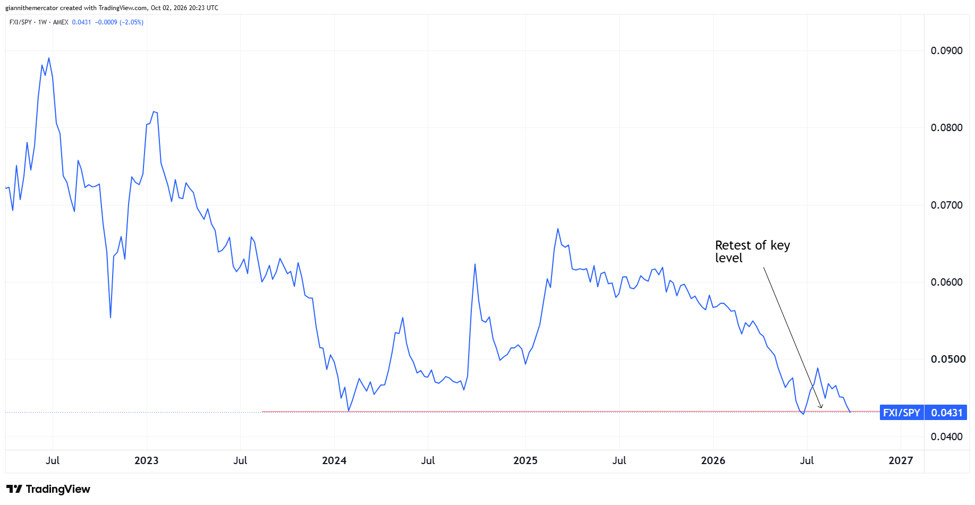
U.S. stocks have been outperforming their international counterparts in recent months, in a massive reversal of the trend we’ve seen since the start of 2025. But this week, I want to focus in on China specifically.
The ratio between Chinese equities (FXI) and the S&P 500 (SPY) is displayed below. After a nice run from early-2024 into the start of 2025, Chinese stocks slipped and have been underperforming U.S. stocks by a notable margin.
But now, the ratio is back to a level where it last staged a notable rally. There’s a double bottom setup here, and it gives the Chinese market something to work with. Let’s see if it can take out that high from late-July as a start.
The DeFi Battle Rages (Sector ETF: SOL/ETH)
More and more countries are moving towards 23 or 24 hour trading, which means the blockchain technology is finally being implemented at scale. While Bitcoin remains the king of crypto, I’m much more interested in what’s going on between Solana and Ethereum.
Solana and Ethereum are the main "DeFi" (decentralized finance) coins. I’m not going to get into the fundamentals behind each coin, mainly because I think the market’s appetite for each is reflected in the price.
Ethereum has been outperforming Solana since April 2025. The ratio has been trending lower, but there may be a higher-low that was just completed. I’m more interested in the potential descending channel, which could signal a reversal back to the upside and a restoration of the longer-term uptrend. This would benefit Solana and suggest it’s in a position to outperform the most.
Junk Starting to Feel Pressure (Sector ETF: HYG/IEI)
The unwind in bond markets is nothing short of remarkable. And the fact that stocks have held up so well during this time really speaks to the strength of that asset class. The inflation data from last week gives the Fed some desperately needed wiggle room for bonds now.
I have the ratio between junk debt (HYG) and 3-7 Year Treasuries (IEI). It looks like it formed a secondary, lower-high in recent weeks. You could even call it a double top. As a rule, you don’t want to see IEI outperforming HYG.
This means that credit spreads are widening, or stress in the bond market is starting to appear. This presents a slippery slope for the equity market, as it means liquidity is starting to evaporate. A pause on rate hikes would buy bonds some much needed time to course correct.
Cryptocurrency
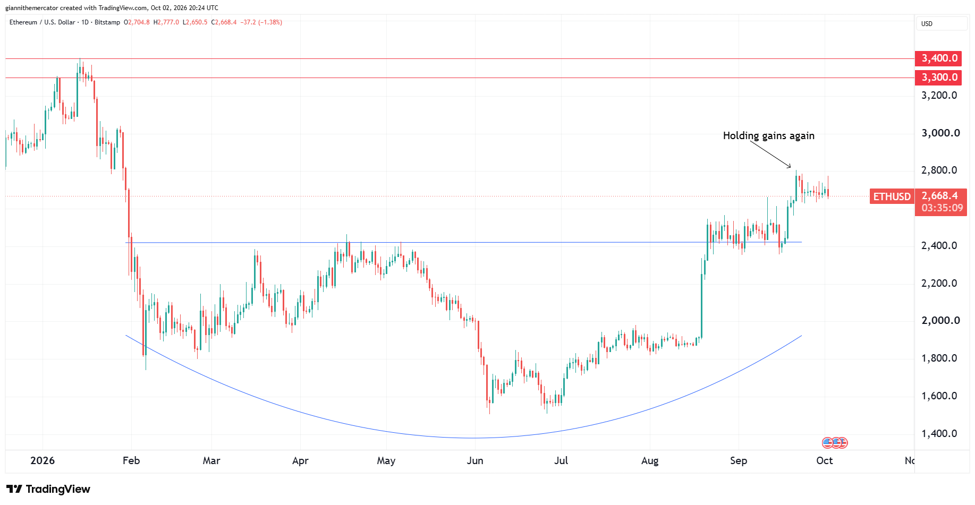
Back to Ethereum this week. It’s been rather quiet in crypto land over the past several days, but the setup here suggests that’s about to chain. Remember, consolidations near the highs of a move are considered to be bullish price action.
Ethereum rallied to its highest level since January, and is holding those gains. One could argue that another bull flag pattern is setting up here. We already saw how the one from mid-September resolved higher.
The upside target in Ethereum remains at 3400-3600 for now. There’s no reason to be bearish as long as Ethereum holds above 2300-2400. In time, it may return to new all-time highs, but that’s probably not in the cards until next year at least.
Legal Disclosures:
This communication is provided for information purposes only.
This communication has been prepared based upon information, including market prices, data and other information, from sources believed to be reliable, but Benzinga does not warrant its completeness or accuracy except with respect to any disclosures relative to Benzinga and/or its affiliates and an analyst’s involvement with any company (or security, other financial product or other asset class) that may be the subject of this communication. Any opinions and estimates constitute our judgment as of the date of this material and are subject to change without notice. Past performance is not indicative of future results. This communication is not intended as an offer or solicitation for the purchase or sale of any financial instrument. Benzinga does not provide individually tailored investment advice. Any opinions and recommendations herein do not take into account individual client circumstances, objectives, or needs and are not intended as recommendations of particular securities, financial instruments or strategies to particular clients. You must make your own independent decisions regarding any securities, financial instruments or strategies mentioned or related to the information herein. Periodic updates may be provided on companies, issuers or industries based on specific developments or announcements, market conditions or any other publicly available information. However, Benzinga may be restricted from updating information contained in this communication for regulatory or other reasons. Clients should contact analysts and execute transactions through a Benzinga subsidiary or affiliate in their home jurisdiction unless governing law permits otherwise.
This communication may not be redistributed or retransmitted, in whole or in part, or in any form or manner, without the express written consent of Benzinga. Any unauthorized use or disclosure is prohibited. Receipt and review of this information constitutes your agreement not to redistribute or retransmit the contents and information contained in this communication without first obtaining express permission from an authorized officer of Benzinga. Copyright 2022 Benzinga. All rights reserved.
© 2026 Benzinga.com. Benzinga does not provide investment advice. All rights reserved.
To add Benzinga News as your preferred source on Google, click here.