If you’ve studied economics or spent any time trading in the financial markets, then you’re probably already well aware of the terms supply and demand. In the forex market, the interplay of these opposing market forces results in an equilibrium exchange rate for a currency pair that occurs when the amount of buying interest matches the selling interest.
Technical analysts generally look for levels of support and resistance that can be read from exchange rate charts and consider them indicators of supply and demand for a particular currency pair. Such support and resistance levels offer visual representations of supply and demand forex traders can use to enhance their profits.
In the following forex supply and demand article, Benzinga explains the basis of supply and demand trading as it applies to currency pairs, how to identify supply and demand points on exchange rate charts, what types of chart points are commonly used by technical analysts as a supply and demand forex indicator and some useful tips for trading chart points effectively.
- Supply and Demand Explained
- Supply Zone
- Demand Zone
- See All 13 Items
Supply and Demand Explained
The forex market relies on the prevailing level of supply and demand among market participants to determine equilibrium exchange rates. Supply and demand correspond respectively to the key technical analysis concepts of resistance and support.
If a currency pair’s exchange rate has been trending downward, the level where support arises is commonly known as a support level. This level would be where selling in the pair has been exhausted and buyers overtake sellers to push the exchange rate back up.
Conversely, if a currency pair’s exchange rate has been rising, then the level where resistance arises tends to stop the rate’s rally. This situation occurs from excess supply at that level so that the buying interest becomes exhausted and sellers start to predominate.
These concepts and their importance to technical forex traders are described further in the subsections on supply and demand below.
Supply Zone
In the forex market, supply means selling interest in a currency pair where a significant amount of the base currency in a currency pair is entering the market while a corresponding amount of the counter currency is being removed from the market. The exchange rate for a currency pair tends to decline under circumstances of excess supply, trading lower until the market eventually reaches an equilibrium point between buyers and sellers.
When excess trading supply exists for a currency pair at a particular exchange rate level from orders entered there to sell that forex pair, it creates resistance to an upward move in the pair’s exchange rate that tends to prevent it from appreciating. This phenomenon creates the so-called resistance levels seen on exchange rate charts.
When resistance levels or regions appear on a chart above the present exchange rate, savvy technical traders know the forex market will experience some difficulty rallying through those levels. This knowledge might prompt a market correction or even a reversal lower if the supply zone or selling interest at or near the resistance level is sufficient for the sellers to exert dominance over the market once again.
Resistance levels typically appear as high points observed when a market is rallying, although they can also show up in a market decline as the high points where upside corrections fail. The strongest resistance levels are seen at the highest reversal points where the market turns lower after a rally.
Demand Zone
Forex traders generally view demand as the degree of buying interest that exists for a currency pair. The exchange rate for a currency pair tends to rise under circumstances of excess demand until the market eventually reaches an equilibrium point between buyers and sellers.
When excess demand exists for a forex pair at a particular exchange rate level because of orders entered to buy that currency pair, it creates support that tends to counteract a downward move in the pair’s exchange rate that tends to prevent it from falling. This situation creates the support levels technical analysts look for on exchange rate charts.
When support levels or regions show up on a chart below the present exchange rate, technical forex traders understand that the market will have some trouble falling through those levels because of the presence of buyers there. This can prompt an upward market correction or even a reversal to the upside if the demand shown by buyers at or near the support level overwhelms the selling interest to send the market higher once again. The presence of a demand zone can heavily influence price movement.
Support levels usually show up as low points seen during a market decline, but they can also appear in a rally as the low points where downside corrections fail. The strongest support points typically appear when the market reverses upwards after an extended decline.
How to Identify Supply and Demand Zones
Through a careful visual study of exchange rate charts, forex traders skilled in technical analysis can identify key exchange rate levels or “chart points” that indicate where significant demand or supply zones for a currency pair exist.
Levels of enhanced demand zone for a currency pair are called support levels, while levels of extra supply are called resistance levels. The following image shows a schematic diagram of support and resistance levels as they might appear in an uptrend.
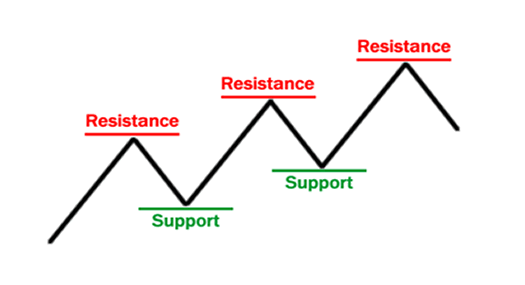
Diagram of resistance and support levels in an upwards movement. Source: BabyPips.com
Support and resistance levels can be categorized as major or minor chart points depending on the degree of importance technical analysts place on them. Several additional categories of chart points exist that include:
- Reversal level: The precise point where the market stops moving in one direction and starts moving in the other direction. Major reversals show up on a chart as significant peaks and troughs occurring at the end of trends, while minor reversals tend to appear as the extremes of short-term corrections within a trend.
- Congestion region: A range of levels where the market seems to take a break, often before continuing to trend in its previous direction. Congestion can also show up when several reversals take place within a narrow range.
- Broken levels: When support breaks, it turns into resistance. Likewise, when resistance breaks, it turns into support. These conditions are especially true for major levels.
- Psychological levels: Market participants often react to round exchange rate numbers in an exaggerated manner since they offer easy targets for long-term operators to act on.
- Fibonacci retracements: The Fibonacci retracement levels of a correcting trend can initially impede the correction, so they can serve as theoretical chart points. If they break, then the corrective movement tends to continue until the next retracement level.
- Trend lines: When a clear trend line can be drawn through a set of successive highs or lows, then it tends to provide either resistance or support respectively at the point where it presently sits.
Support and resistance levels are useful for forex traders to identify because they respectively show where buy and sell orders that correspond to demand and supply tend to accumulate in the foreign exchange market. This information can in turn help you set your own stop loss and take profit orders.
Support levels are also important to forex traders because the enhanced demand at those levels tends to cause a market decline to stop and reverse to the upside. Support can also cause the market to pause or correct higher because of the concentrated demand before eventually heading lower once sellers have gathered sufficient strength in terms of supply volume to push the market below that support level.
Similarly, resistance levels help forex traders identify key points where substantial supply for a currency pair exists. Such levels of excess supply indicate that the market will show resistance to a rally at those levels. This supply might cause a reversal to the downside or at least a pause or correction lower before the rally resumes if it can muster enough demand.
Gaining a better understanding of support and resistance levels by understanding the dynamics of supply and demand can considerably enhance your forex trading success. For example, identifying a currency pair’s nearby support and resistance levels helps forex traders choose better market entry and exit levels.
This practice can save them money when losses need to be taken and also help them make more money when taking profits. The next section will discuss how to trade forex supply and demand successfully.
How to Trade Forex Supply and Demand
The analysis of market supply and demand by identifying resistance and support levels on exchange rate charts can help technical forex traders identify better entry and exit points for their forex trades.
The chart below shows a market fluctuating within a trading range defined by lower support and upper resistance levels. An astute range trader could profit by selling when the market nears the resistance level where supply dominates and buying near the support level where demand dominates, as the black arrows show.
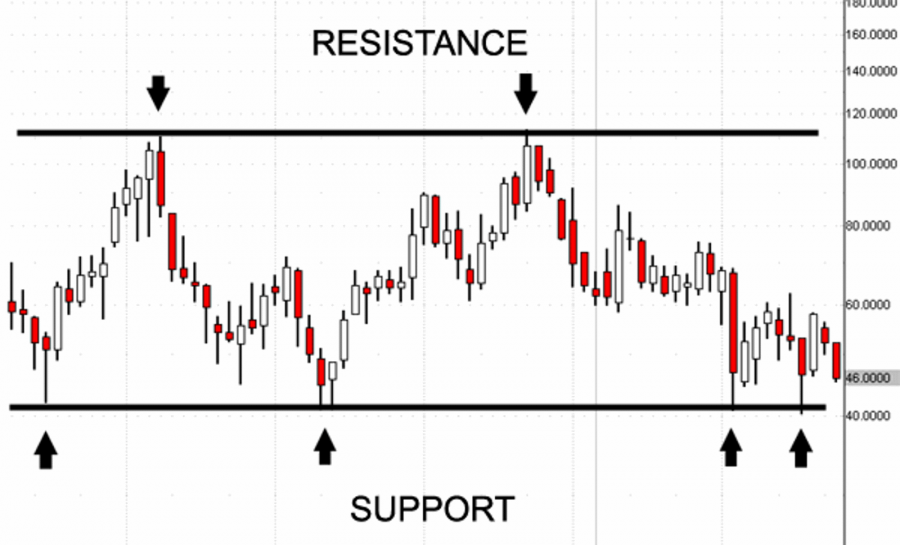
Chart showing support and resistance levels of a trading range with transactions indicated by black arrows. Source: RightLine.
Knowledge of these levels also gives the technical forex trader a better sense of what levels to place their orders at. This process can reduce the chances of undesirable stop-loss orders being triggered and increase the chances of desirable take-profit limit orders being executed.
In practice, forex traders will often place their limit buy orders just before notable support points and their stop loss sell orders just below support points. Forex traders often place their limit sell orders just below resistance points and their stop-loss buy orders safely above resistance levels.
To illustrate a forex supply and demand trade, consider a situation where a major support level on an exchange rate chart has been tested several times without the market managing to fall through the support level from substantial demand there. Further declines to that level could present an opportunity to a savvy trader.
The trader looking to profit from this scenario could open a long position at or near that support level with the aim of profiting from yet another market bounce as demand from buyers prevents the rate from falling further. The trader might place a stop-loss order just below the support area to cut losses in the event the bounce turned into a downside breakout of that support.
In another example, a forex trader could establish a short position by selling a currency pair slightly below a resistance level where they know substantial supply exists. By selling just ahead of those sell orders situated around the resistance level, the trader could profit from a possible trend reversal originating from that chart point.
A stop-loss order to buy placed strategically above the resistance level would protect the position in case further demand from buyers eventually managed to overwhelm supply from sellers at that level.
Keeping aware of where support and resistance levels appear on the chart of a currency pair you have a position in can also help you optimize your exit point from an existing position since the odds of the market breaking through major support or resistance levels are significantly reduced. For example, you might elect to buy back a short position just before a support point or sell out a long position just before a resistance point.
You can also use support and resistance levels to choose better levels to cut your losses on losing trades. Rather than just stopping yourself out at a randomly-selected exchange rate, you can instead choose a rate that lies beyond a support or resistance point that demand or supply in the market will help protect for you. This process helps reduce the chances of your stop-loss orders being triggered.
While keeping an eye on support and resistance levels can help considerably with setting order levels and timing trades, remember that they are not 100% reliable and can definitely be breached by a determined directional market. When such a break occurs, the market then usually continues to move further in that same direction toward the next chart point of that type.
This phenomenon can offer yet another profitable opportunity for the observant trader who might trade along with the breakout once it occurs to profit from the anticipated subsequent move. Stops on such a trade will generally be placed on the other side of the broken chart point that switches in significance from resistance to support or vice versa once broken.
As an example, a trader might take a short position when the market declines below a key support level with a stop placed above that former support level that has turned into resistance. They could place their take-profit order just ahead of the next support level they observe on the chart.
Another well-known market phenomenon where trading occurs between a set of established support and resistance levels is known as a ranging market or trading range. Traders can profit from range trading strategies that involve buying near support and selling near resistance.
If a range breakout occurs, then they can trade in the direction of the breakout with a stop loss placed safely within the trading range aiming to take profits when the market has moved the distance from the top to the bottom of the range projected from the breakout point in the direction of the breakout.
Tips for Trading Supply and Demand
In practice, trading supply and demand successfully involves looking for chart points and understanding how the market will react to a test or breach of a chart point. The following tips for trading supply and demand focus on the characteristics of chart points that technical traders need to know about.
Tip #1: Chart Points Vary in Strength
One of the most important things to remember about support and resistance levels is that they can vary in degrees, so one chart point may not be equal in strength to others. Their strength depends on a number of factors, including how they were determined and the time interval of the chart they appear on. To help take this variability into account, support and resistance levels are sometimes further characterized as major and minor.
Tip #2: Chart Points Break
Chart points are useful in theory but definitely not inviolable in practice since they are subject to breakage. Minor support and resistance levels tend to only temporarily delay a prevailing exchange rate trend, while a breach of major support and resistance levels could signal the conclusion of a trend by prompting a market reversal.
Tip #3: More Tests Create Stronger Chart Points
The amount of market supply or demand piling up at support or resistance levels tends to increase the more times the market tests and bounces off of those levels. This situation can turn a minor support or resistance level into a major level over time if the market tests the level repeatedly without breaching it.
Tip #4: Observing a Chart Point Strengthens It
Market psychology often plays a role in steering market participants into buying or selling currency pairs at certain levels. After the majority of market participants take note of a certain support or resistance level, orders placed by technical forex traders tend to further reinforce the importance of that particular chart point.
Tip #5: Stronger Chart Points Have Stronger Breakout Moves
When the market breaks through a major support or resistance level, the subsequent move in the direction of the breakout generally tends to be more impactful than when a minor level is broken.
Do Supply and Demand Factors Affect the Foreign Exchange Market?
Forex traders who participate actively in the market should generally be aware of supply and demand factors in any currency pair they plan on trading. These factors create the major and minor support and resistance levels that provide a map of market buying and selling interest. You can use this map to navigate the foreign exchange market more successfully by trading strategically around these chart points.
Frequently Asked Questions
How do you find forex supply and demand?
You can find out where supply and demand exist in the forex market by identifying levels of support and resistance on exchange rate charts. Levels of support tend to show demand, while levels of resistance tend to show supply.
How do supply and demand affect forex?
Supply and demand affect a currency pair’s exchange rate by reducing or increasing its equilibrium level respectively. Thus, if a greater supply of a currency pair comes into the forex market, then its exchange rate will generally decline, while greater demand will tend to increase the exchange rate.
Is trading supply and demand a good strategy?
Having a keen awareness of supply and demand as shown by the support and resistance levels that appear on charts can definitely be helpful in improving results when actively trading any financial market.