Following gold's conspicuous correction in early April, the precious metal has marched steadily higher, with the latest tensions in the Middle East acting as a supporting catalyst. Subsequently, this backdrop may provide a tailwind for the mining sector, particularly for precious metal streaming management company Royal Gold Inc (NASDAQ:RGLD).
Fundamentally, headlines are zeroed in on Israel's military strike against Iran, with the escalating conflict sparking two major concerns. First, Iran is strategically positioned near the Strait of Hormuz, which is a vital route for global oil and liquefied natural gas shipments. Second and more critically, lawmakers — including Sen. Bernie Sanders (I-VT) — have expressed deep anxieties about the U.S. potentially being dragged into the conflict.
Given the seriousness of the matter, several sectors have attracted pragmatic (if not cynical) investment capital. Predictably, the precious metals ecosystem has been elevated as diplomatic solutions wane. Recently, benchmark exchange-traded funds, such as the iShares Gold Trust (NYSE:IAU) and SPDR Gold Shares ETF (NYSE:GLD) have witnessed modest but consistent inflows.
In fairness, as other publications have noted, RGLD stock isn't exactly the gold industry's standard bearer. At this moment, the consensus analyst rating for Royal Gold is 2.5, which is in Sell territory. In contrast, streaming competitor Wheaton Precious Metals Corp (NYSE:WPM) carries a 3.0 rating or Hold, while mining powerhouse Newmont Corp (NYSE:NEM) is slightly better with a 3.2 rating.
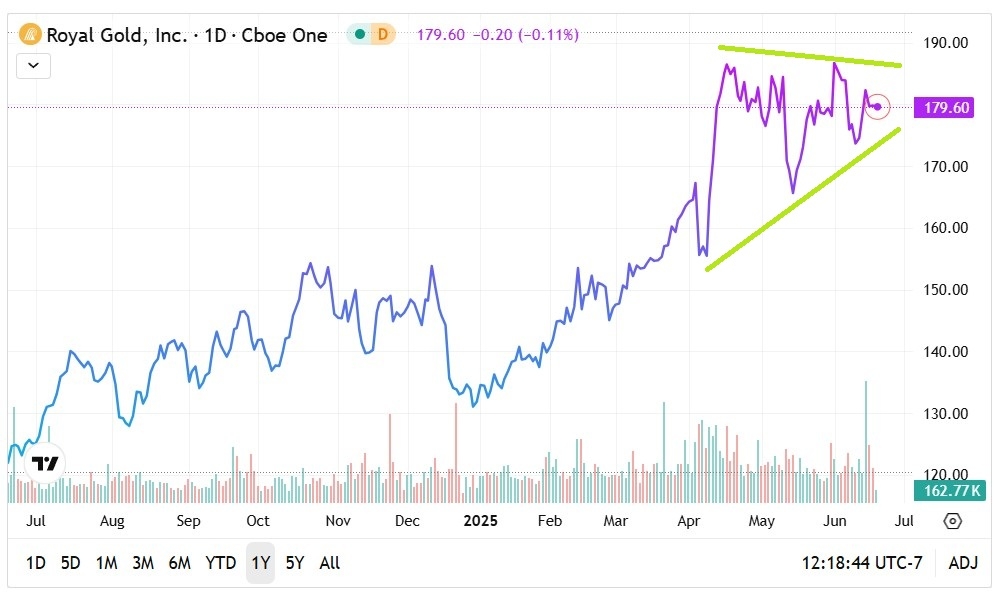
Nevertheless, RGLD stock appears to provide a more "readable" signal. From a more heuristic perspective, technical analysts will likely argue that RGLD is currently charting a bullish pennant formation. In April, the security popped higher but has since entered a consolidation phase of generally lower highs.
Still, RGLD stock has also been charting higher lows, which lends credence to the idea that it could eventually break out of this consolidation zone. Contrast that with WPM or NEM, where the respective charts arguably lack a discernible pattern.
Using Statistics To Frame The Opportunity In RGLD Stock
Although RGLD stock enjoys both a fundamental and technical justification for bullishness, both these methodologies lack specificity. From an investor's point of view, the typical timeframe — usually a year or longer — provides the underlying thesis with considerable flexibility to pan out as forecasted. Unfortunately, traders (especially options traders) don't have that luxury.
It comes down to structure. Since options have an expiration date, a thesis has to materialize accurately in terms of magnitude (y-axis) and time (x-axis). To be sure, what raises the stakes is that when an options strategy goes sour, the entire principal — or worse if selling naked calls and puts — is at risk.
Still, the tremendous leverage that options provide consistently attracts market participants. For these folks, the decision to trade comes down to probabilities. However, in order to calculate probabilities that are relevant — the conditional variety — the language within the target dataset must be unified.
In that sense, both the fundamental and technical approaches suffer from the same dilemma: non-stationarity of the core measurement metric. For example, share prices frequently change over time, as do valuation ratios such as price to earnings. In order to conduct sensible statistical analysis, one must impose stationarity on the dataset. Converting price action into market breadth, which simply tracks accumulative and distributive sessions, is one viable solution.
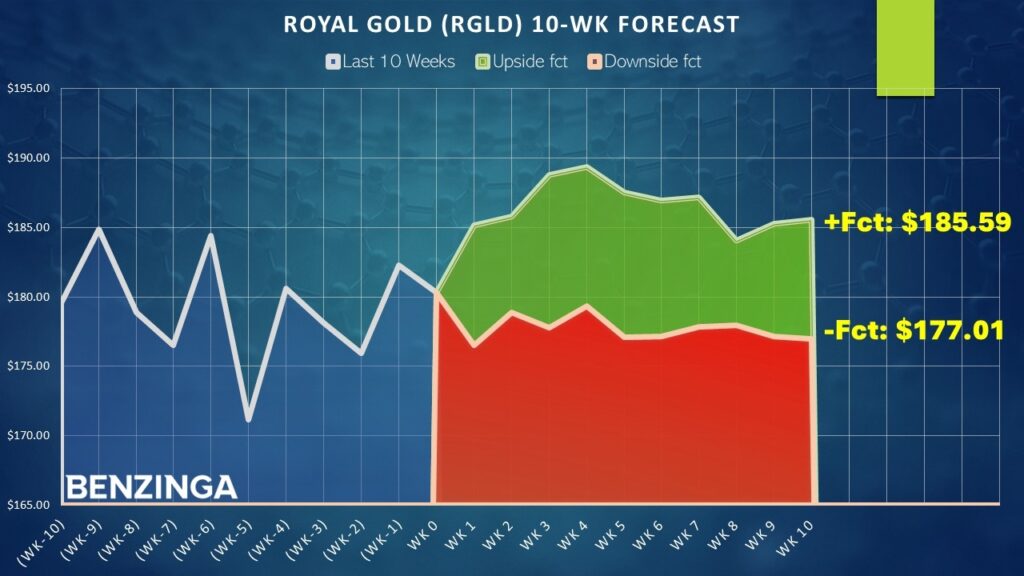
Under this framework, RGLD stock is on course toward printing a "4-6-U" sequence by this Friday: four up weeks, six down weeks, with a net positive trajectory across the 10-week period. A rare event, this sequence has only materialized 25 times in the trailing decade. Notably, in 72% of cases, the following week's price action results in upside, with a median return of 2.7%.
Should the implications of the 4-6-U pan out as projected, RGLD stock could breach $185 in short order, perhaps in a week or two. If the bulls maintain control of the market, a push toward the $190 level wouldn't be unreasonable, especially with the fundamental backdrop acting as a supporting element.
Aggressive Call Spreads For The Bullish Trader
Based on the market intelligence above, arguably the most aggressive but realistic trade is to buy the 180/185 bull call spread expiring July 18. This transaction involves buying the $180 call and simultaneously selling the $185 call, for a net debit paid of 280. Should RGLD stock rise through the short strike price ($185) at expiration, the maximum reward is $220, a payout of roughly 79%.
Those who want to take a little more risk may consider the 180/190 bull spread, also expiring July 18. This transaction involves a higher net debit paid of $445. However, the max reward stands at $555, translating to a payout of almost 125%.
In both trades, the appeal centers on the implied shift in sentiment regime. As a baseline, the chance that a long position in RGLD stock is profitable over any given week is only 52.29%. Therefore, the 4-6-U sequence statistically provides "free odds" for the bullish speculator.
To be 100% clear, this doesn't guarantee a positive outcome. Rather, for those who are already willing to take a risk in the options market, the use of conditional probabilities helps traders separate the wheat from the chaff empirically.
The opinions and views expressed in this content are those of the individual author and do not necessarily reflect the views of Benzinga. Benzinga is not responsible for the accuracy or reliability of any information provided herein. This content is for informational purposes only and should not be misconstrued as investment advice or a recommendation to buy or sell any security. Readers are asked not to rely on the opinions or information herein, and encouraged to do their own due diligence before making investing decisions.
Read Next:
Photo: Shutterstock
© 2026 Benzinga.com. Benzinga does not provide investment advice. All rights reserved.
To add Benzinga News as your preferred source on Google, click here.