The period of low volatile is a post Flash-Boys period where traders have seen trading volumes and volatility disappear to the dark pools is about come to end. Macro events drive big money. The end of QE and the expectation of a US FED rate hike in H1 2015 will have that big money moving well before the rest of the retail and small investor capital.
The end of summer and the period before fall here in the north east is typically when volatility has manifested itself since Reg-NMS introduced a steeply skewed playing field that caters to an industry who's profits are driven through volatility.
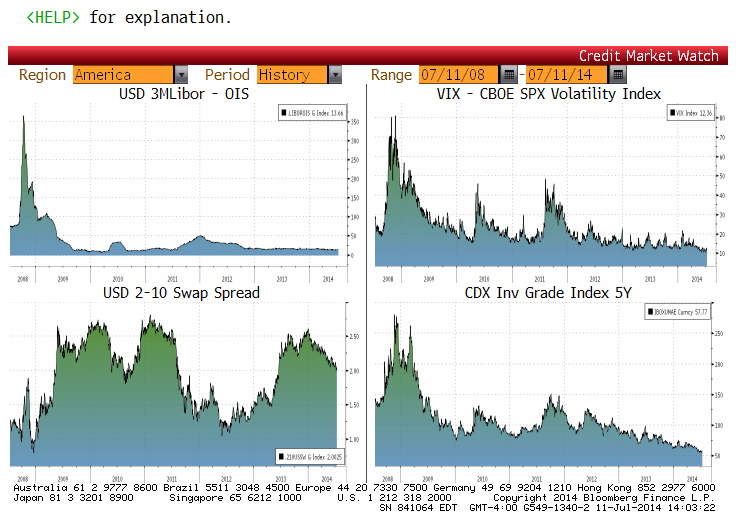
Data From July 11, 2008 Through Today
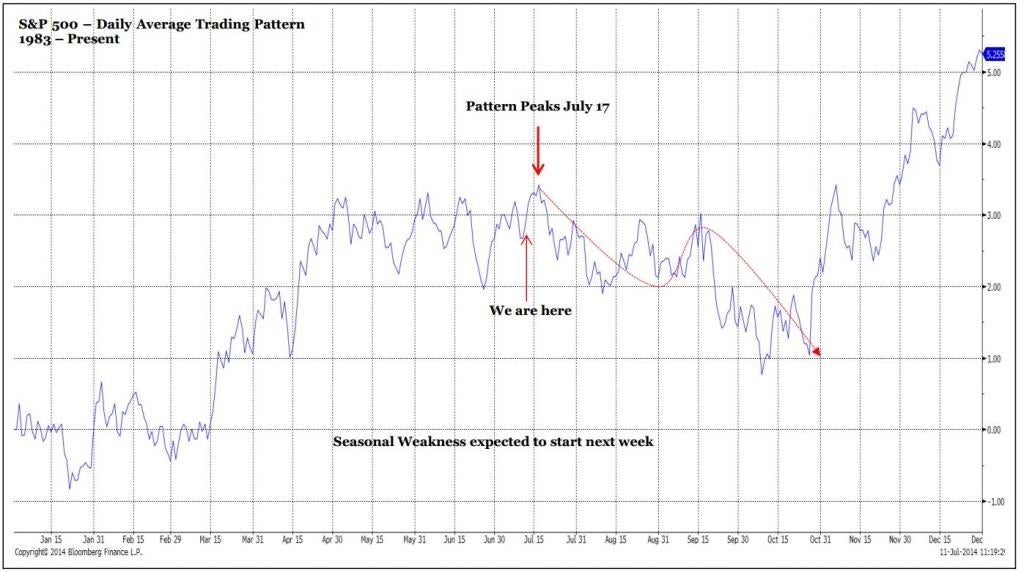
Viewed in another way, according to FBN Securities analyst JC O'Hara, we are on the cusp of a seasonally volatilie period. Benzinga spoke with Mr. O'Hara who said "it's a report with little words and two pictures designed to say more than language can". As worry reenters the marketplace and hubris dissipates, volumes in the dark pools is now expected to return to the lit markets and with that comes an ample amount of volatility.
FBN Securties Technical Anlaysis Report (Bloomberg Seasonality Chart Of S&P 500 From 1983 To Present)
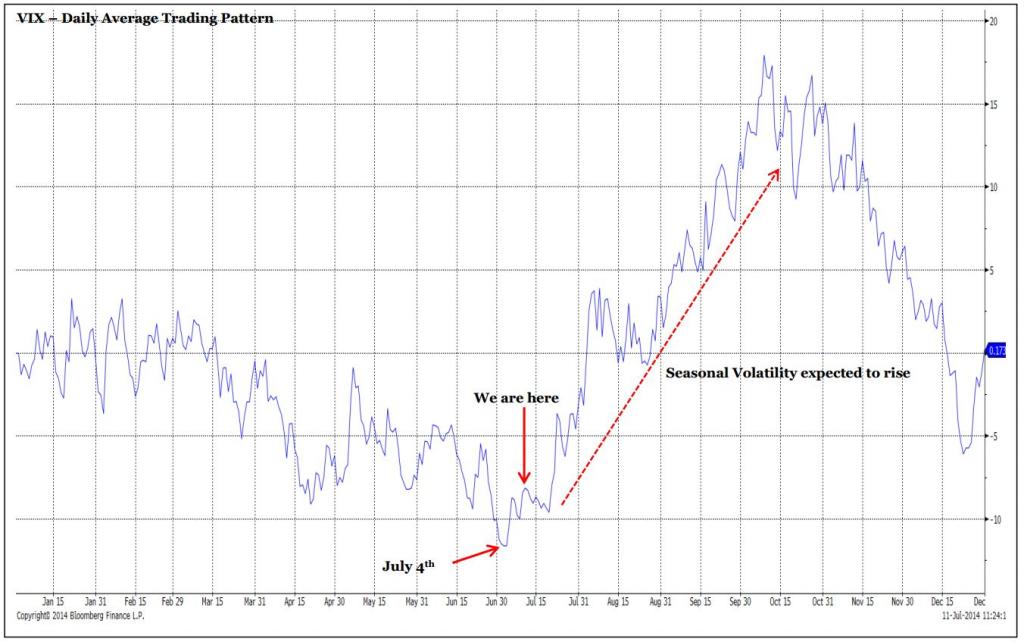
FBN Securties Technical Anlaysis Report (Bloomberg Seasonality Chart Of CBOE VIX Volatility Index From 1983 To Present)
Is it any wonder that Goldman Sachs GS is "still stuck" or that equity valuations are being driven by metrics, not earnings?
© 2024 Benzinga.com. Benzinga does not provide investment advice. All rights reserved.
Comments
date | ticker | name | Price Target | Upside/Downside | Recommendation | Firm |
|---|
Trade confidently with insights and alerts from analyst ratings, free reports and breaking news that affects the stocks you care about.

