Currency valuations depend on a slew of different economic factors and variables from two countries that issue the national currencies that make up each currency pair. This complexity can make performing fundamental analysis on the currency pairs traded in the forex market overwhelming for some people.
To simplify the process of forecasting exchange rates, supply and demand indicators have long been computed by technical analysts and traders in the foreign exchange market to help them numerically assess the forex demand and supply situation. They might also perform a visual review of charts to determine the location of supply and demand zones that typically show up as broad resistance and support regions respectively.
If you are interested in learning more about what a demand or supply zone is and how to get started with supply and demand zones trading as a forex trader, then read on.

What Are Supply and Demand Zones?
Supply and demand zones are where a market pauses before reversing. These zones form when the direction of a currency pair’s exchange rate reverses within them.
A supply zone occurs when a currency pair’s exchange rate moves up to a level and then meets resistance that causes it to either reverse to the downside or consolidate. The more downside reversals that occur within a particular supply zone, the stronger the resistance that zone offers to future exchange rate rises.
In contrast, a demand zone occurs when a currency pair’s exchange rate falls to a level where it meets substantial support and then either reverses higher or consolidates. The more upside reversals that occur within a particular demand zone, the stronger the support that zone offers to future exchange rate declines.
Orders to buy or accumulate a currency pair tend to gather near support or demand levels, while orders to sell or distribute tend to collect near resistance or supply levels. When the market eventually gathers enough momentum to break through these sticky zones of stockpiled orders, stop-loss activity tends to make the market show substantial follow-on movement that accelerates the trend even further.
Such strong follow-on moves when a supply or demand zone breaks tend to be characterized by unusually long candlestick bodies. The resulting long candles are known as Extended Range Candles (ERCs).
Main Types of Forex Supply and Demand Zones
Trends tend to occur in phases. A number of accumulation, support or demand zones can show up during an upwards trend. Likewise, various distribution, resistance or supply zones can appear during downtrends.
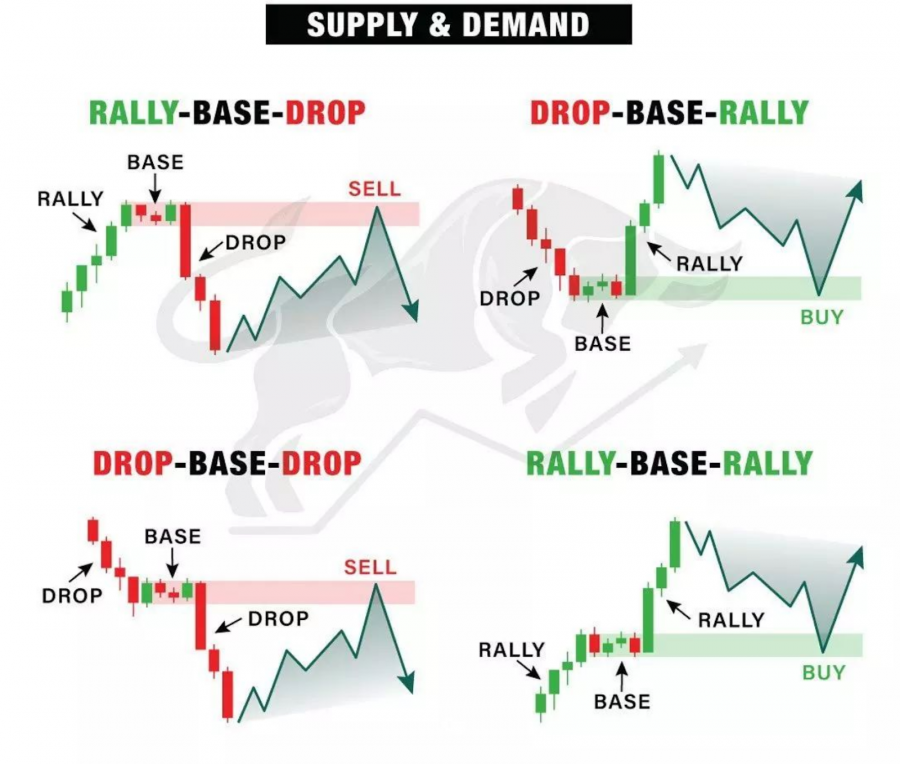
This tendency results in several repeatable supply and demand continuation and reversal patterns that forex traders interested in supply and demand zones can learn to identify for their useful predictive value. These supply and demand zone patterns are summarized in the following image.
The appearance of these supply and demand zone patterns can alert astute traders about cases where large institutional traders, corporations and market makers show interest or place their orders.
Continuation Patterns
When a continuation pattern shows up, it suggests that the market will continue in its previous direction after the pattern plays out. Upward-trending markets tend to go through several phases of accumulation while declining markets usually experience several distribution phases.
As the previous image suggests, supply and demand traders typically use two main kinds of continuation patterns.
- Rally-Base-Rally (RBR): The first type is a bullish continuation pattern known as the Rally-Base-Rally (RBR) pattern. This pattern forms after a rally starts to consolidate to form a base. The market then rallies once again after the consolidation phase ends.
- Drop-Base-Drop (DBD): The second type is a bearish continuation pattern known as the Drop-Base-Drop (DBD) pattern. This pattern forms once a market decline starts to consolidate to create a base. The market then starts falling yet again when the consolidation phase ends.
Reversal Patterns
The appearance of a reversal pattern generally indicates that the market will change its previous direction once the pattern concludes. As the above image shows, two key types of reversal patterns are widely used by supply and demand zone traders.
- Drop-Base-Rally (DBR): The first is the Drop-Base-Rally (DBR) pattern, which is a bullish reversal pattern where a declining market falls to a demand zone, forms a base then rises off of it to change the market’s overall direction to the upside.
- Rally-Base-Drop (RBD): The second type is the Rally-Base-Drop (RBD) pattern, which is a bearish reversal pattern in which the market trends higher up to a supply zone, consolidates briefly near that high area and then falls from that region to reverse the rally to the downside.
Identifying Supply and Demand Zones on Forex Charts
To start identifying supply and demand zones on exchange rate charts, you will probably want to follow a set of steps like those listed below that are specifically for use with candlestick charts. This analysis will give you a map of the active supply and demand zone for a particular currency pair that you can then use while forex trading.
Step 1: Identify the Current Exchange Rate
You first need to know where the market is at. Gaining this knowledge involves observing where the currency pair’s exchange rate is presently trading. You can also note in which direction the market moved to get where it presently trades.
Step 2: Find Extended Range Candles (ERCs)
You next need to look to the left on the candlestick chart to find red (down) or green (up) candles with an unusually long body. These explosive price moves or ERCs can be either red or green candles. Such ERCs usually suggest a strong and significant breakout and a sharp move away from a supply or demand zone.
ERCs should also have little to no wicks, so if a candle has an equal wick and body size, then it is not an ERC. These big candles display notable directional exchange rate movements that reflect a significant market imbalance.
Step 3: Pinpoint the Move’s Origin Point
Observe the starting level of the ERC that begins the move you wish to analyze. This marks the move’s origin point.
Step 4: Mark a Horizontal Zone Starting From the Origin Point
Mark what seems to be a reasonable consolidative horizontal trading zone of 10 candles or less starting at the move’s origin point and including whatever minor market reactions occur from that point before the subsequent larger move occurs.
For example, this consolidation zone might include a small series of candles moving sideways in a tight-ranging pattern above a key support point.
Keep in mind that if the origin point begins an upwards trend, then the base of the price zone should be drawn with a flat line through the low point where the move originated. If the point of origin starts a decline, then the top of the zone should be drawn horizontally through that origin level.
Best Supply and Demand Zone Indicators
Several technical concepts can help you better identify pertinent supply and demand zones when you are forex trading. These include:
- Support and resistance levels: Although they are not quite the same, finding key support and resistance levels on an exchange rate chart will often help you identify supply and demand zones. A support level appears at a candlestick’s low point when it is surrounded by at least two candlesticks that have higher lows on both sides. A resistance level occurs at a candlestick’s high point that has a minimum of two candlesticks with lesser highs on each side. Resistance levels suggest supply exists at those exchange rates, while support levels indicate that demand exists at those points. Supply and demand zones are usually drawn near resistance and support levels respectively. Candlestick patterns are a great tool for identifying price movement.
- Fibonacci levels: Because of the popularity of their use among technical analysts, the existence of major Fibonacci retracement levels like the 23.6%, 38.2% and 61.8% levels and projection levels such as the 161.8%, 200% and 261.8% levels can cause supply and demand zones to appear in their vicinity. Fibonacci levels can thus be used to roughly predict where future supply and demand zones might arise.
- Pivot points: Pivot points are popular indicators used by technical analysts that are calculated from the previous trading day’s high, low and closing exchange rates. Since retial traders often use pivot points to suggest where support, resistance and market reversals may occur, they can have a certain amount of predictive value when looking for potential supply and demand zones.
Finding Trading Opportunities with Supply and Demand Zones
Going through the process of determining supply and demand zones for a currency pair you are trading will probably yield the best results for short-term forex traders like day traders. With that noted, even long-term trend traders and swing traders can use these zones to help them better time and determine their trade entry and exit points.
For example, most traders can use supply and demand zone analysis to inform them of better take-profit and stop-loss levels. They can put their take-profit orders ahead of a zone so that they can avoid giving back their profits once that zone’s orders are filled. When setting stop-loss levels, you will probably want to set your stop order beyond nearby zones to prevent being the unwitting target of market squeezes and stop-running actions.
Frequently Asked Questions
Which timeframe is best for supply and demand?
Since supply and demand zones are typically used by day traders, an intraday timeframe should be the best to use.
Is demand high when supply is low?
If price remains constant, then supply tends to decrease when demand at that particular price rises. If the price is allowed to rise, then it typically will do so when demand is high and supply low.
Is supply and demand a good strategy?
Looking for supply and demand zones can be a good element to include in your trading strategy. This will depend on your trading time horizon, however, since supply and demand trading tends to show better results for day traders than for longer-term traders.