Want to jump straight to how to use technical analysis in crypto trading? TradingView is the leading charting tool with all the indicators and drawing tools you need to trade crypto with technical analysis.
Trading assets and markets can be extremely difficult. Whether you are day trading, swing trading or scalping, it makes no difference. According to various studies, 70% to 97% of traders lose money over time. Given this, any advantage that traders can obtain will increase their chances of success.
A trading edge can be a strategy, technology, risk management, technical analysis or anything else that helps someone succeed. A trader may occasionally win trades without an edge but will struggle to win consistently.
Understanding technical analysis is a critical advantage that traders can gain. Although far from perfect, technical analysis can give traders a more complete picture of an asset or market.
What is Technical Analysis in Crypto Trading?
Technical analysis, among other things, examines asset prices, volume, support/resistance levels and chart patterns to determine whether an asset is bullish or bearish. Technical analysis is also used to identify potential reversal levels and to help develop a trading strategy.
A typical blunder made by new traders is failing to develop a trading plan before entering a trade. A good trading plan should include, at a minimum, the following based on technical analysis:
- Entry price
- Position size
- Take-profit target and strategy: Will you close the entire trade or scale out?
- Risk management: How much you are willing to risk on the trade = stop loss location
Capital protection through risk management is critical for all traders, especially new ones. It's also crucial to stick to your plan once you've entered a trade; don't let your emotions cause you to change your plan.
Traders will also use technical indicators to aid in their analysis. There appears to be an endless list, but here are a few of the most popular.
- Relative Strength Index (RSI)
- Moving Average Convergence Divergence (MACD) Indicator
- Stochastic Oscillator
- Accumulation/Distribution line (A/D line)
- Moving Averages
Technical analysis can be performed in all time frames. The time frame you use will depend on your trading type.
Best Crypto Technical Analysis Trading Signals
Traders can use a variety of trading signals to identify potential trade opportunities. Some are price patterns that develop over time, while technical indicators generate others. Here are a few examples of common trading signals.
Death Cross
A death cross occurs when a short-term moving average crosses below a long-term moving average, signaling recent price weakness. This signal is usually the 50-day moving average falling below the 200-day moving average. The death cross is not 100% accurate because moving averages are lagging indicators that reveal an asset's past performance.

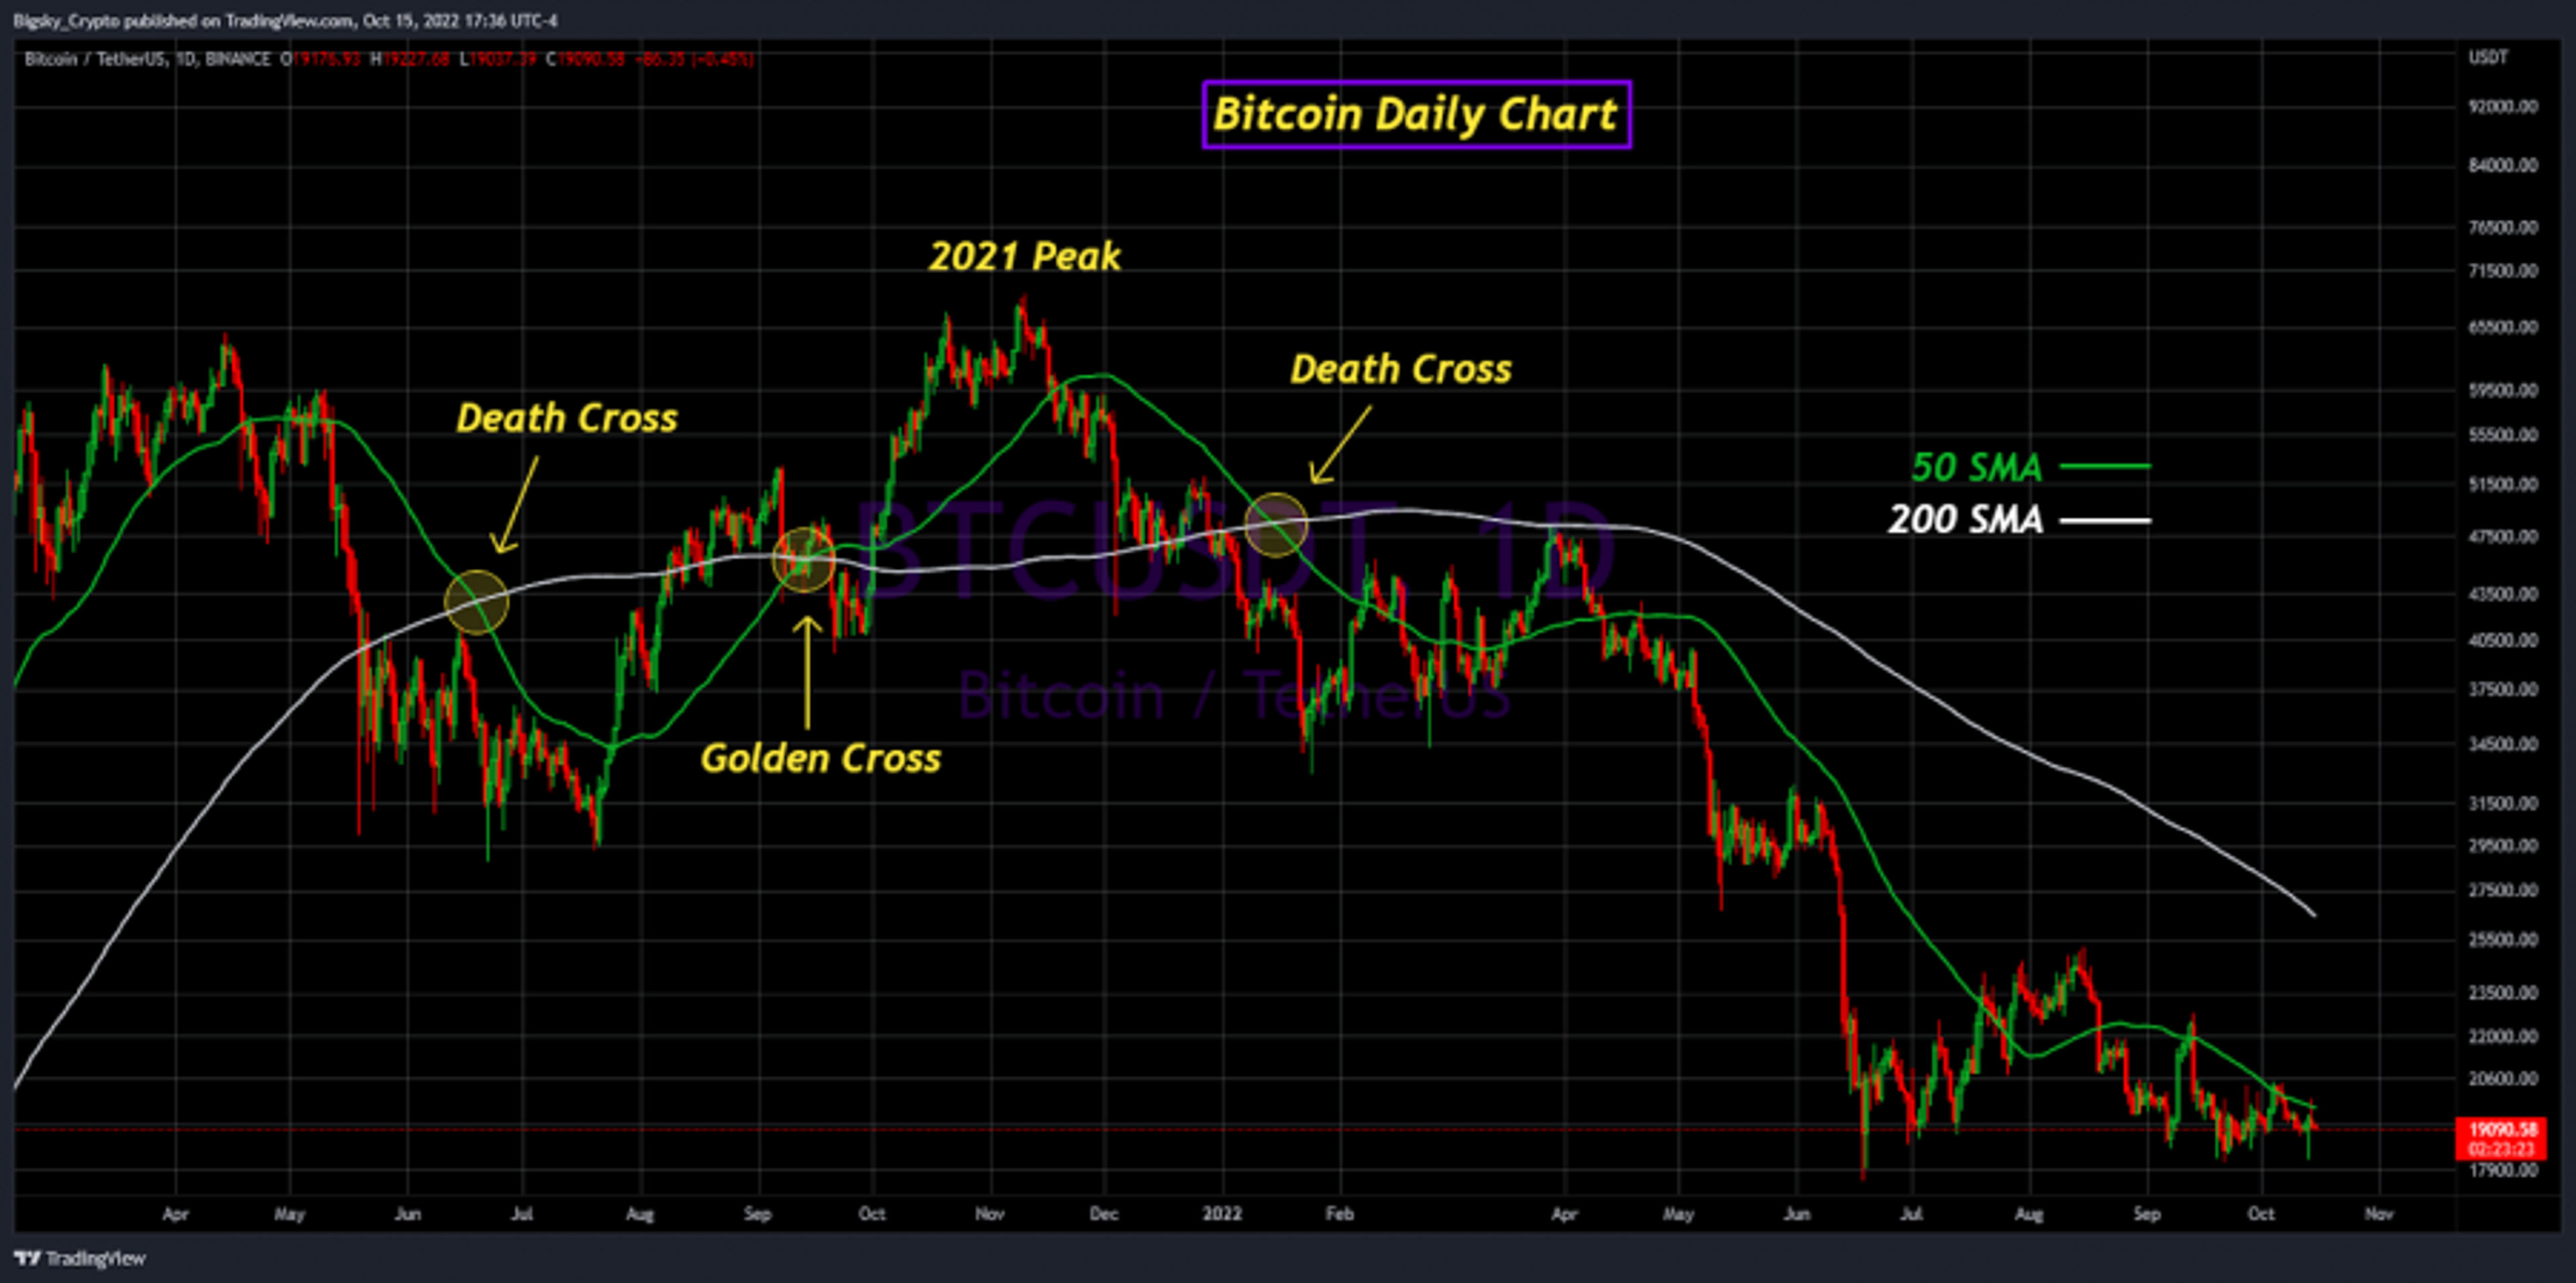
The golden cross, which indicates recent price strength, is the inverse of a death cross. A golden cross is formed when the short-term (50-day) moving average crosses over the long-term (200-day) moving average.
Head and Shoulders

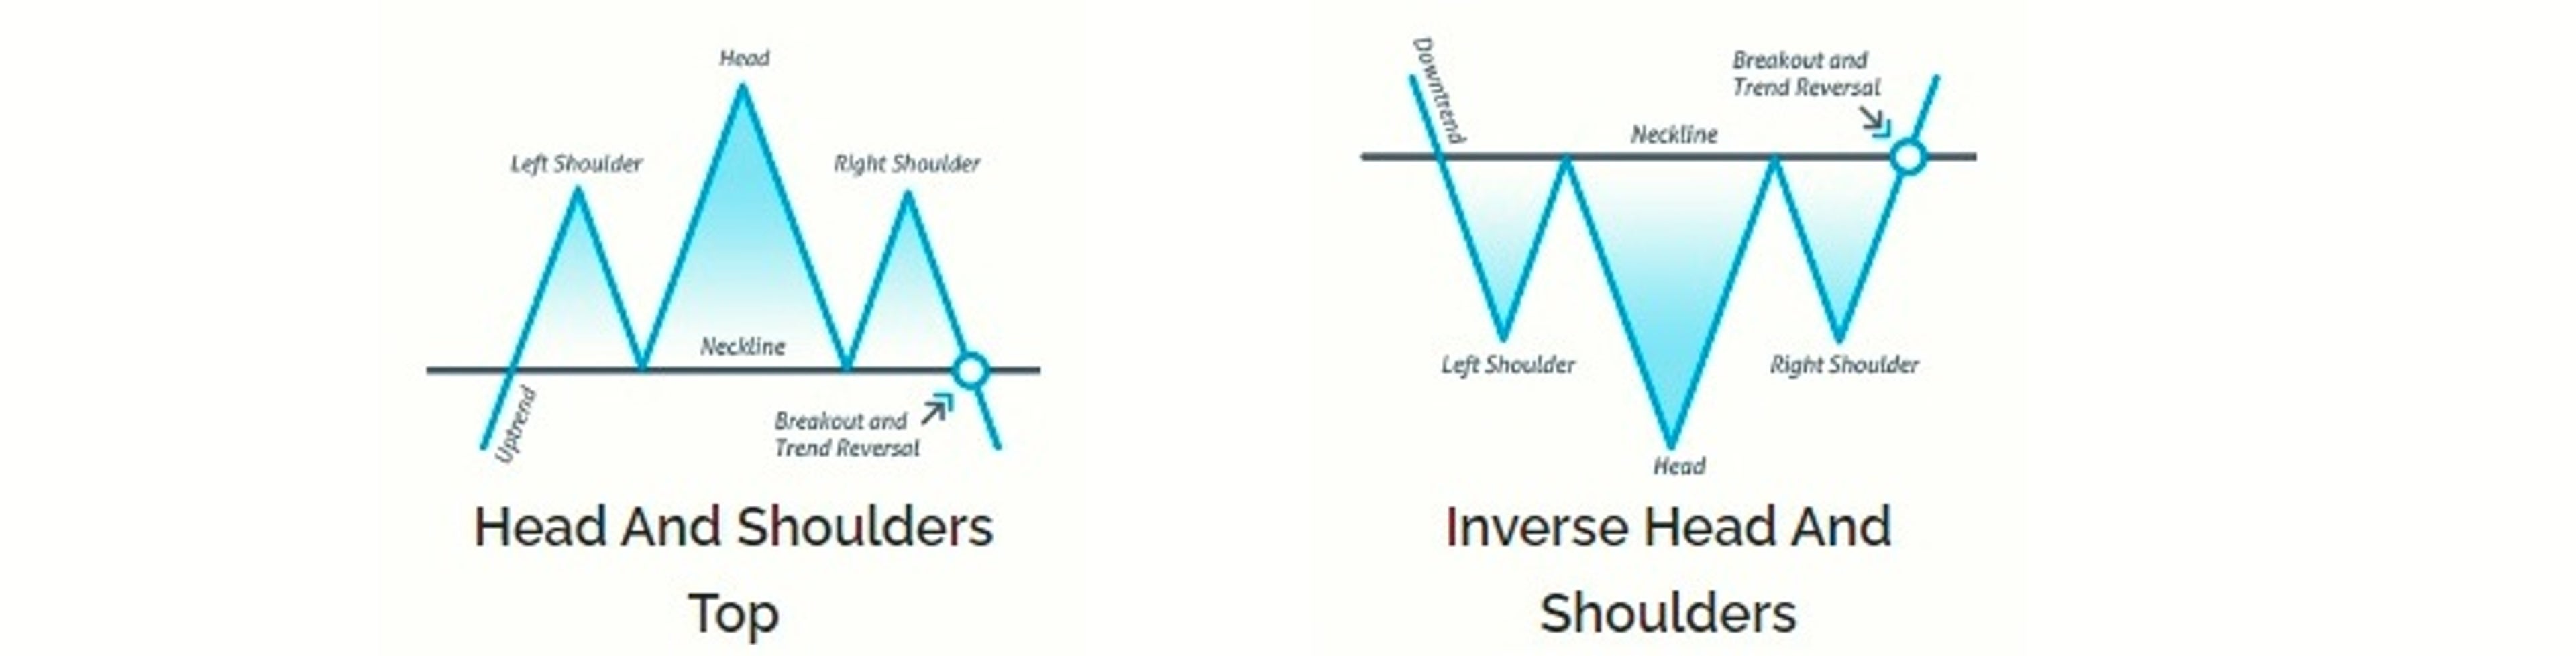
The Head and Shoulders pattern is a topping pattern that indicates a potential trend reversal. It is a price formation with three peaks and a baseline, with the outside two peaks being close in height and the middle peak being the tallest.
The pattern has a right shoulder, a head, a left shoulder and a neckline. Traders who spot a Head and Shoulders pattern typically wait until the price breaks through the neckline before entering a short trade.
An inverse Head and Shoulders pattern forms at bottoms, signaling a possible trend reversal.
Triangles (Ascending, Descending and Symmetrical)

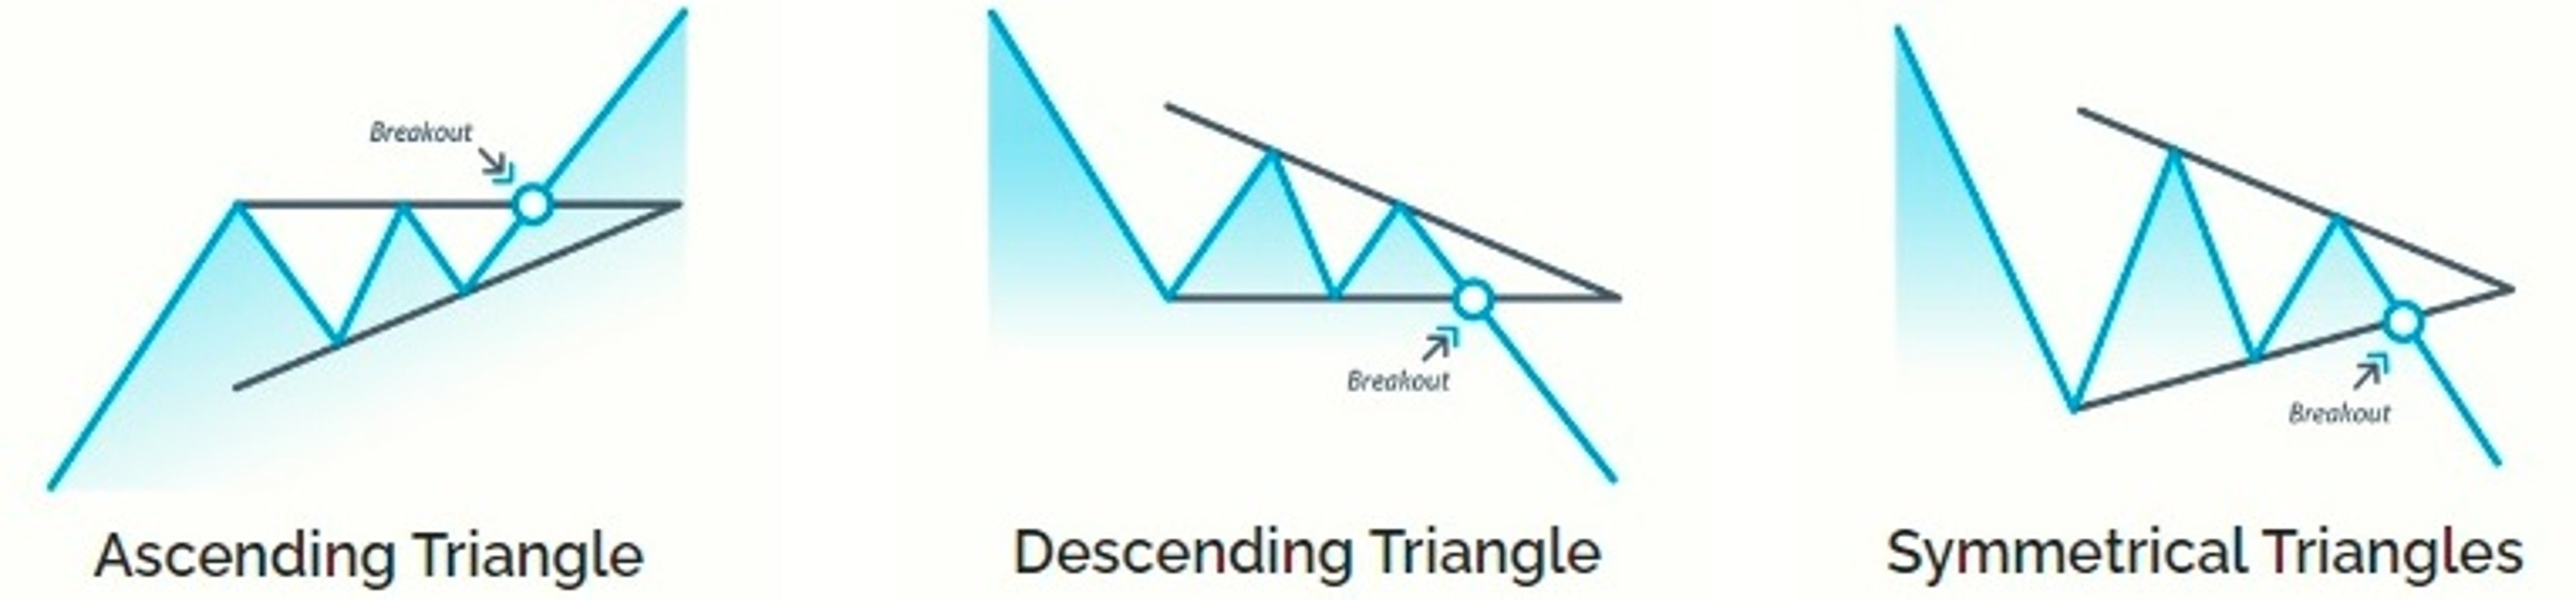
Triangles are another typical chart pattern, particularly in Bitcoin. Triangle patterns are made up of two trendlines that meet at a point. Triangle patterns are classified as ascending, descending and symmetrical.
The ascending triangle is a bullish formation that appears as a continuation pattern during an uptrend. Sometimes, they will form during a downtrend and act as a reversal pattern.
Ascending triangles have a top trendline that is relatively flat and represents overhead resistance. The lower trendline forms an upward slope as the price makes higher lows. Volatility decreases as the price approaches the apex of the triangle formation. To enter a long trade, traders will look for a breakout above the overhead resistance.
A descending triangle is a bearish pattern that is the inverse of an ascending triangle. Descending triangles have a relatively flat lower trendline that serves as a level of support. As the pattern unfolds, the upper trendline indicates progressively lower resistance forming a downslope. Before entering a short trade, traders look for a breakdown below the lower trendline.
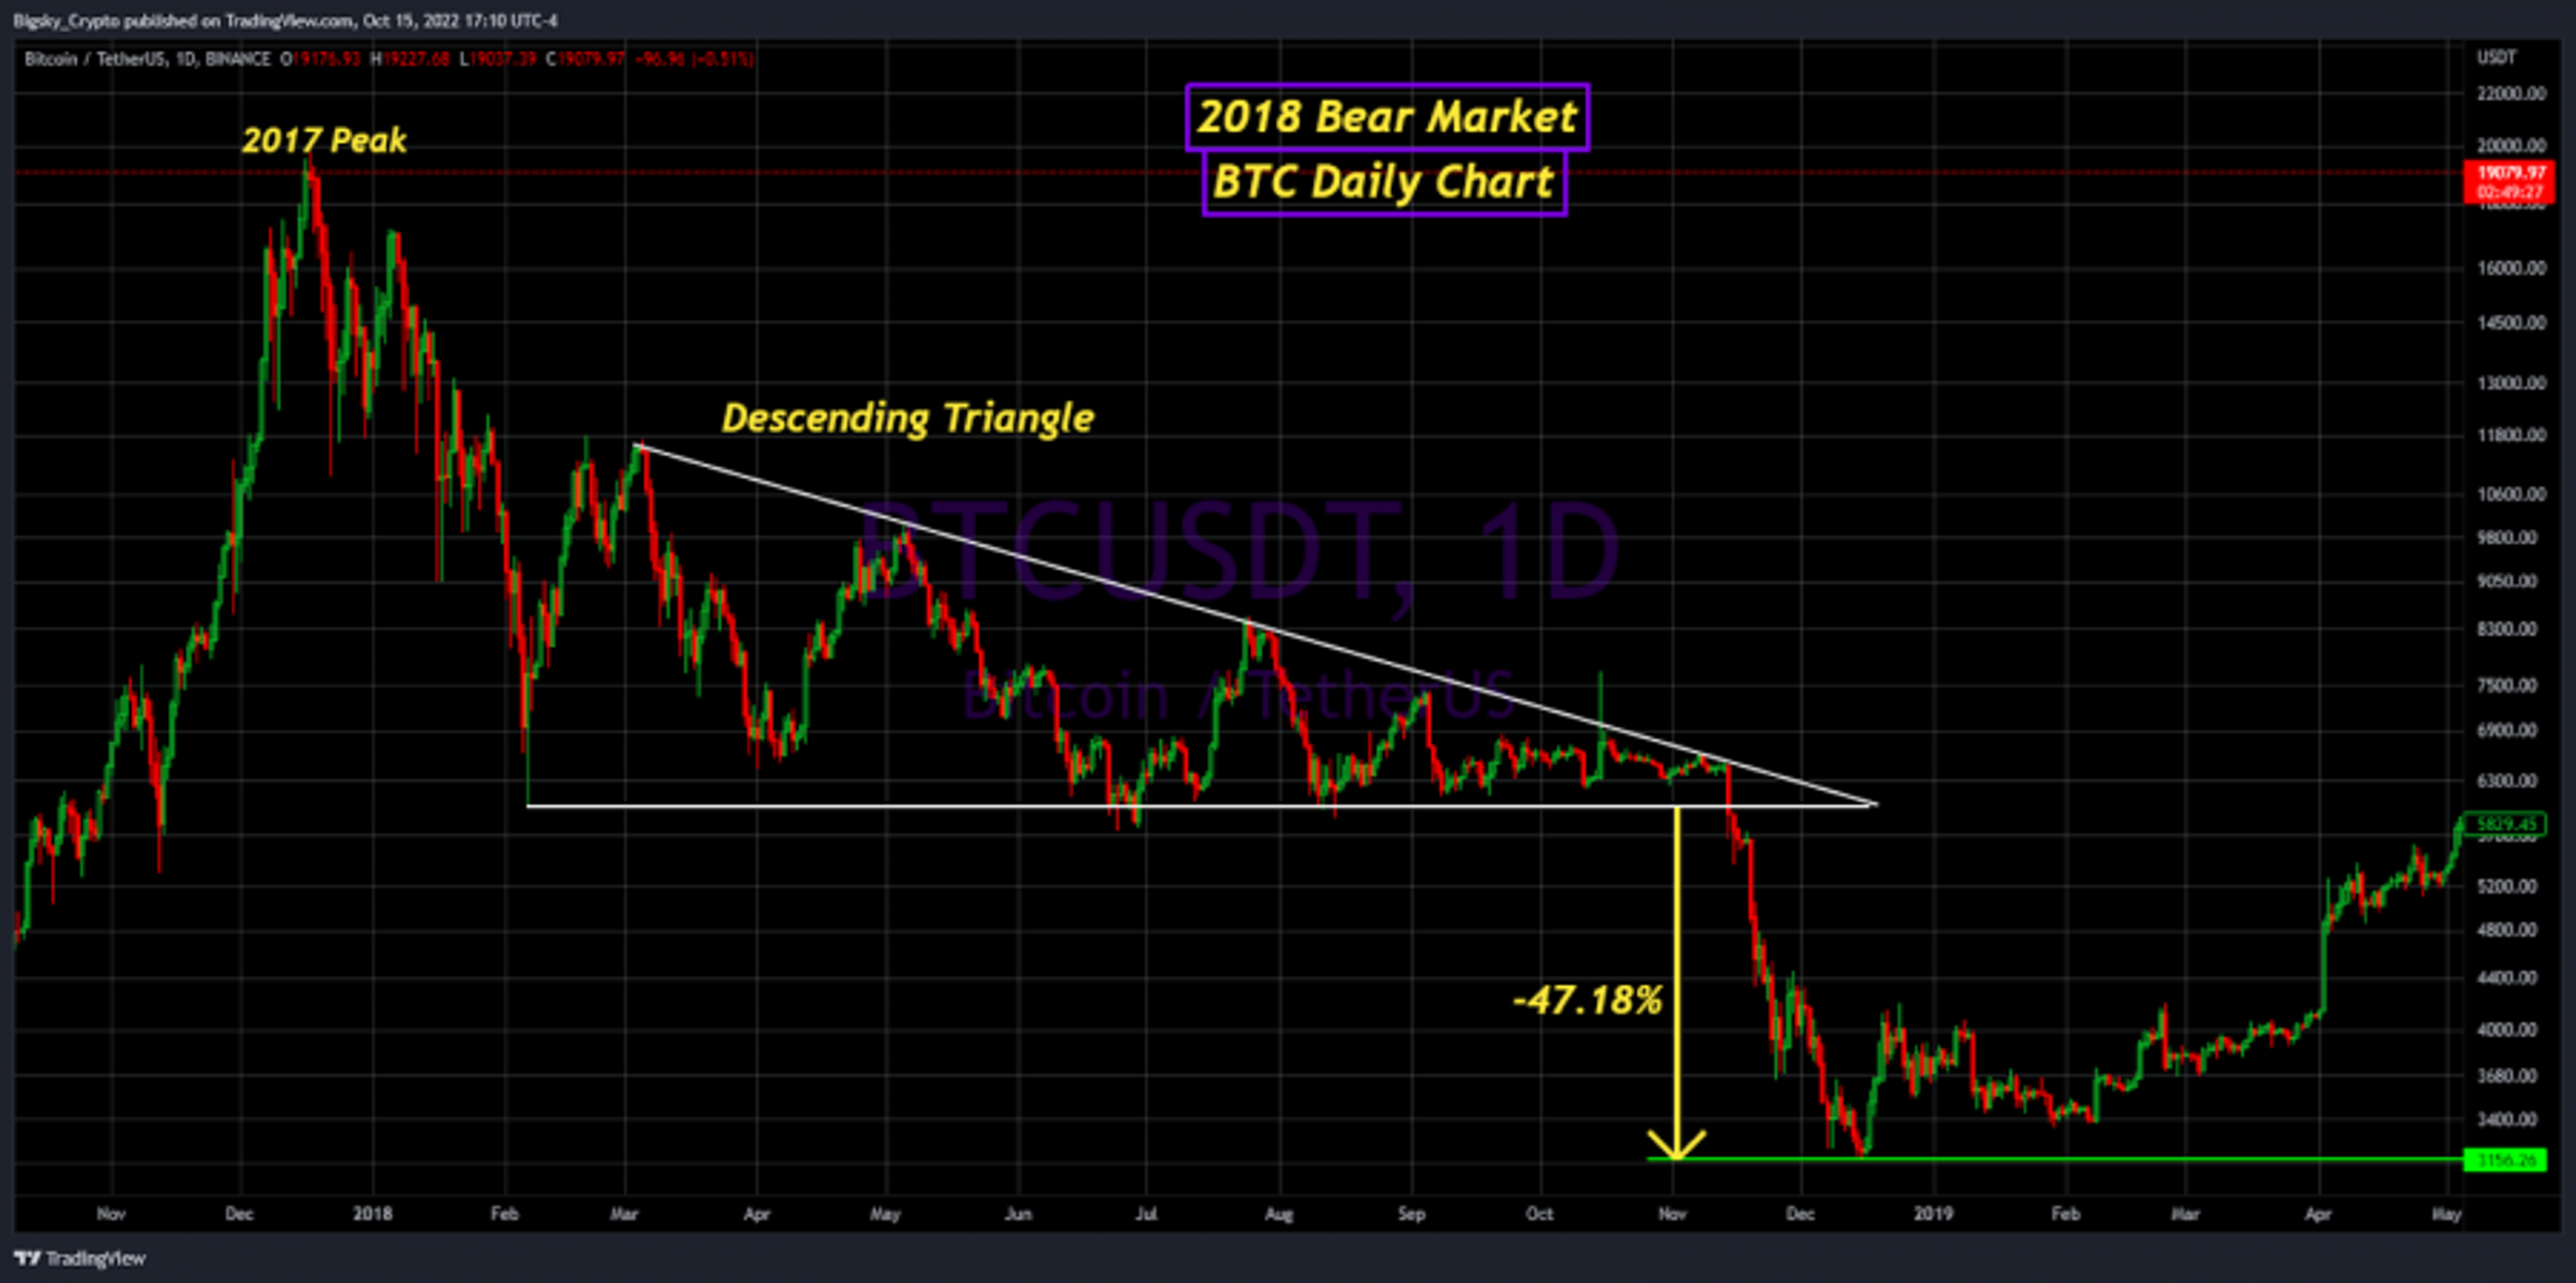
The chart above shows Bitcoin's huge descending triangle during the 2018 bear market.
Symmetrical triangles form with two converging trendlines; they indicate market indecision and are considered continuation patterns. Usually, a breakout will occur in the market's general direction.
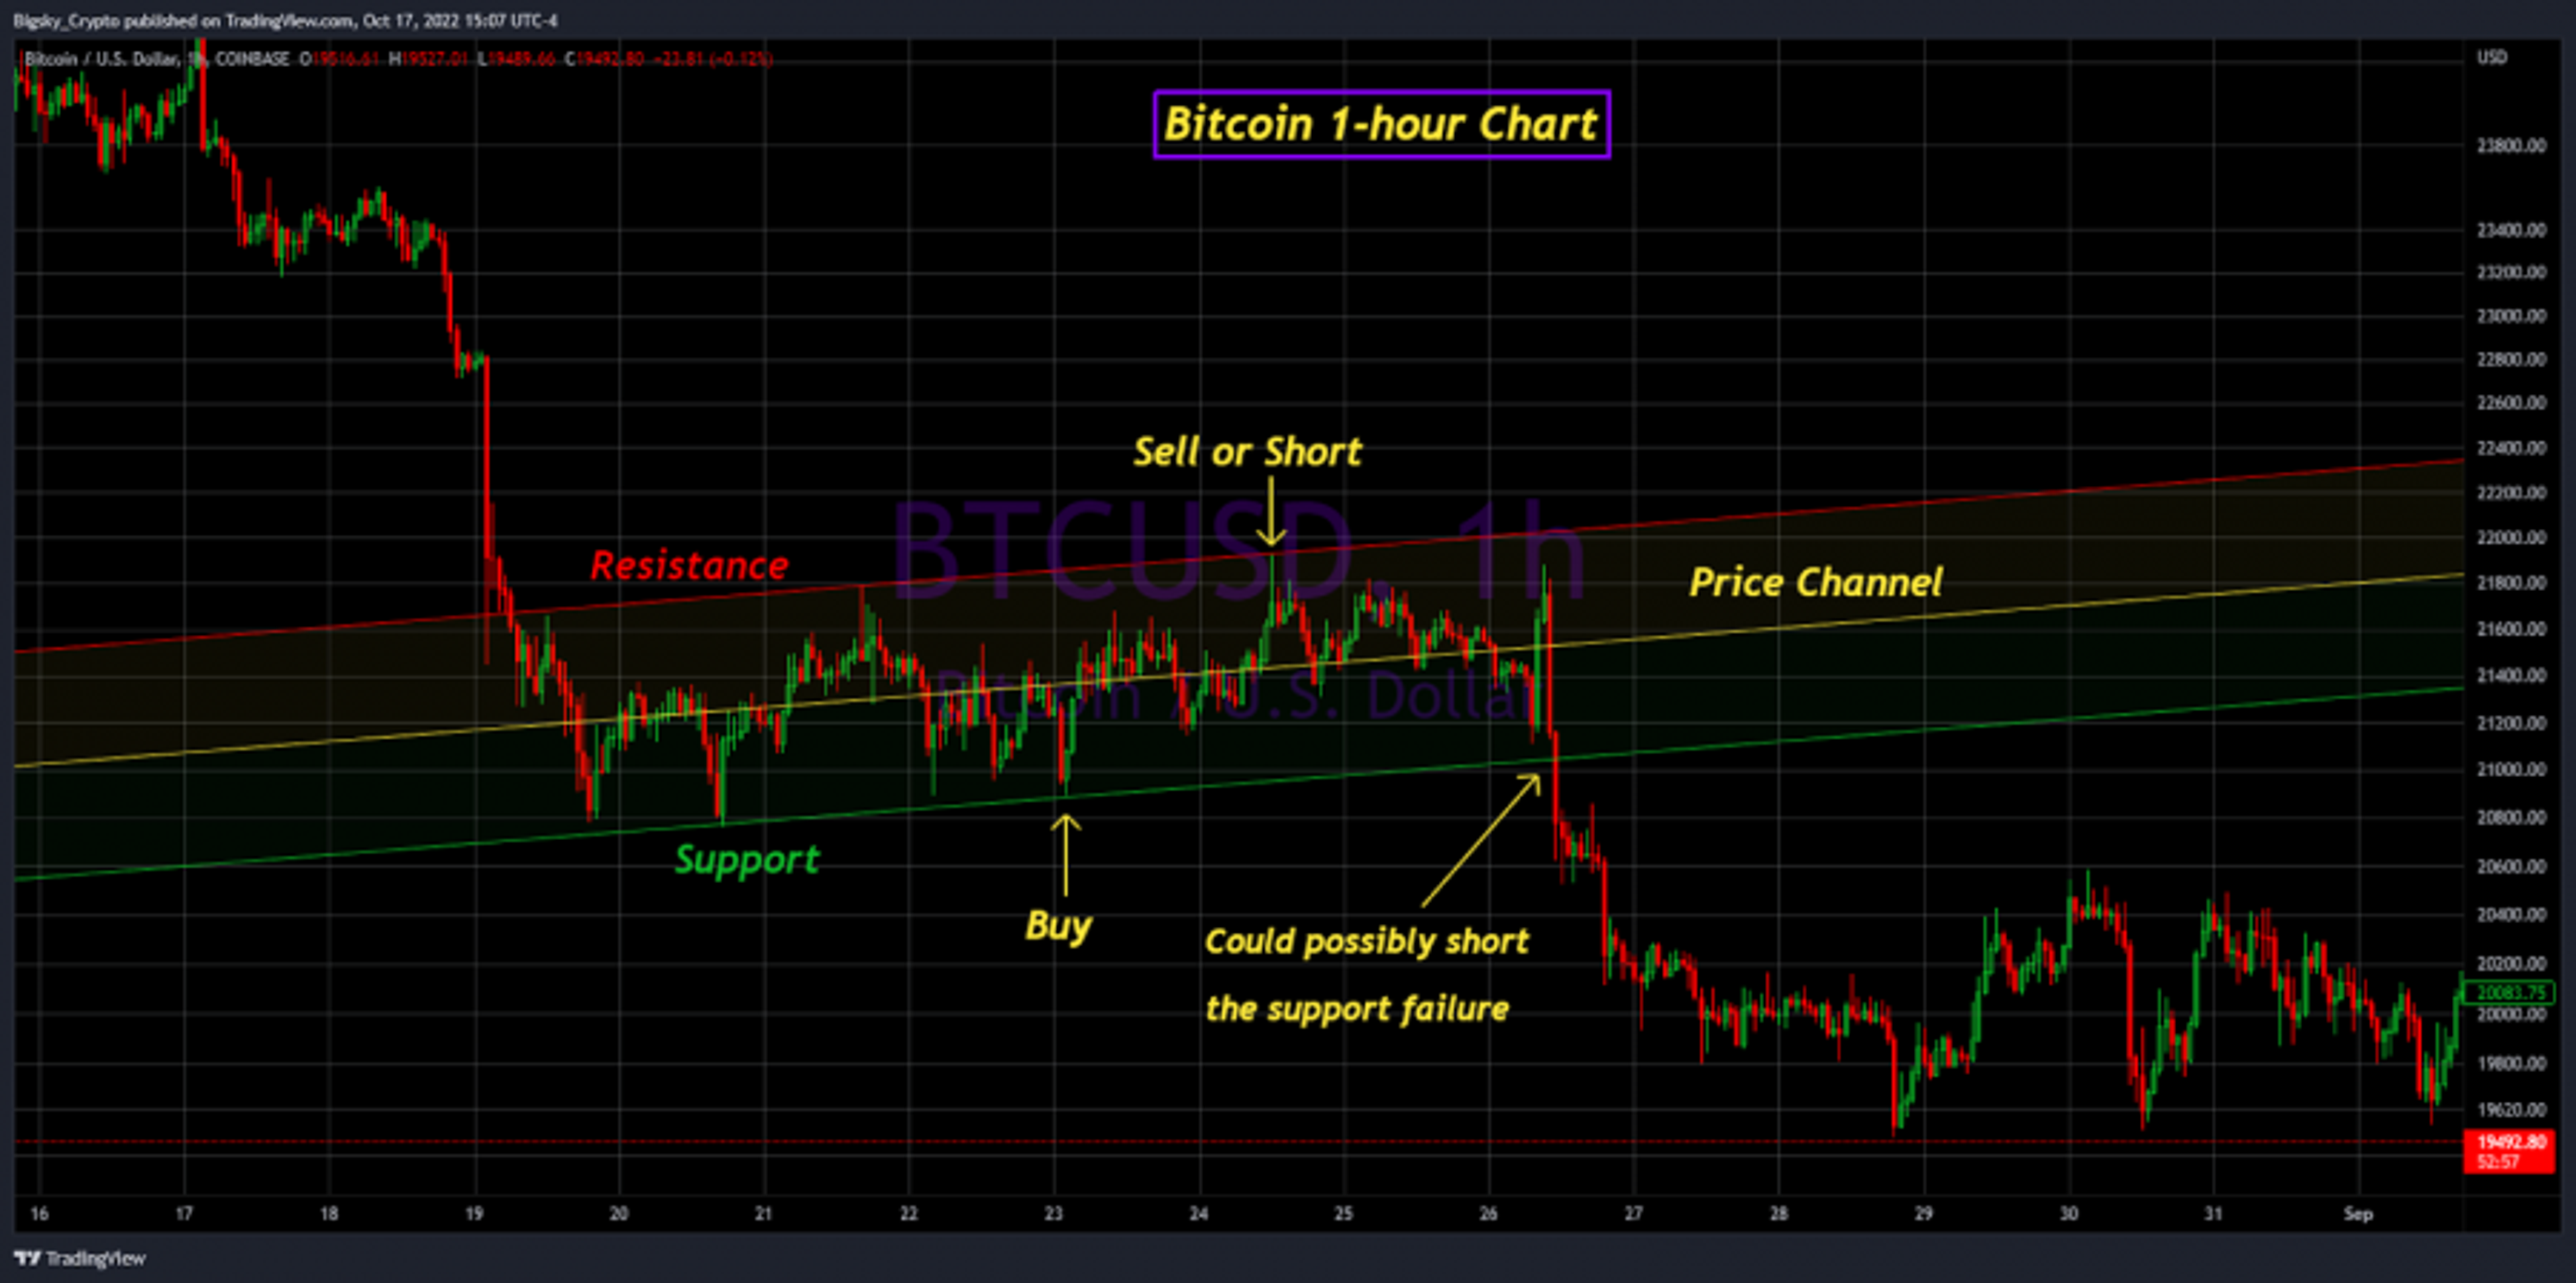
Price Channel
A price channel is formed when the price bounces between parallel resistance and support lines. Price channels can be flat or slope upward or downward. Traders will look for opportunities to buy at support and sell or short at resistance. Traders will also look for opportunities to go long or short if the price breaks out of the channel.
How to Use Technical Analysis in Crypto Trading
Although not perfect, technical analysis can provide traders with a more comprehensive view of a specific cryptocurrency or the overall market. You'll need good tools to help you conduct technical analysis. The most important is good charting software or a solid platform; TradingView is one of the best charting platforms on the market. TradingView is free, but serious traders may want to consider one of the paid subscriptions.
Another benefit of using technical analysis is that it will show you good entry and exit points. Technical analysis can also be used to identify support and resistance levels. Traders can determine position sizing and risk management using technical momentum and volatility indicators such as the Average True Range.


Risks of Using Technical Analysis in Crypto Trading
Technical analysis can be highly beneficial, but you must be aware of the risks. The sheer number of technical indicators and chart patterns available can be confusing. The many choices can result in bouncing from one indicator to the next before developing and thoroughly testing a strategy.
Choosing which and how many indicators to use can be a difficult task. It is easy to overcrowd your chart with indicators, resulting in a confusing mess, which is a common mistake made by new traders.
Technical Analysis vs. Fundamental Analysis in Crypto Trading
Now that you understand the basics of technical analysis, let's compare it to fundamental analysis. Technical analysis examines price action, volume and chart patterns to scrutinize a cryptocurrency.
Fundamental analysis examines on-chain data for specific cryptocurrencies, exchanges and miners. It can also contain project-specific information, such as the individuals or teams who created it, the project's purpose, the project roadmap and the project tokenomics.
Short-term traders will primarily rely on technical analysis, with some combining technical and fundamental analysis. Long-term investors will focus on fundamental analysis, but technical analysis of long-term time frames may also be included.
Here are a couple of more popular tools for crypto technical analysis.
Moving Average Convergence Divergence (MACD)
Based on the relationship between the two moving averages, the MACD allows you to assess the current trend direction (bullish or bearish) and predict where the price is more likely to go.
Relative Strength Index (RSI)
The RSI is a momentum indicator that looks at the magnitude of recent price fluctuations to determine whether a cryptocurrency's price is overbought or oversold. The indicator can also be used to identify bullish or bearish divergences between the indicator and the price.
Here is an example of a couple of more popular tools used in fundamental crypto analysis.
Glassnode
Glassnode is a blockchain analytics firm that provides on-chain market and exchange data. Some Glassnode data categories include Market, Exchanges, Network Stats, Profit/Loss and Distribution. Traders can learn so much from this data, such as exchange inflows and outflows, Whale deposits and withdrawals and address balances.
CoinMarketCap
CoinMarketCap is the world's most popular cryptocurrency price-tracking website. With over 21,000 different cryptocurrencies, cryptocurrencies are ranked by market capitalization.
It is simple to investigate any cryptocurrency project using CoinMarketCap. Everything you need to know about the project team, tokenomics, the roadmap and past price performance is available on the website. CoinMarketCap is an essential tool that traders and investors should use.
Is Technical Analysis Worth Using?
Although not perfect, technical analysis can provide traders with a significant advantage. If you do not conduct technical analysis before entering a trade, you are trading blindly. However, more than technical analysis is required to become a profitable trader.
Traders must also devise a repeatable strategy that increases the likelihood of a profitable trade. Before entering a trade, traders must also develop a trading plan. Anyone who has traded knows that emotion is a trader's worst enemy. Making and sticking to a trading plan will help to remove emotion from trading.

About Donald Hancock
Donald’s expertise lies in the technical analysis of both stocks and crypto.