Mastering candlestick patterns is a helpful skill for any forex trader seeking to gain an edge in the huge currency market. Among the many candlestick formations you can use to generate trading signals, the hanging man candlestick pattern stands out as a powerful technical analysis tool for identifying potential bearish exchange rates or price trend reversals after an upward trend.
In this article, Benzinga will explain the hanging man candle in detail, exploring its characteristics, significance and how it can be used profitably in forex trading strategies. Read on to learn how to effectively incorporate this pattern into your forex trading toolkit to enhance your forex trading success.
Understanding the Hanging Man Candlestick Pattern
The hanging man candlestick pattern is a bearish single candle pattern that appears on a candlestick chart of the exchange rate for a currency pair, typically at the end of an uptrend. It is characterized by its distinct shape, which resembles a hanging man as shown in the image below.
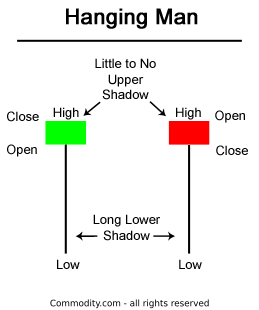
A hanging man candle diagram highlighting its main characteristics. Source: Commodity.com.
This candlestick features a small red or green body located near the day's high and a long lower shadow that extends below the small body. The upper shadow, if present, is typically short or nonexistent, which suggests that the close, open and high exchange rates were very similar.
Note that when the high and opening exchange rates are the same, a red hanging man candlestick is formed. This pattern is generally thought to generate a stronger bearish signal than the green hanging man candle that arises when the high and close are the same.
The appearance of a hanging man candle after an uptrend shows that selling interest is beginning to rise, so a downward correction or a new downtrend may ensue. The tug-of-war between buyers and sellers that forms the hanging man pattern is a pivotal element in understanding the psychology of market participants and anticipating future exchange rate movements based on this pattern.
The following bullet points explain the essential characteristics of the hanging man candlestick pattern in greater detail.
- Lower shadow: The hanging man candlestick pattern features a long lower shadow that extends well below its small body.
- Body: The body of the hanging man candlestick is usually small and appears near the high of the candlestick time period’s range. It can be either red or green, and its location and size reinforce the idea that the bears attempted to drive the exchange rate lower, but the bulls managed to push it back up again by the session's close.
- Upper shadow: The hanging man candlestick’s upper shadow is typically short or even nonexistent. This lack of a substantial upper shadow adds further weight to the notion that bearish sentiment is increasing and that a potential downside move might be imminent.
How to Implement the Hanging Man Candle in Forex Trading Strategies
Once you have a solid grasp of the hanging man candlestick pattern's anatomy, you can explore how to incorporate it effectively in a forex trading strategy. Keep in mind that trading based solely on candlestick patterns may not always yield optimal results. When the hanging man candle is combined with other technical and fundamental analysis tools, it can significantly improve the accuracy of your forex trade entries and exits based on it.
Identifying the Hanging Man Candlestick Pattern
Recognizing the hanging man pattern accurately is the first step to harnessing its potential to help you predict future exchange rate movements. To identify this pattern on forex charts, consider using the following tips:
- Look for a short or nonexistent upper shadow and a long lower shadow: The characteristic long lower shadow of the hanging man candlestick should stand out clearly. The absence of a substantial upper shadow indicates the potential exhaustion of bullish momentum and adds further credence to the bearish tone of this pattern.
- Confirm the pattern by analyzing previous candles: It is essential to consider the context in which the hanging man candle forms. Analyze the preceding candles to understand the prevailing exchange rate trend.
- Note the candle’s color: A red hanging man candle that occurs after a prolonged uptrend is more likely to signal a potential bearish move than a green hanging man.
Analyzing the Hanging Man Candlestick Pattern
Understanding the significance of the hanging man candle in forex trading is vital to making better trading decisions. Several factors contribute to the pattern's importance:
- Discern the psychology behind the pattern: The hanging man candle reveals a bearish shift in market sentiment after an extended rally, indicating that the bulls are losing control and bearish forces may be gaining strength. As such, traders typically use this pattern to anticipate a possible uptrend reversal to the downside.
- Consider the prevailing trend: The hanging man candle’s significance as a reversal signal is amplified when it appears after a prolonged uptrend. In such cases, it serves as a warning sign for potential trend exhaustion and a possible bearish reversal.
- Use trading volume to help confirm the pattern: For a hanging man candle to carry substantial weight, it should be accompanied by relatively higher trading volume. Increased volume validates the potential reversal signal since it indicates increased market participation and stronger conviction among traders.
Implementing a Trade Strategy with the Hanging Man Candle
When implementing a forex trading strategy using the hanging man candle, remember that timing your trades is a key element of success. Some additional steps to take within an effective trade strategy centered on this pattern could include:
- Timing the entry and exit points for a hanging man trade: Traders typically enter a short trade once the hanging man candle has been confirmed by the subsequent weak market action, ideally once a lower closing exchange rate is seen on the next candle. This provides a more reliable signal for a potential downside reversal.
- Setting stop-loss and take-profit levels for risk management: To manage risk effectively, set a stop loss just above the high of the hanging man candle to protect your position in case of a false signal. Determine a suitable take-profit level based on support and resistance levels or other technical indicators. Consider using trailing stops to protect your profits and size your positions appropriately given your trading account size and risk appetite.
- Identifying suitable currency pairs and timeframes: Trading different currency pairs and timeframes using the hanging man candle may yield varying results. Experiment with different combinations to find what works best for your trading style, risk tolerance and results.
- Testing a hanging man candle strategy: Once you have come up with a strategy that incorporates the hanging man candle, make sure to test it thoroughly by backtesting it over historical exchange rate data to see how it might have performed. You can also try it out in real-time by trading the strategy in a demo account using virtual money. This can help you gain confidence in your new strategy and practice how to use it.
Hanging Man Trading Example
Now consider a practical example of how the hanging man candlestick pattern could be used in a forex trade. Imagine you are a forex trader monitoring the EUR/USD currency pair on the daily chart.
After a prolonged uptrend, you notice a hanging man candlestick forming at the top of the trend. The characteristics of the candle you observe include a non-existent upper shadow, a small red body near the day's high and a long lower shadow.
To confirm the pattern, you examine the previous candles to ensure that the hanging man appears in the context of an uptrend. You also check the trading volume, which is relatively higher on the day of the hanging man candle, and you see bearish divergence showing on the 14-day Relative Strength Index (RSI). All these factors lead you to believe that a potential bearish reversal might be on the horizon.
Having identified the hanging man candle, you decide to enter a short trade in the EUR/USD currency pair if the next candle closes lower than the hanging man's low. When this happens, it serves as a confirmation signal so you execute your trade as planned. You also set a stop-loss order just above the high of the hanging man to protect your account against a false signal.
As the market unfolds, your trade begins to move in your favor. The following days confirm the bearish reversal, as the EUR/USD pair continues to exhibit a corrective decline. You closely monitor the forex market’s behavior and use a trailing stop strategy to adjust your stop-loss order lower to lock in profits as the market declines further in your favor.
After a period of decline, the EUR/USD pair reaches a support level, where you decide to take profits. This decision is based on technical analysis, as well as your trading plan, which dictates taking profits on shorts near clear support levels.
By implementing this successful trade using the hanging man candlestick pattern, you have not only protected your capital through prudent risk management but you also capitalized on the bearish trend reversal.
Additional Tips and Considerations
While the hanging man candlestick pattern can be a valuable tool, it is essential to use it in conjunction with other technical indicators and fundamental analysis to enhance your trading decisions. Here are some additional tips and considerations to keep in mind:
- Use additional technical indicators to confirm the hanging man candle: Combine the hanging man pattern with support and resistance levels, as well as other technical indicators such as moving averages, RSI, MACD and Fibonacci retracement levels to strengthen your trade signals and improve overall accuracy.
- Consider fundamental factors that may impact the trade: Keep an eye on economic events, geopolitical developments and central bank announcements that could influence a currency pair’s exchange rate movements. Fundamental analysis can complement your technical analysis and provide a more comprehensive view of the market and why it moves.
- Regularly reviewing and adjusting the trading strategy based on market conditions: The forex market is dynamic, so your trading strategies must adapt accordingly. Regularly review your trading plan and adjust it based on changing market conditions and your risk tolerance, as well as after a thorough performance evaluation.
Can Forex Traders Use the Hanging Man Candlestick Pattern?
The hanging man candlestick pattern is a powerful tool in a forex trader's arsenal for identifying potential upward trend reversals to the downside. By understanding its characteristics and significance, traders can effectively incorporate the hanging man candle into their trading strategies and make better trading decisions.
This pattern typically signals a bearish reversal, and its true predictive potential is realized when it appears as a red candle after a prolonged uptrend. When combined with other technical indicators and fundamental analysis, the hanging man candle can significantly enhance the accuracy of trade entries and exits.
As with any trading strategy, it is essential to exercise caution and implement proper risk management techniques since the hanging man candlestick pattern is not foolproof and may sometimes lead to false signals. Therefore, make sure to use this pattern in conjunction with other technical analysis tools.
By mastering the hanging man candle and integrating it into a comprehensive trading plan that includes prudent risk and money management measures, both experienced and novice forex traders can increase their chances of operating profitably in the currency market.
Frequently Asked Questions
Can a hanging man candle be bullish?
No, the hanging man candlestick pattern is typically considered a bearish reversal pattern that forms at the end of an uptrend.
Can a hanging man candle be green?
Yes, a hanging man candle can be green since the color of the hanging man candle is not critical to its bearish significance. It can be either green (bullish) or red (bearish).
What does a hanging man candlestick mean?
The hanging man candlestick pattern signifies a potential trend reversal to the downside. It indicates that the bulls are losing momentum after a prolonged upward move, so bearish forces might be gaining strength. Traders use this pattern to anticipate a possible downward shift in the exchange rate.

About Jay and Julie Hawk
Jay and Julie Hawk are the married co-founders of TheFXperts, a provider of financial writing services particularly renowned for its coverage of forex-related topics. With over 40 years of collective trading expertise and more than 15 years of collaborative writing experience, the Hawks specialize in crafting insightful financial content on trading strategies, market analysis and online trading for a broad audience. While their prolific writing career includes seven books and contributions to numerous financial websites and newswires, much of their recent work was published at Benzinga.