Happiness is an elusive and subjective concept. But there is one situation where it’s unquestionably present — when you find a good bargain.
Everyone likes to find a good deal. Retailers know this and have built their empires counting on it. A good deal even has its own holiday — Black Friday.
Millions of loyal pilgrims make their way to shopping centers to pay tribute to consumerism. Yet, the stock market has a special day, too — Black Monday. It arrives irregularly and uninvited.
While Black Fridays are ruled by greed, Black Mondays are ruled by fear.
When a stock market crash arrives, everything goes on sale — but the buyers are hard to find.
One day your favorite stocks will go on sale. Read on how to objectively approach their valuation and understand what makes a certain stock a potential bargain.
By going through these 3 steps you’ll be able to gauge if a stock is overvalued, undervalued or fairly valued.
1: Evaluate the Price-to-Earnings (P/E) Ratio.
Price-to-earnings (P/E) ratio is one of the most widely used metrics for stock valuation. It determines the relative value of the company by comparing the current stock price with the historical earning record.
P/E ratio is calculated by dividing the stock share with earnings per share (EPS). EPS is calculated by dividing the revenue by the number of shares.
EPS has 2 types — trailing and forward. While trailing EPS looks at the historical performance, forward EPS uses the estimation for the future. This is usually in a form of revenue guidance that the company publishes.
P/E ratio standards vary by industry. While high growth sectors like healthcare or technology can mandate higher ratios (as growth offsets the price) other sectors like financials will have much lower ratios. So, to gauge where the stock stands, it is necessary to compare it not only to the market index but to its sector in particular.
One limitation of the P/E ratio is that it cannot be used for companies that are not yet profitable, as they have negative earnings.
- Shiller P/E ratio
Named after the Nobel laureate, professor Robert J. Shiller, this is an improved P/E ratio. It is also known as cyclically adjusted price-to-earnings (CAPE) ratio.
This ratio calculates if the stock is overvalued or undervalued by comparing its current price to the inflation-adjusted historical earnings record.
As of April 27, 2021, the CAPE ratio for S&P 500 is at 36.61. Compared to the historical average of 15-16, this is very high. Although the CAPE ratio is not intended to predict recessions, record-high levels of CAPE above 30 have historically occurred before market crashes.

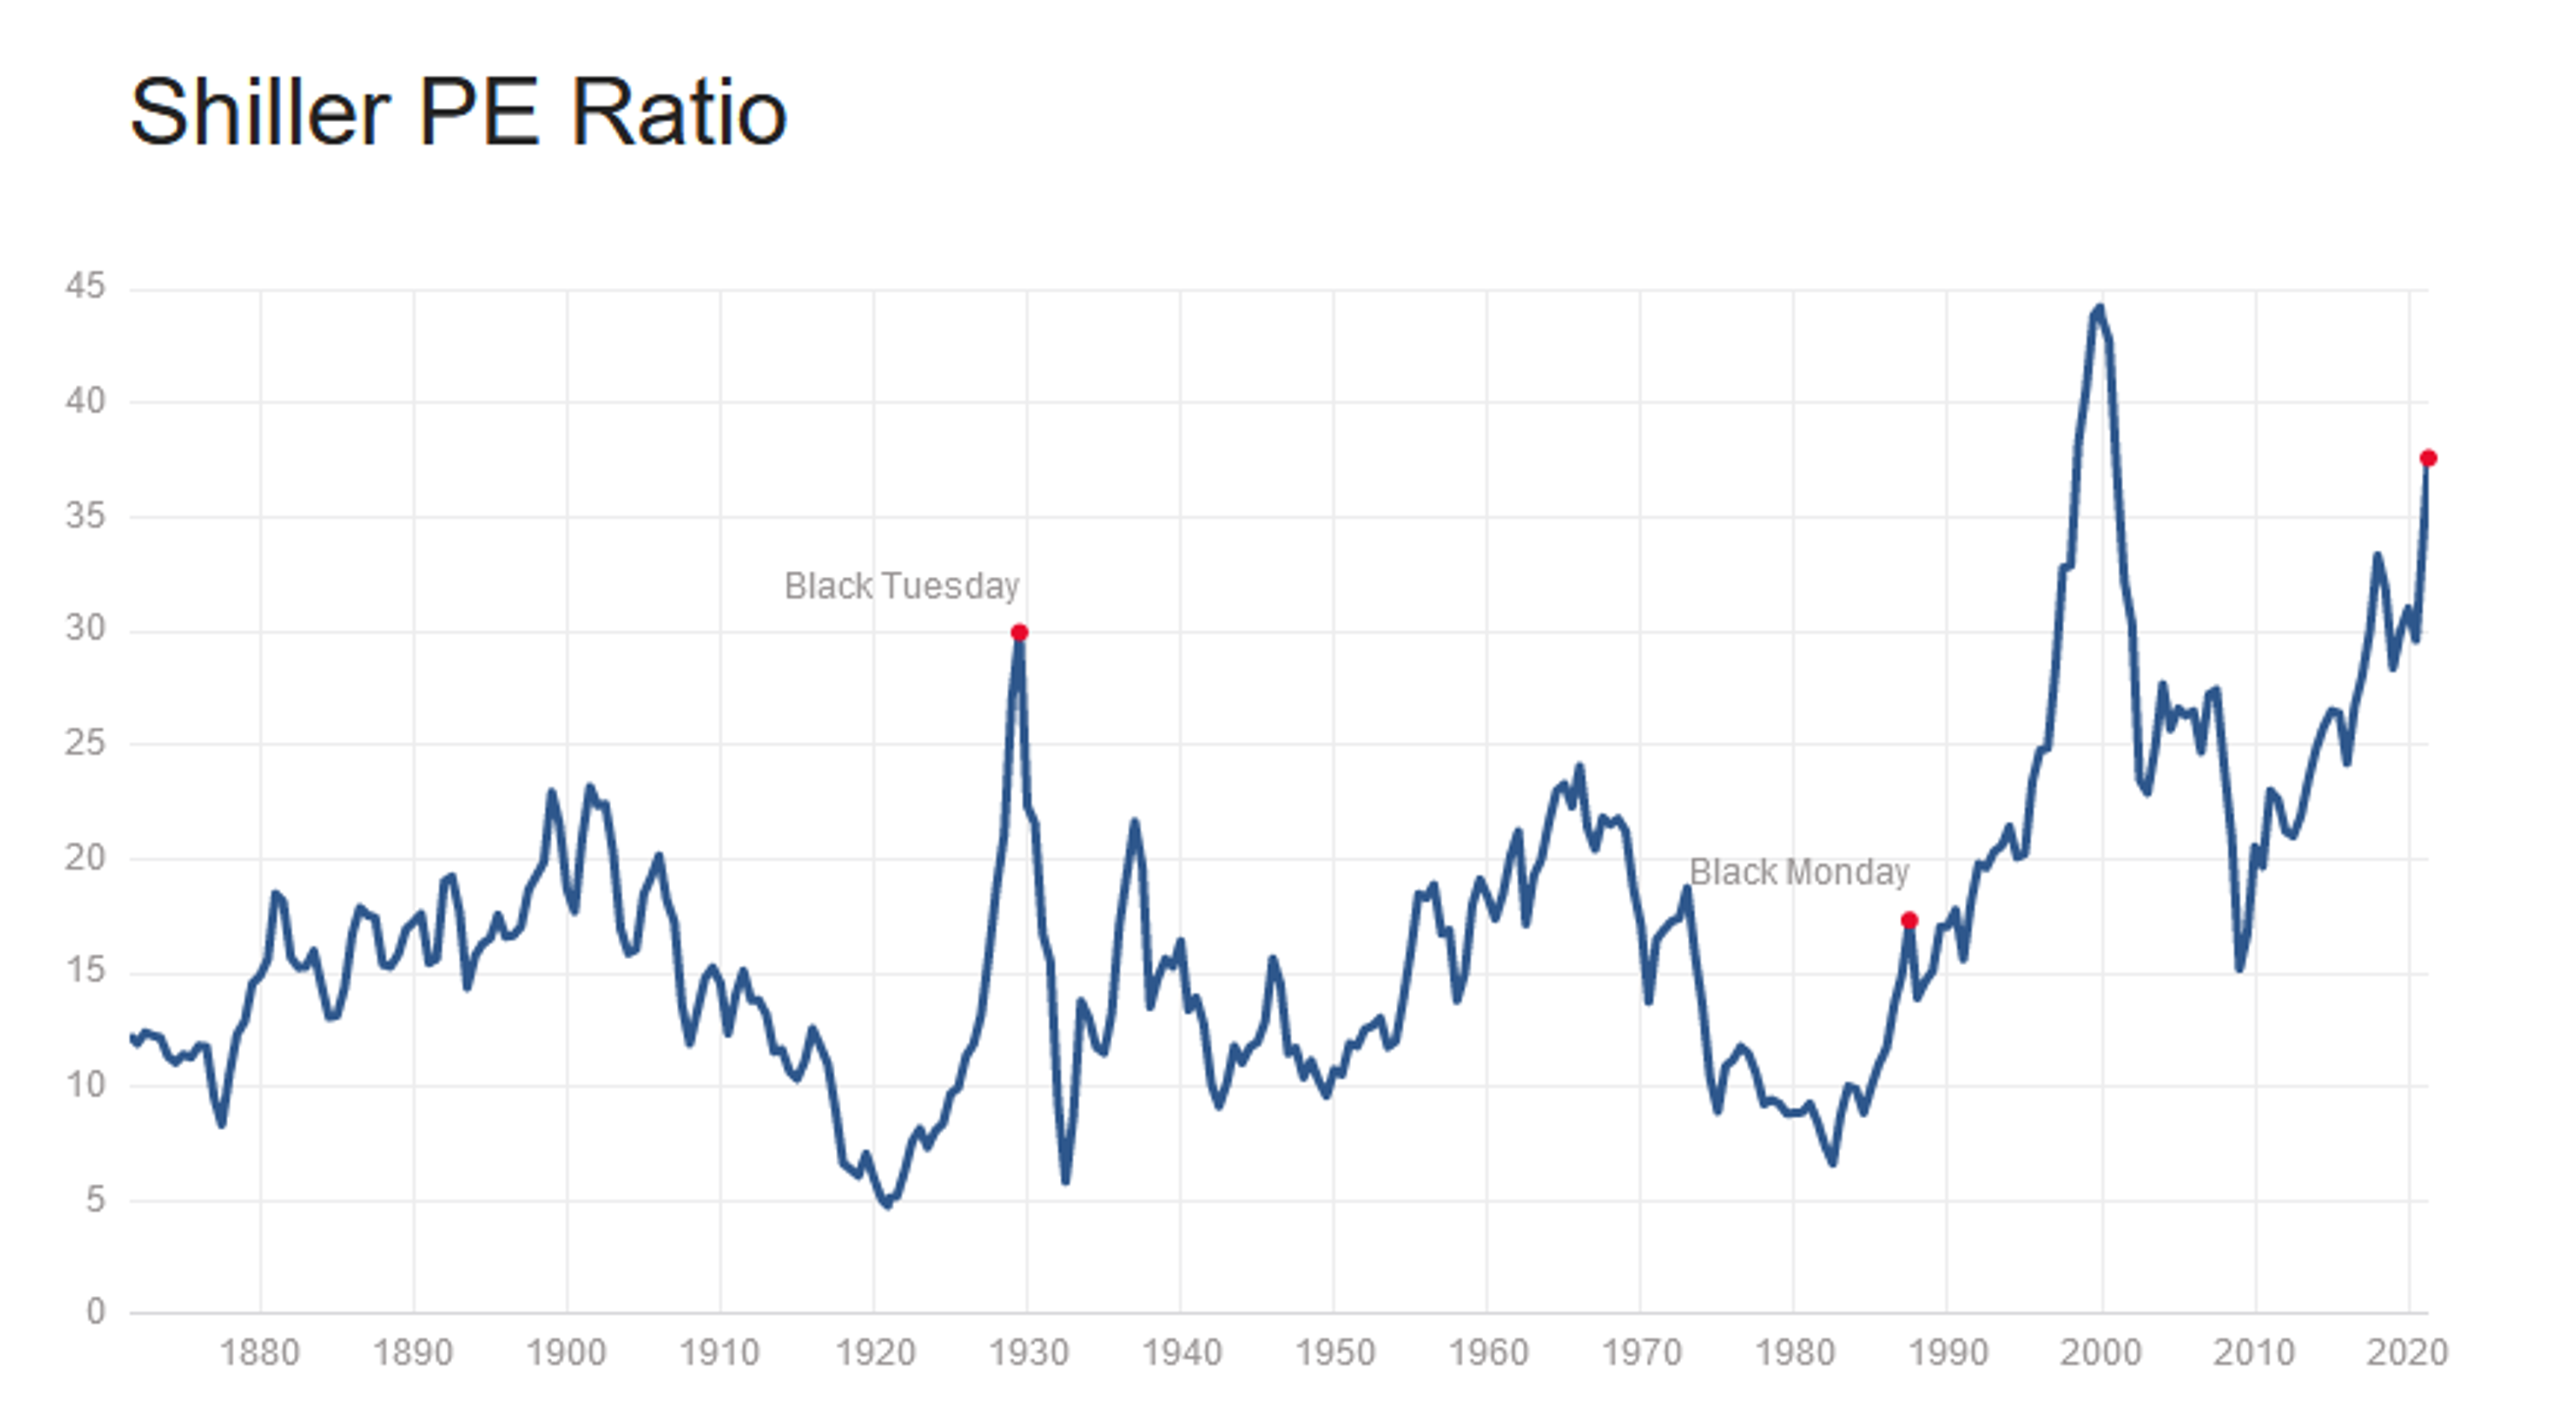
Historical Shiller P/E ratio; Source: gurufocus.org
2: Find the Price-to-Book (P/B) Ratio.
The price-to-book ratio is a financial indicator that compares the market value of the company to its book value. It can be also used for companies that have negative earnings.
P/B ratio = stock price / book value per share
Where, book value per share = (assets – liabilities) / number of shares issued
Traditionally, P/B ratios under 1 are considered good — meaning that market value is below the book value. This gives a potential investor a safety buffer as the price should rebound at least to the book value. Yet, a low P/B ratio can indicate fundamental problems within the company — poor use of assets, in particular.
P/B ratio is also not without limitations as it fails to factor in future earning prospects or intangible assets.
Thus, it is a good idea to use the P/B ratio with return on equity (ROE).
ROE = Net income / Shareholder Equity
Where
Net income = Sales – (cost of goods sold + all other expenses, taxes and interest) and Shareholder equity = Company’s assets – Debt
A rule of thumb is to consider ROE near or above 15% as acceptable, while figures below 10% are poor.
3: Check the Debt-to-Equity (D/E) Ratio
The debt-to-equity ratio (known as risk ratio) is a ratio that shows financial leverage. It calculates the weight of debt and liabilities against the shareholders equity.
D/E = Total Liabilities / Total Shareholders Equity
Leverage is a double-edged sword that is often poorly understood — as leverage does not change the odds of success but simply amplifies the magnitude of outcome… both positive and negative.
Naturally, you want this ratio low — it indicates a lower amount of financing by external lenders (vs financing through shareholder equity). Although the D/E ratio varies by industry, a rule of thumb is to look for a value below 2.0.
Pros and Cons of Buying Undervalued Stocks
Even though buying anything below the intrinsic value is the least risky strategy, it still does not come without downsides. Here are some pros and cons of buying undervalued stocks.
Pros to Buying Undervalued Stocks
- Low risk – high reward: While stocks have no limit on the potential upside, the potential downside is always going to be 0. So, buying something that is inherently already closer to 0 than it should be is creating favorable risk-to-reward scenarios.
- Analytical approach: Most of the analysis is going to be based on numerical objectivity. Evaluating multiple metrics with a clear goal will help you mitigate possible biases. This is especially helpful if you are an emotional investor.
- Compounding potential: Compounding is the most underestimated force in the universe. If you find undervalued dividend-yielding stocks, reinvesting the dividend can significantly boost your returns over time.
Cons to Buying Undervalued Stocks
- Requires experience and patience: Accurately estimating the intrinsic value of the company requires certain expertise. Even after the work is done, you will sometimes have to wait for a buying opportunity to present itself.
- Time-consuming: You will have to browse through countless balance sheets, cash flow reports and other documents — and make meaningful interpretations. This requires time and effort, thus incurring opportunity costs for you.
- Risk of flawed analysis: The stock market is still an incomplete information game. Despite all the effort, you can still make a mistake somewhere and arrive at a flawed conclusion.
Methods for Calculating Stock Value
Although uncovering the stock value is a quantitative task, it still needs educated guessing and objectivity.
Two of the most popular models are discounted cash flow and dividend discount models. These are also known as “absolute value” models, as they take only the financial data from the company.
Discounted Cash Flow
Discounted cash flow (DCF) is a method of investment valuation. Its goal is to estimate the present value of an investment based on expected future cash flows.
History points to the use of DCF as early as ancient Egypt and Babylon. Yet, it only gained popularity in the mid-20th century and became standard practice by the 1980s.
DCF formula states that:
PV = CF1 / (1+k) + CF2 / (1+k)2 + … [TCF / (k-g)] / (1+k) n-1
- PV = Present value
- CF1 = Expected cash flow for year 1
- CF2 = Expected cash flow for year 2
- TCF = Terminal cash flow or cash flow overall (an estimate because the future cannot be fully predicted)
- k = Required rate of return (discount rate)
where, k = rf + ß (rm – rf)
- rf = risk-free rate
- ß = Beta coefficient of an investment
- rm = return of a market
- g = Expected growth rate
- n = Number of years included in the model
Although it might sound complicated, now it is usually done in Microsoft Excel with a variety of free templates available on the internet.
Yet, this approach is not without weakness.
DCF relies on the expected cash flow, which in turn relies on the market share and market growth estimates.
In 1995, Netscape Communications had a successful IPO giving the company valuation of $2.9 billion. Unsurprisingly, brand new technologies are hard to gauge, and investment bankers took Netscape’s 90% market share for granted. Netscape got acquired by AOL but got shut down in 2008, losing the market share completely.
Dividend Discount Model
The dividend discount model (DDM) is a method for stock price valuation that relies on the dividend payment data. It values the stocks based on the net present value of future dividends, using the Gordon growth model (GGM) — named after an American economist Myron J. Gordon, who published it in 1956.
GGM states that
P = D1 / ( r – g )
Where
- P = Current stock price
- g = Dividend growth rate (in perpetuity)
- r = Constant cost of equity capital for the company (or rate of return)
- D1 = Value of next year’s dividends
GGM determines the stock value based on the series of dividends growing at a constant rate. Yet, this assumes that a company would exist and have constant dividend growth — an ambitious assumption. So, this approach is limited for blue-chip stocks with established dividend growth rates.
Best Online Stock Brokers
Buying stocks today is almost unimaginable without brokers. You can use licensed intermediaries that buy and sell stocks on your behalf — through a web application or even your phone.
Check out our comparison of the best stock brokers.
- Best For:Active and Global TradersVIEW PROS & CONS:Securely through Interactive Brokers’ website
- Best For:Global Broker for Short SellingVIEW PROS & CONS:securely through TradeZero's website


Nothing Beats a Good Deal
Evidently, there is no single approach to finding undervalued stocks — and no single ratio or a chart would solve all of your questions at once. Crunching numbers is inevitable but easier with tools like Google Sheets and Benzinga Pro.
The greatest danger in the stock market does not come from buying poor stocks — it comes from paying the price that is too high.
When you buy an overvalued stock, you’re exposing yourself to higher risk. The company might not be as good as you predicted, or it is — but maybe the market doesn’t agree with you.
On the contrary, when you buy an undervalued stock, the odds are better. Even if your analysis is wrong, there are chances that the market will be even more wrong and push the price higher. You also start closer to 0, thus your risk-to-reward will be better.
Finding and following potentially undervalued stocks requires patience, planning and some math. Yet, if you are willing to go in that direction, you’d be following in the footsteps of some of the greatest investors in history.
Frequently Asked Questions
Is it good to buy undervalued stocks?
Buying undervalued stocks can be the most straightforward way to superior returns. Yet, this doesn’t mean that you should buy a stock only because it is cheap. The majority of cheap stocks are cheap for a reason — that is their fair value. Finding cheap quality stocks will require research and patience.
Why are some stocks undervalued?
Stocks can be undervalued for a number of reasons. The most favorable ones are when they face a short-term setback and the market overreacts or when the whole market experiences a structural decline. Either scenario creates a situation where perception understates reality. And while everyone can perceive quality, perceiving cheapness is not as obvious.

About Stjepan Kalinic
Forex, Equity Analysis, and Financial Education