


“There are only patterns, patterns on top of patterns, patterns that affect other patterns. Patterns hidden by patterns. Patterns within patterns.
If you watch close, history does nothing but repeat itself. What we call chaos is just patterns we haven't recognized. What we call random is just patterns we can't decipher."
― Chuck Palahniuk
If you understand the mechanisms of the market it can be a glamorous place no matter if it is moving up or down. One of the mechanisms we enjoy as Technicians and indeed even observers of life; is the music of the pattern. It is it's own kind of magic. The Double bottom is one of the most frequently seen patterns in the market. Volume is more important to the upside breakout. Return moves sometime come back to the breakout area and are more common. Patterns in price show up often. According to John Murphy in Technical Analysis of the Financial Markets, "price patterns are pictures or formations...that appear on price charts of stocks and have predictive value." We feel the Double Bottom is special because it gives those that did not get in at the initial low a chance to buy at the same price everybody else did and because it gives the shorts a chance to cover and book their treasure.
It was at 22 where Mosiac ($MOS) made it's first bottom in 2008 and then returned again in January 2016 signaling a possible major reversal pattern we refer to as a double bottom, which is one of the 5 most commonly used major reversal patterns. When looking at a specific reversal pattern keep in mind that the price ranges on bottoms take longer to form, are smaller, and for there to be a confirmed reversal there has to have been a prior trend. Without volume increasing, the case for a major bottom reversal would have been suspect.

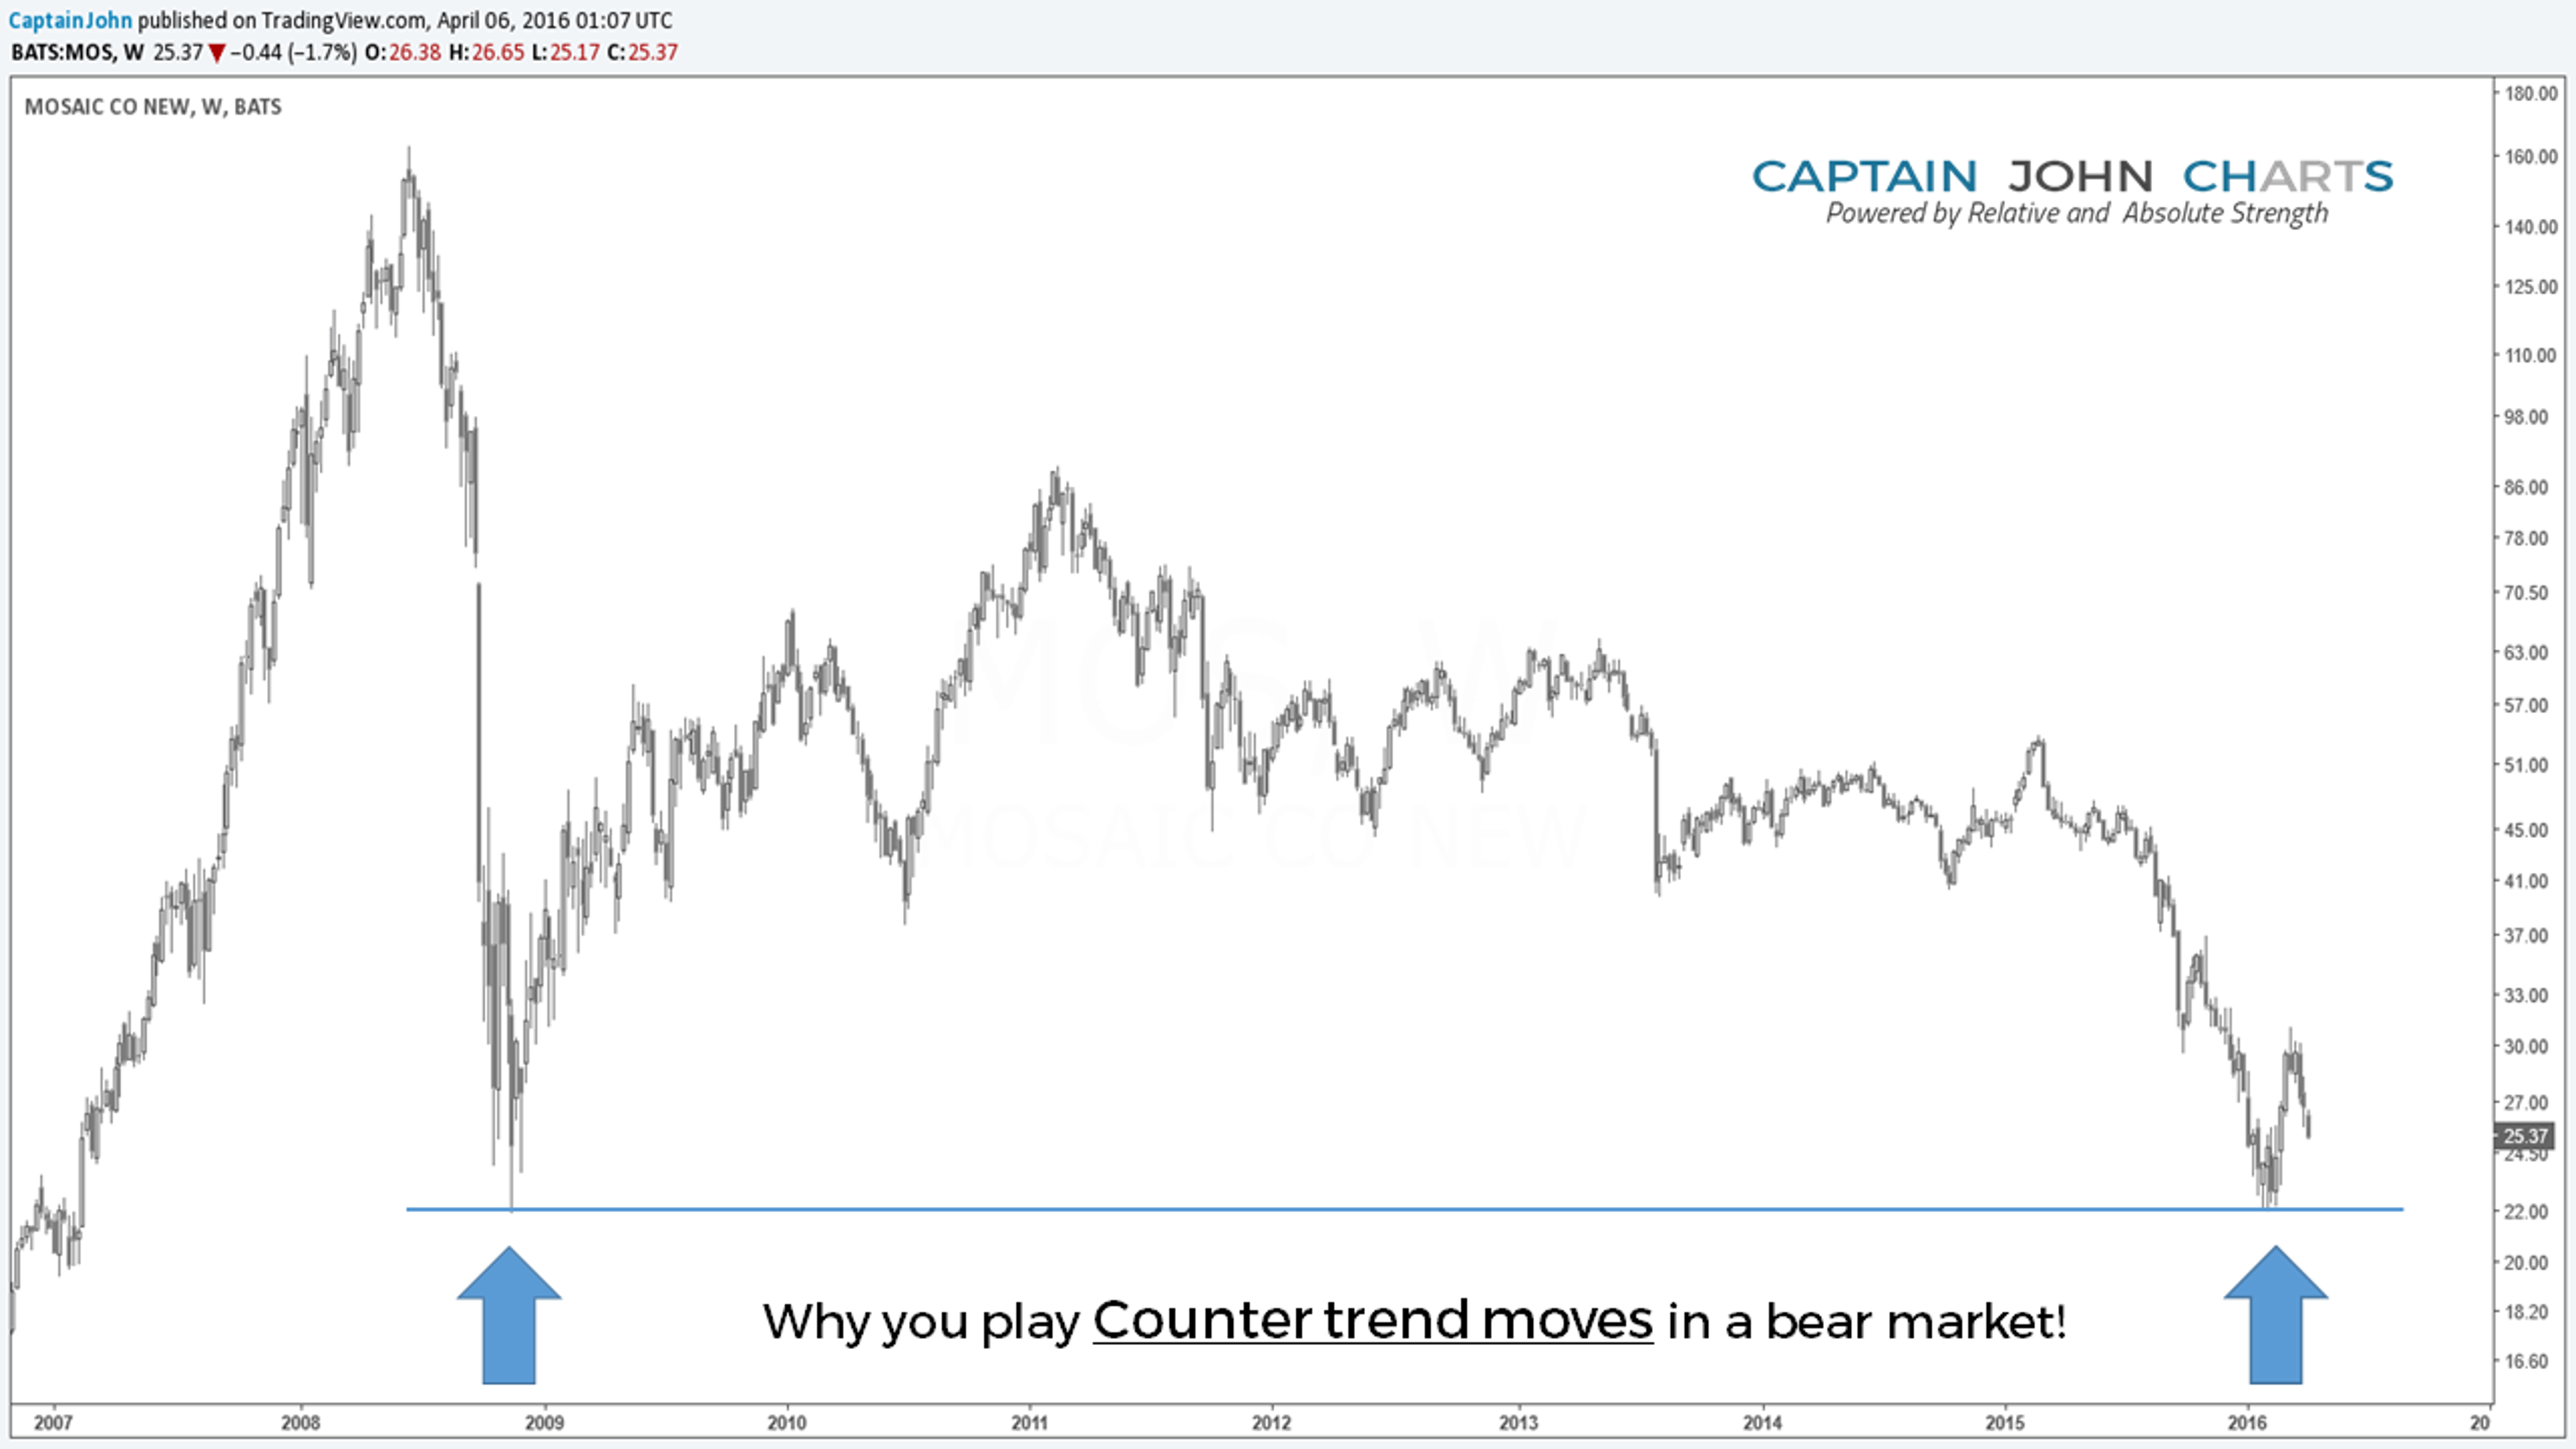
The reason we entered the trade is because $MOS successfully tested and held the 2008 lows and it gave us multiple bullish candles on a weekly pattern. It had become deeply oversold. The RSI diverged; as the price of Mosaic's stock went lower, the momentum/RSI made higher highs; which often signals exhaustion and time for a turn.


Investments tend to correct at certain percentages. In March when the price hit the 61.8 % Fibonacci on the Daily chart and the candle pattern made a long ominous wick, you had your chance to get out. 61.8% retracements are very common in bull or bear markets. In this case, in a bear market decline, Mosaic had retraced 61.8% of it's 2015 high and we mentioned that it was time to scale out.
Kimberly Swartz and John Butcofski
© 2024 Benzinga.com. Benzinga does not provide investment advice. All rights reserved.
Trade confidently with insights and alerts from analyst ratings, free reports and breaking news that affects the stocks you care about.

