The graphs below were produced by Capital Market Labs.
The old adage is that "no one ever got fired for hiring International Business Machines Corp. IBM."
For decades, "Big Blue" was the gold standard for technology companies and a reliable investment.
Yet over the last two years, IBM is down over 17 percent, while at the same time, the S&P 500 has risen nearly 40 percent and the NASDAQ over 50 percent.
That’s an underperformance of between 57 percent and 67 percent in just two years.
Something has gone drastically wrong.
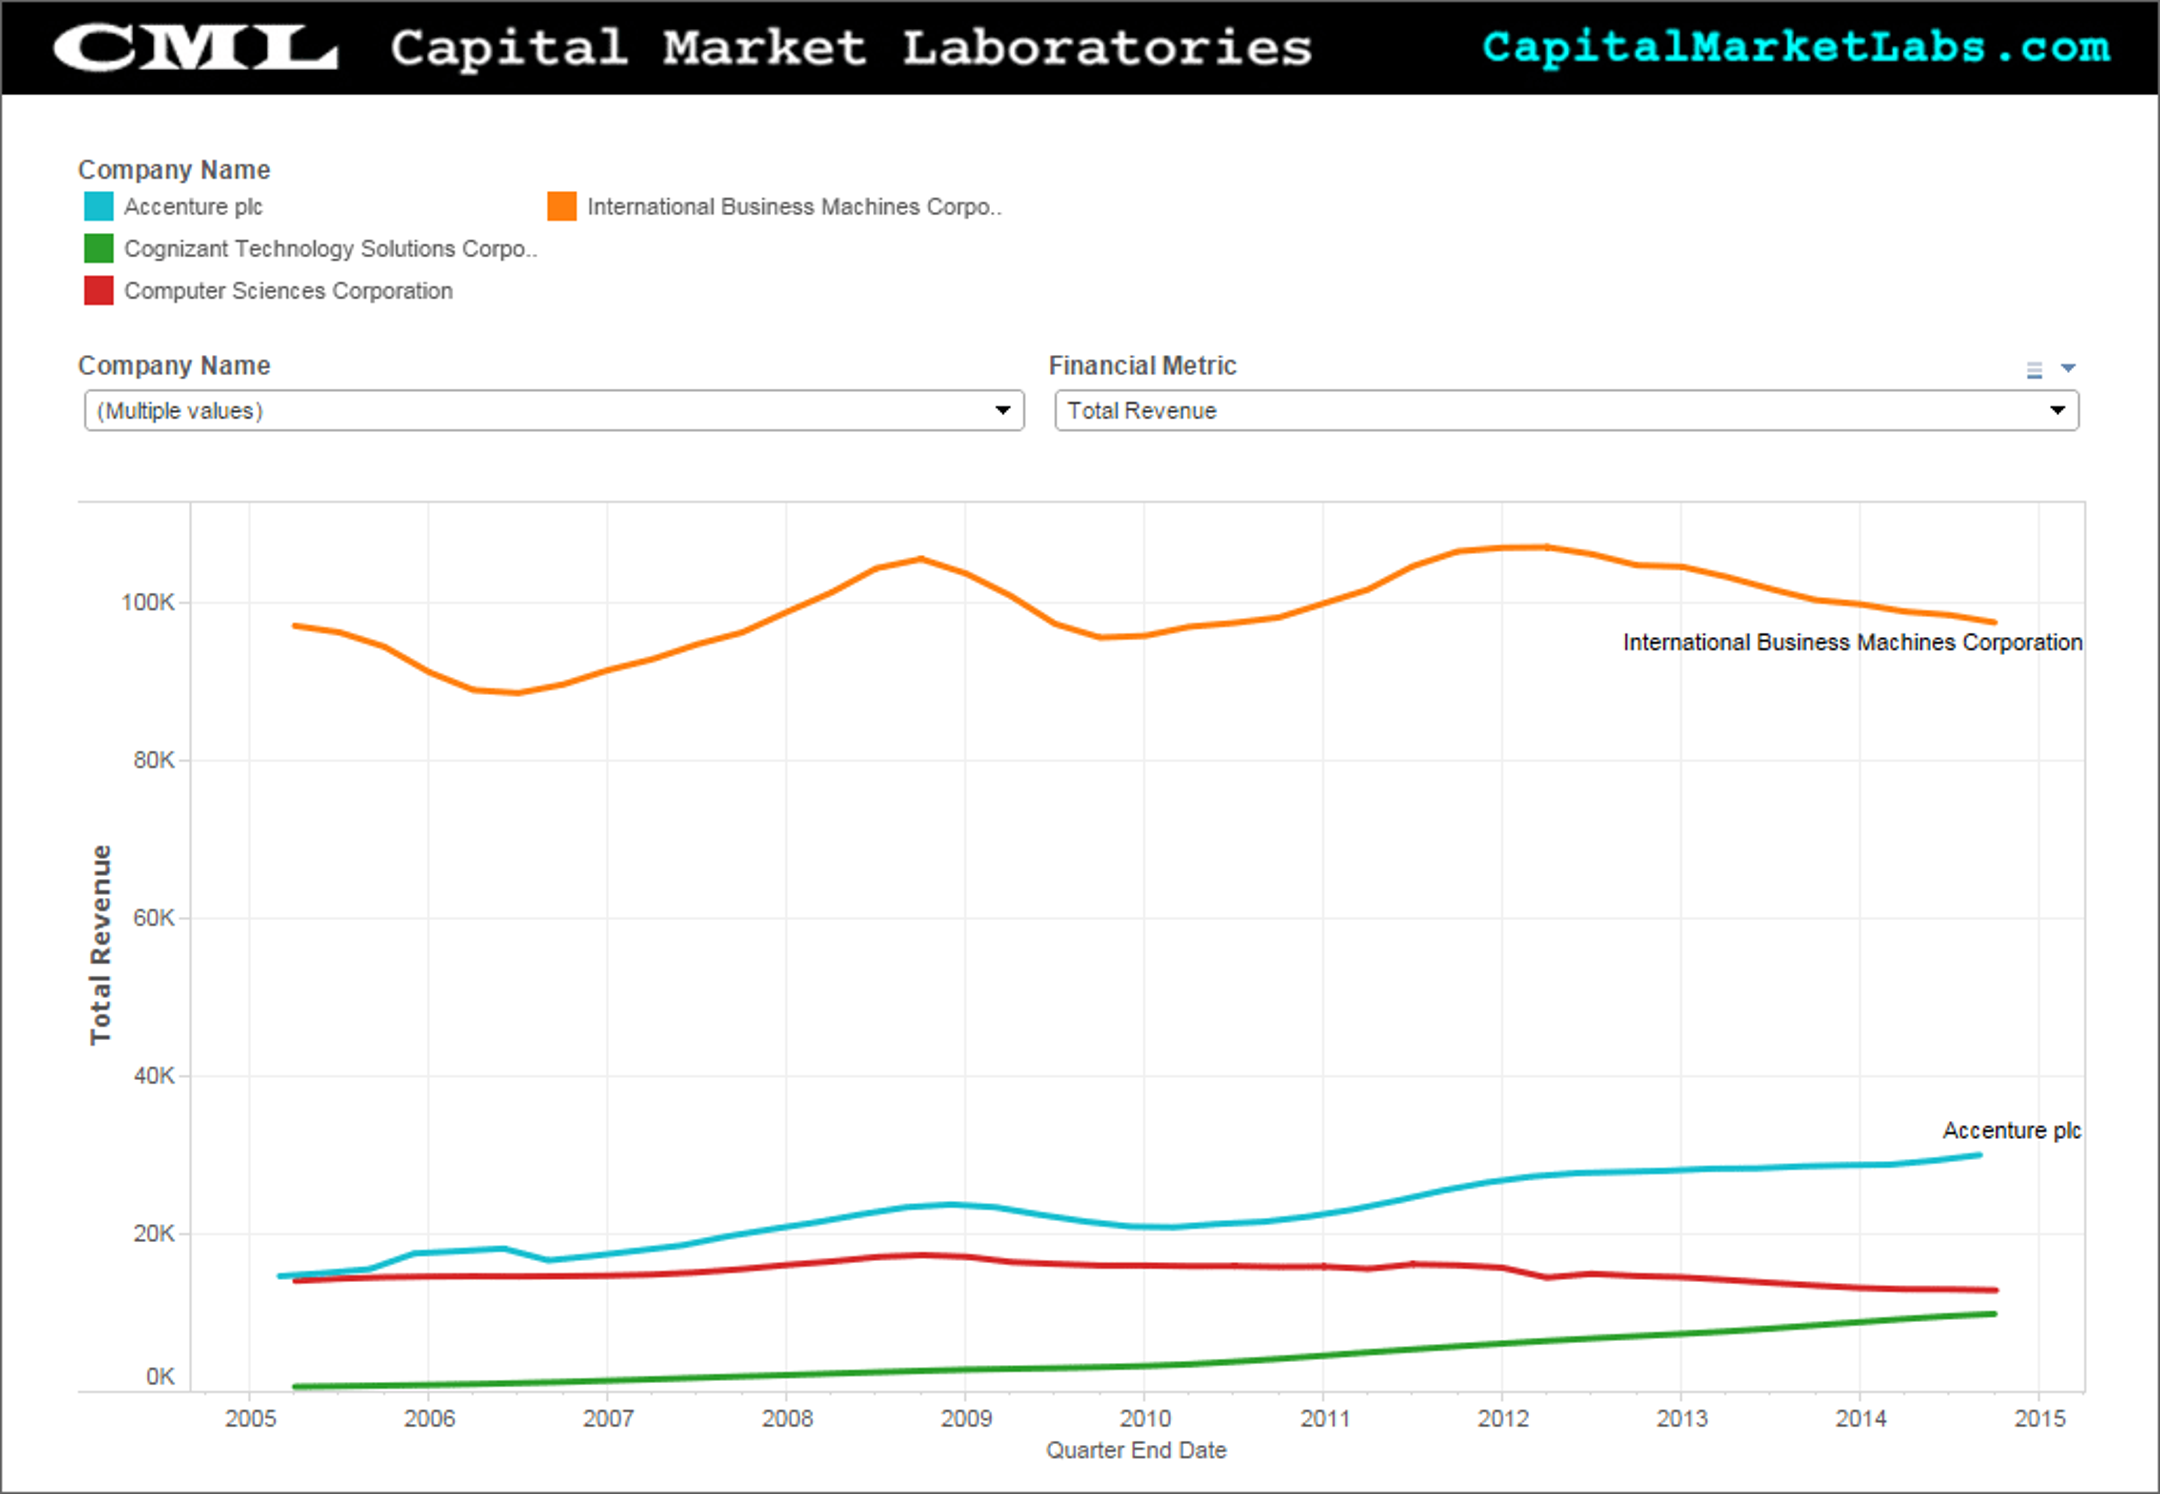
Let’s start by looking at a time series of total revenue for IBM and three of its competitors: Accenture Plc ACN, Computer Sciences Corporation CSC and Cognizant Technology Solutions Corp CTSH.
The most striking aspect of this chart is the almost complete lack of growth for IBM. In ten years, revenue has increased from $97.0 billion to $97.4 billion -- a 0.44 percent revenue growth.
Meanwhile, competitors like Accenture have increased their revenues by over 100 percent during the same time period, and Cognizant has seen a remarkable increase in revenue of over 1400 percent.
Another way to look at it: Since 2005, these four companies have seen revenues increase by $23.8 billion, but IBM has captured just 1.8 percent of that increase.

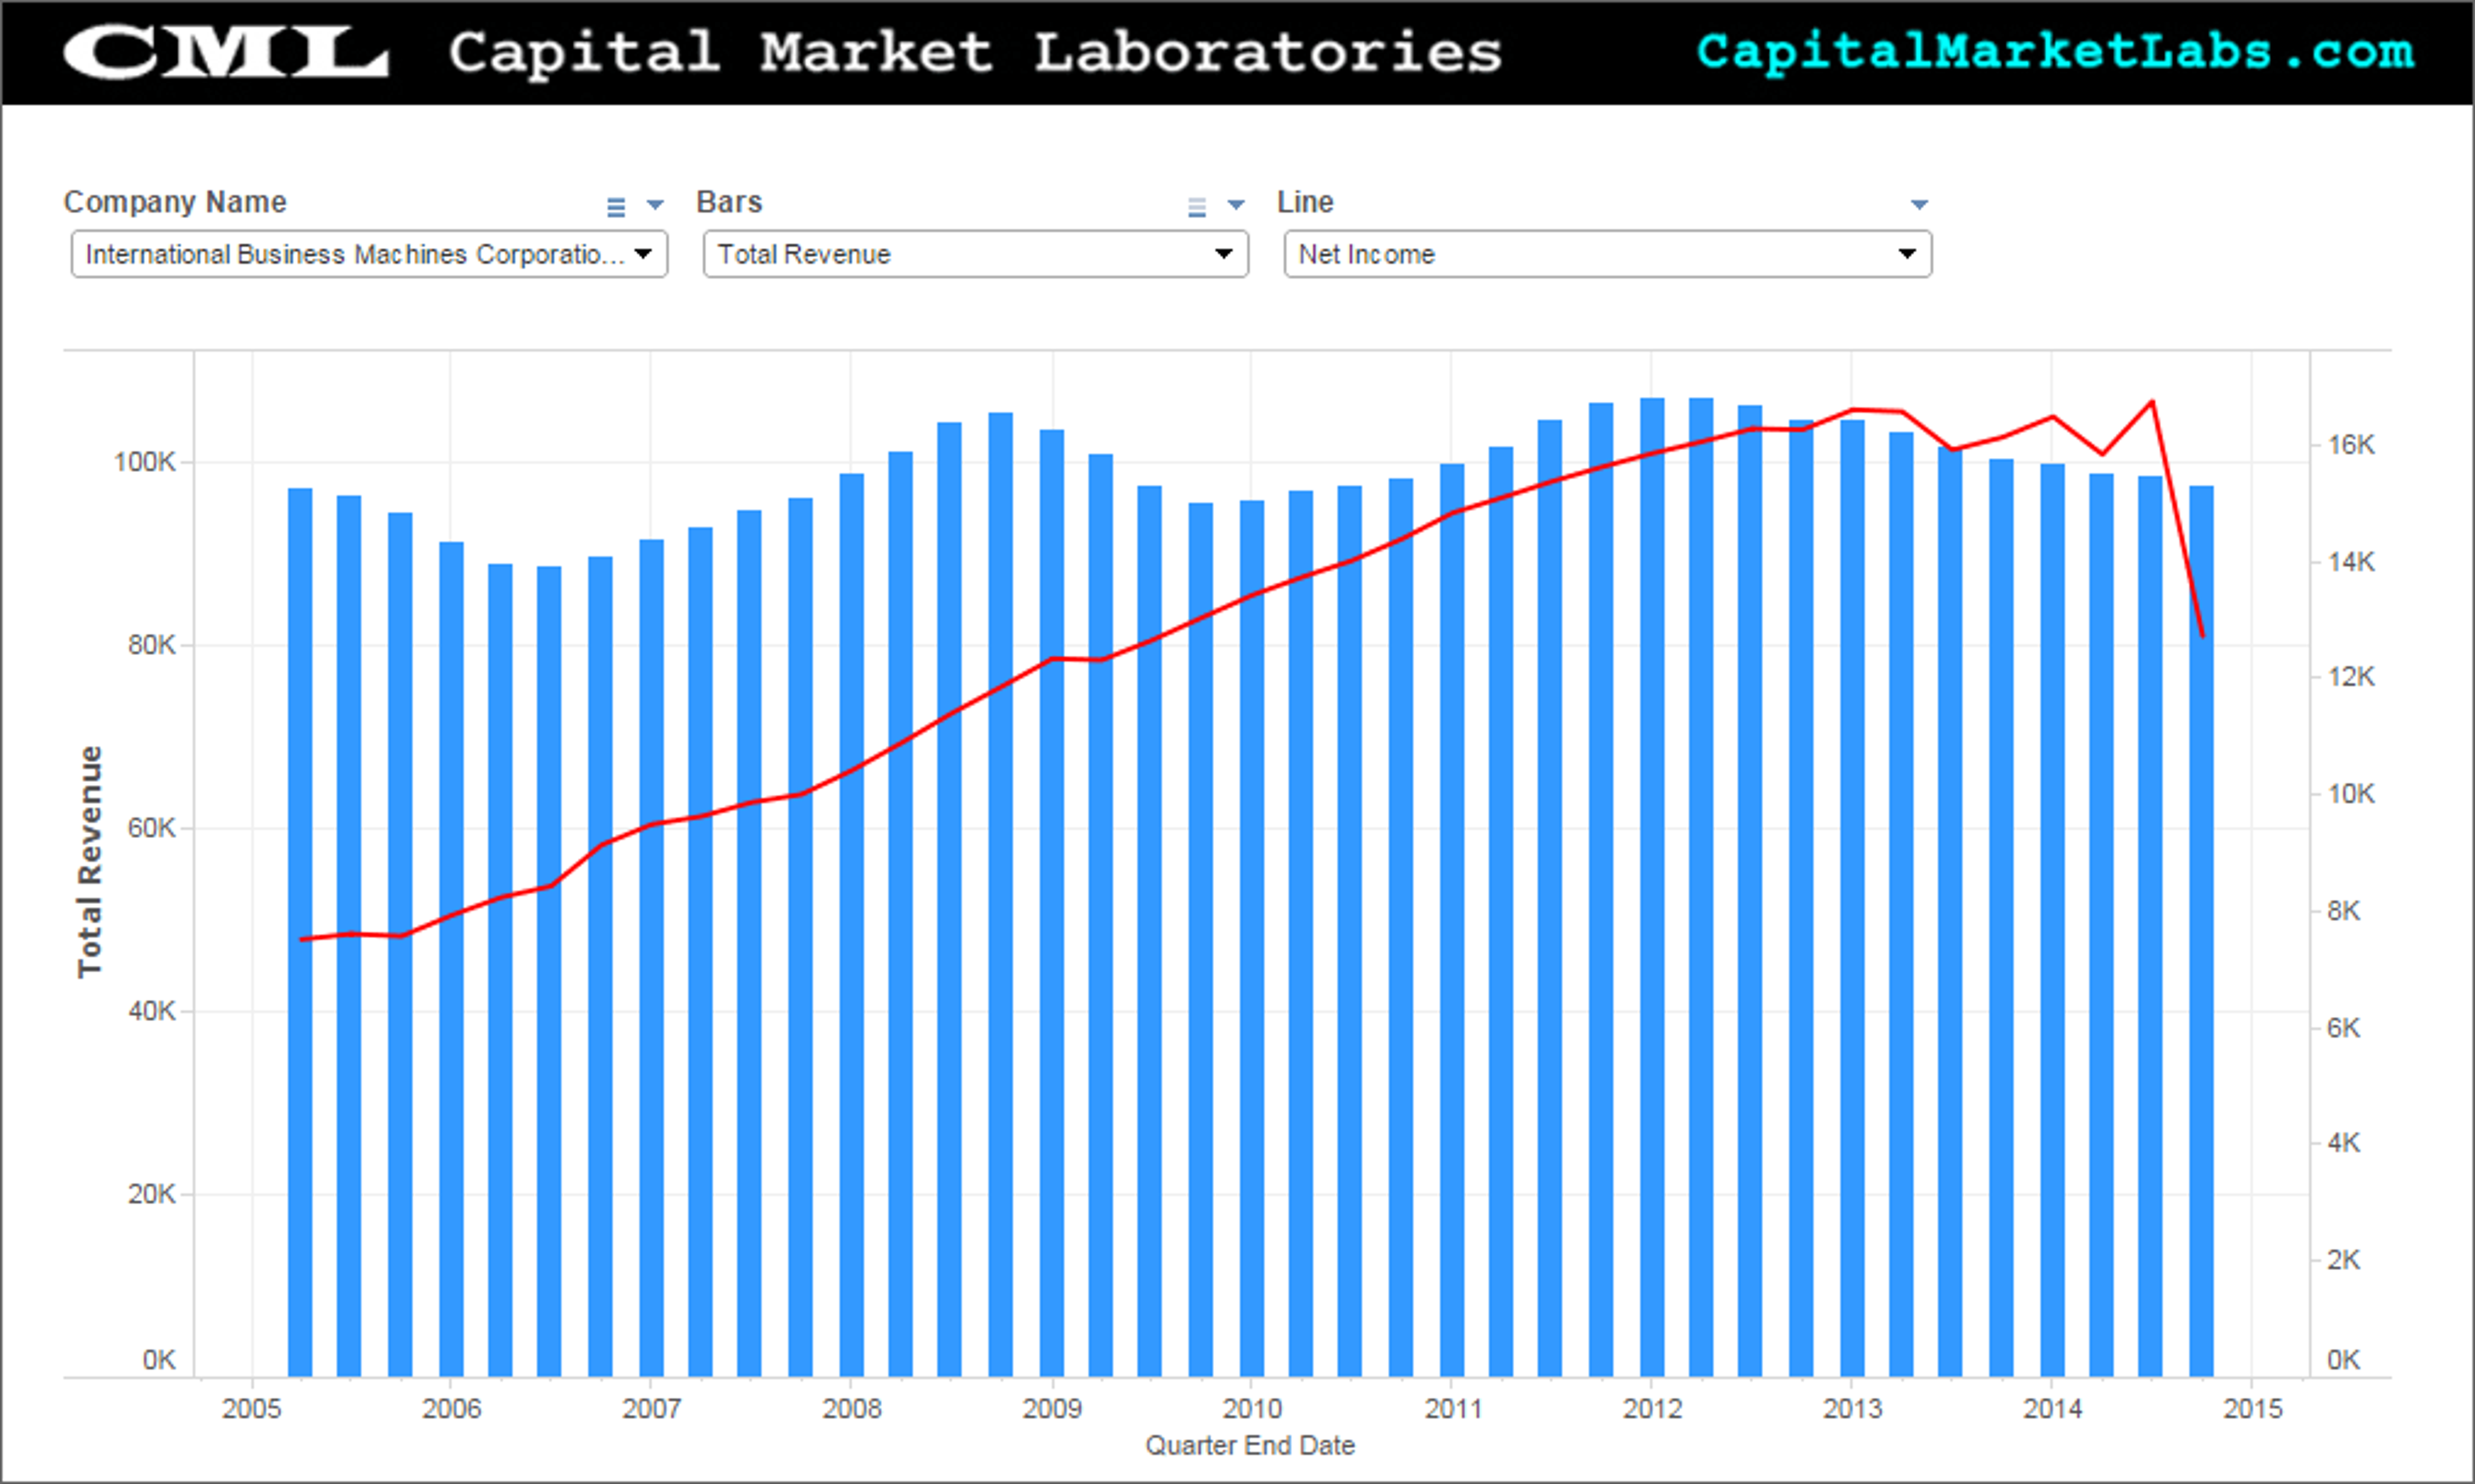
Despite a top line that was essentially flat-lining, IBM was able to crank out growth in the bottom line for many years as this time series of net income and total revenue shows.

One way that this was achieved was by paying less in taxes.
Between 2005 and 2014, IBM saw its effective tax rate cut in half. This time series shows the correlation between a declining effective tax rate and an increasing net income.
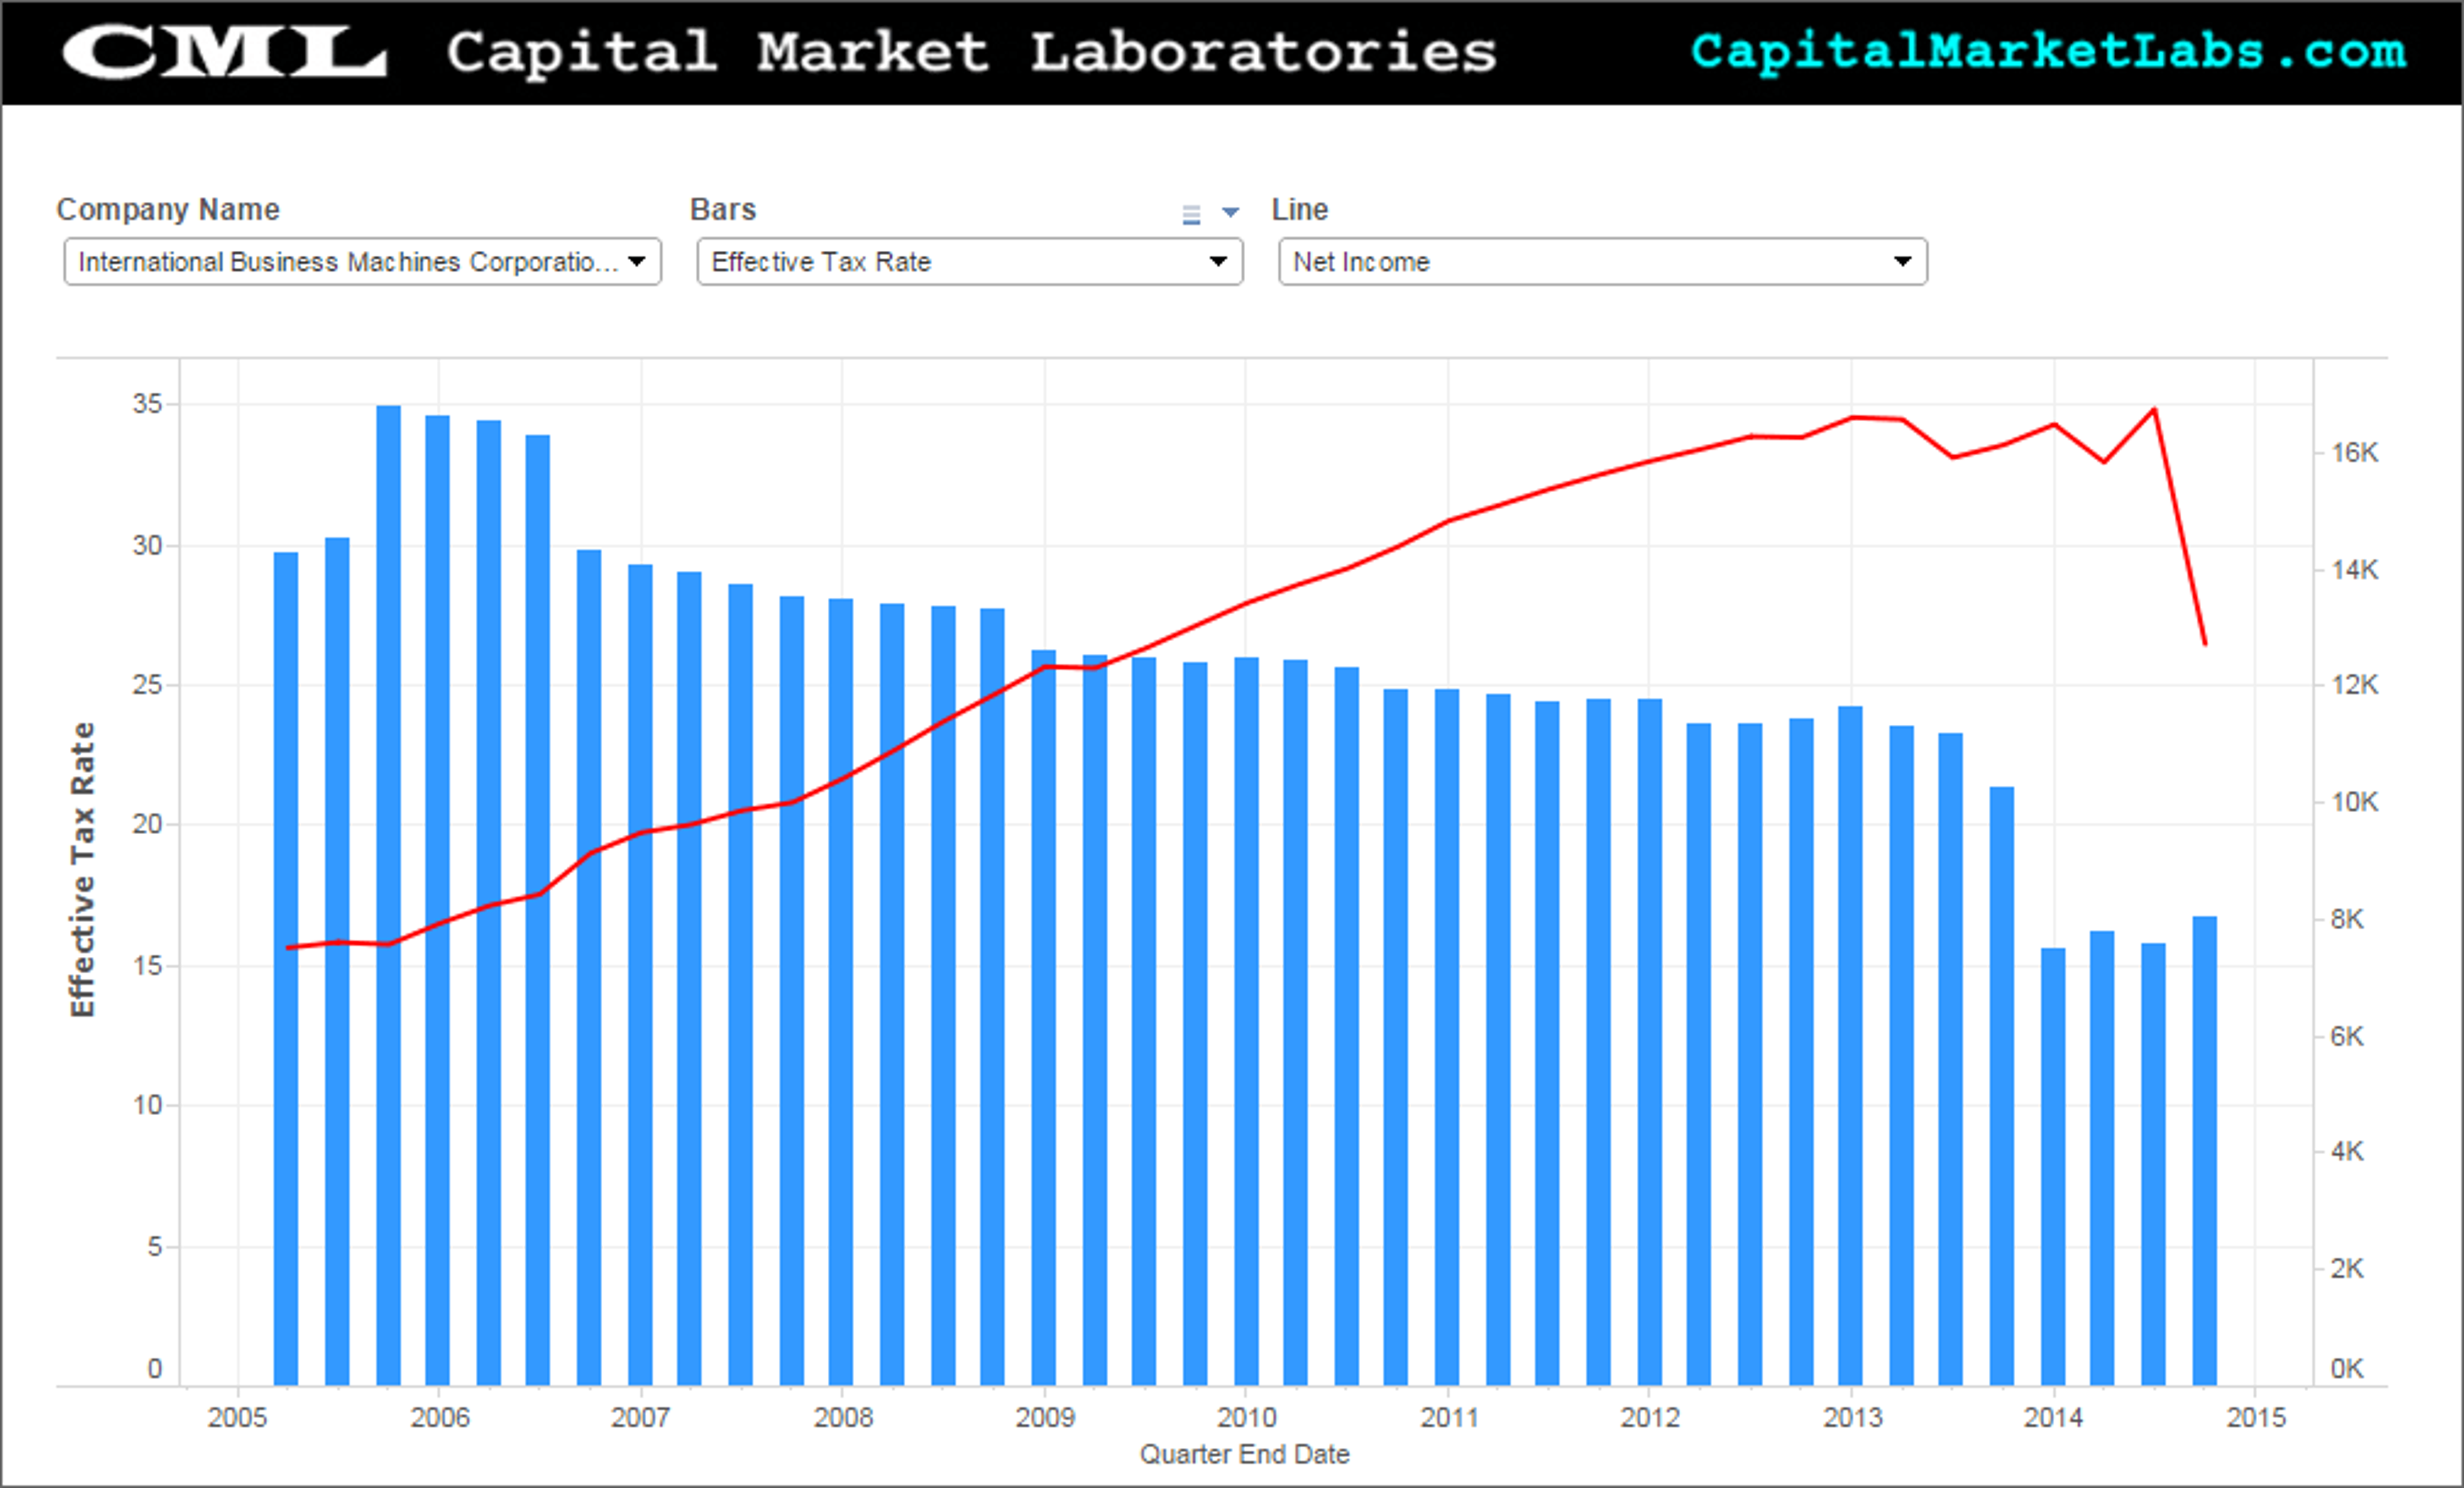
As effective tax rate bottomed out in 2014 and started to rise, net income faltered contributing to the price decline mentioned earlier.
One way to combat weakness in stock price is to buy back shares, and IBM has done just that. In fact, as this chart shows, stock repurchases in 2014 were exceeding cash from operations.
This, of course, is unsustainable in the long run. In just one other time period (of ten years) have repurchases exceeded cash from operations.


This scatter plot of IT companies, with cash from operations on the x-axis and repurchases on the y-axis, shows just how rare it is for companies to have repurchases in excess of cash from operations.
Even Apple -- in the midst of what is almost certainly the largest repurchase in history -- is not exceeding its cash from operations.


If the company isn’t generating enough cash from its operations to fund its buybacks, where does the money come from? Obviously, it can use whatever cash it may have on hand, or it can borrow.
In fact, IBM has seen a huge increase in its debt to equity ratio over time, but particularly in the last year.


This chart of IT companies -- with total equity on the x-axis and total debt on the y-axis -- really underscores how much of an outlier IBM has become, in a negative way. The following graphic highlights the companies where debt exceeds equity in yellow; they are all much smaller in scale compared to IBM.


IBM has been unable to generate top line growth for the past decade. This has made it increasingly difficult for the company to generate bottom line growth, and in fact, net income growth has finally turned negative.
One response to this -- and the resulting decline in stock price -- has been to increase repurchases dramatically. But this appears unsustainable.
IBM has increased its debt load dramatically over time, only adding its bottom line difficulties.
Tom White can be found on Twitter @tbwhite67.
Image credit: Alfred Lui, Flickr
© 2024 Benzinga.com. Benzinga does not provide investment advice. All rights reserved.
Trade confidently with insights and alerts from analyst ratings, free reports and breaking news that affects the stocks you care about.

