Costco Wholesale Corporation COST was trading slightly higher heading into its second-quarter financial results, set to print after the market close on Thursday.
When the membership-only, big-box retailer printed its first-quarter results on Dec. 8, the stock was volatile the following day before closing that session near to flat.
For that quarter, Costco reported earnings per share of $3.07 on revenues of $53.44 billion, which missed the consensus estimate of $3.11 per share and revenues of $58.36 billion.
For the second quarter, analysts estimate Costco will report earnings of $3.21 per share on revenues of $55.54 billion.
Heading into the event, Tesley Advisory Group analyst Joseph Feldman reiterated its Outperform rating on Costco and maintained a price target of $580.
The reaction Costco receives post-earnings is likely to be the deciding factor on whether the stock will trade in a bullish or bearish pattern for the time being, because Costco is trading in a downtrend but could be settling into a bullish inverted head-and-shoulder pattern.
Of course, holding stocks or options over an earnings print is akin to gambling because stocks can react bullishly to an earnings miss and bearishly to an earnings beat. Options traders, particularly those who are holding close dated calls or puts, take on extra risk because the institutions writing the options increase premiums to account for implied volatility.
Want direct analysis? Find me in the BZ Pro lounge! Click here for a free trial.
The Costco Chart: Costco may be forming a large inverted head-and-shoulders pattern with the left shoulder formed between Aug. 18, 2022 and Nov. 30, 2022, the head formed between the latter date and Feb. 2, and the first downturn of the right shoulder forming over the trading days since.
If Costco soars up to the neckline and breaks up through the area on higher-than-average volume, the measured move is about 20%, which suggests Costco could surge up toward the $560 area.
- For the time being, Costco is trading in a downtrend, making a series of lower highs and lower lows. Costco’s most recent higher low was printed on Monday at $493 and the most recent lower low was created at the $475.02 mark on Wednesday.
- If the stock suffers a bearish reaction to its earnings print, the downtrend is likely to continue and if Costco plunges under $447.90, the bullish head-and-shoulders will be negated.
- If Costco enjoys a bullish reaction to its earnings print and spikes up above $496, the downtrend will be negated and the stock will regain support at the 200-day simple moving average, which would be bullish.
- Costco has resistance above at $491.83 and $507.42 and support below at $481.23 and $469.77.

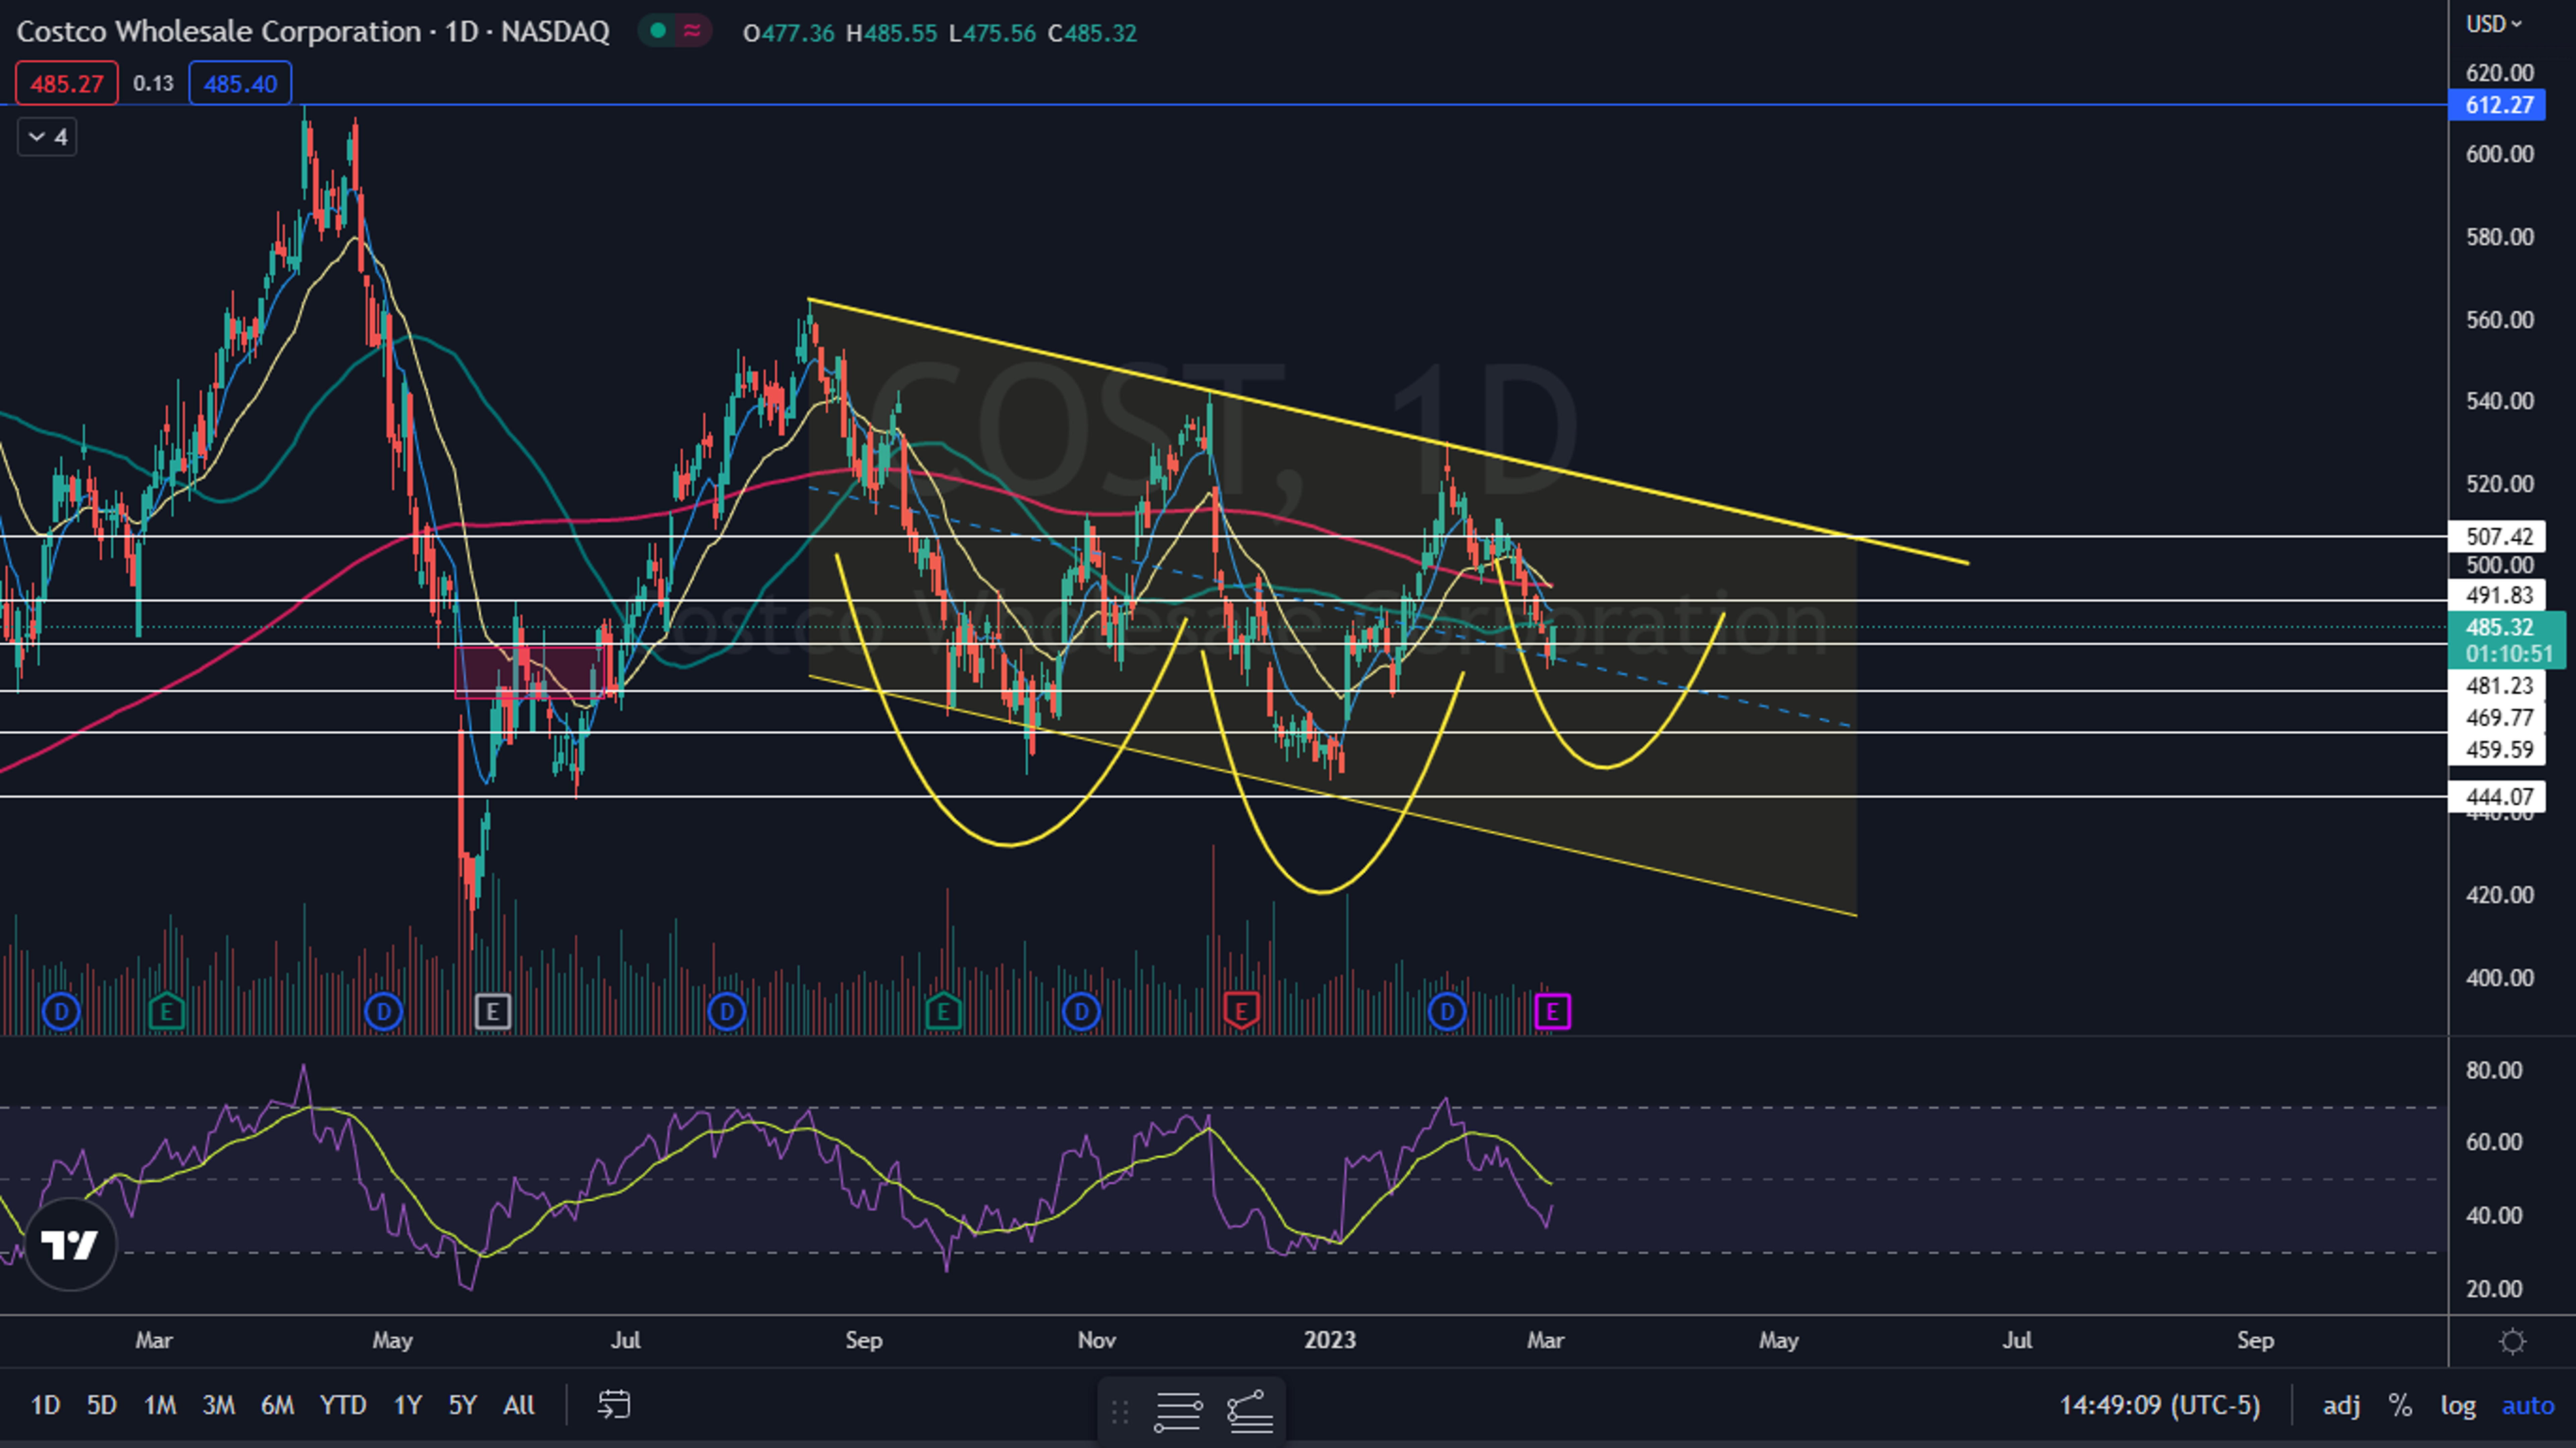
Photo: Shutterstock
© 2024 Benzinga.com. Benzinga does not provide investment advice. All rights reserved.
Trade confidently with insights and alerts from analyst ratings, free reports and breaking news that affects the stocks you care about.

