


The fall ended at a higher low and the FOMC decision seems to have given it renewed strength. But will it go higher from here? The technicals are lining up to say yes. There are 3 things to focus on in this chart of the US Dollar Index.

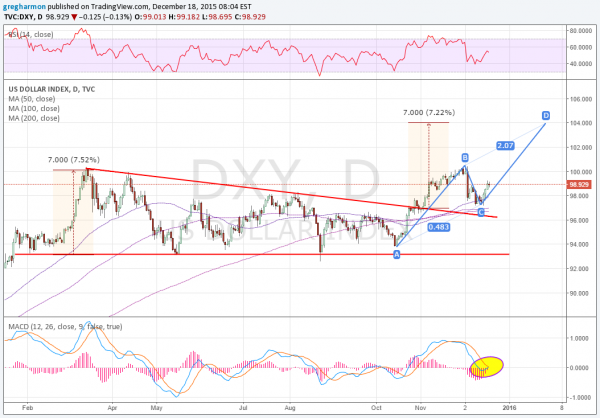
First is the long descending triangle with support at 93.25. The Dollar Index broke above this triangle to start November and set up a target on that pattern break to 104. The second is from how that early December pullback formed. The reversal back higher this week creates an AB=CD pattern. And the target for that is 103.97. Coincidence? Finally the momentum indicators are flashing bullish. The RSI at the top held the bullish zone on the pullback and is rising again. The MACD at the bottom is about to cross up, a bullish signal.
Want to learn more about Dragonfly Capital Views? Dragonfly Capital Views Performance Through November 2015 and sign up here
If you like what you see above sign up for deeper analysis and trading strategy by using the Get Premium button. As always you can see details of individual charts and more on my StockTwits page. The information in this blog post represents my own opinions and does not contain a recommendation for any particular security or investment. I or my affiliates may hold positions or other interests in securities mentioned in the Blog, please see my Disclaimer page for my full disclaimer.
© 2024 Benzinga.com. Benzinga does not provide investment advice. All rights reserved.
Trade confidently with insights and alerts from analyst ratings, free reports and breaking news that affects the stocks you care about.

