


Loading...
Loading...

( click to enlarge )
Yamana Gold Inc. AUY stock has been in a downtrend since its all-time high of $18.16, marked in March. Both short and medium-term trends are also down for the stock. Nevertheless, the stock is hovering just above its long-term support band between $12.31 and $12.7. Investors with short and medium-term perspectives can hold the stock with stop-loss at $12.31.

( click to enlarge )
From a short-term perspective, Barrick Gold Corporation ABX stock is reversing higher, taking support at 36. It can encounter resistance at 39 and then in the 40.5 -41 range. Failure to move beyond the 39 level in the next sessions will be a cue for short-term investors to divest their holdings. Resumption of the downtrend can pull ABX down to its support, which is in the band between 35 and 35.6.
( click to enlarge )
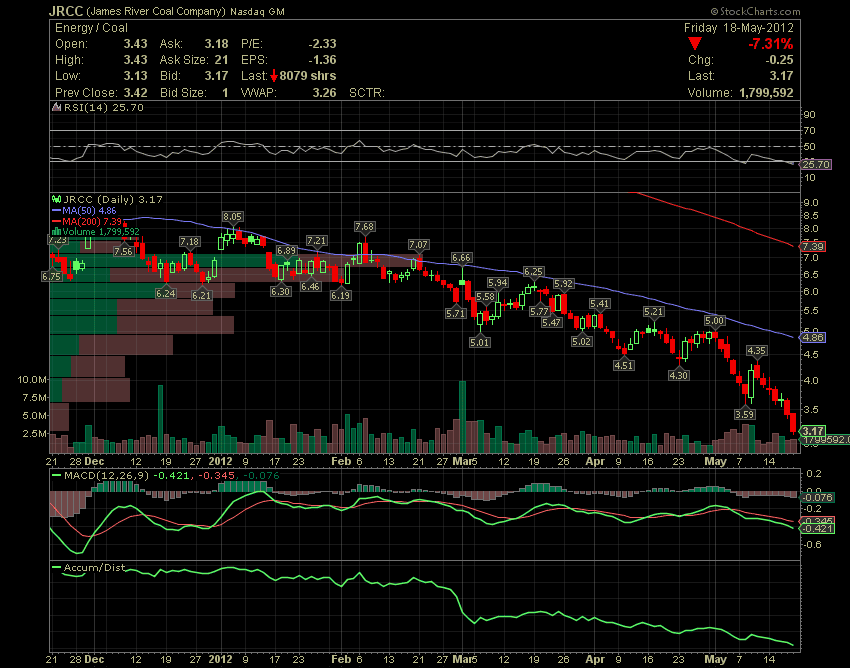
James River Coal Company JRCC stock has been in a downtrend, in all-time frames long, medium and short-terms. I don't see any initial signs of trend-reversal in this stock. Only a decisive daily close above 3.6 will mitigate the stock's short-term downtrend and push the stock higher to 4 and later on to 4.3

( click to enlarge )
Career Education Corp. CECO stock has been on a short-term uptrend from its lows and the trend looks quite strong to me. Investors with a short/medium-term horizon can hold the stock with stop-loss at 6 and for the long-term with deeper stop at 5.88 levels. Significant jump above 7 can take the stock northwards to 7.4 or even to 7.85.
Loading...
Loading...

( click to enlarge )
Zynga Inc ZNGA The trend is clearly downwards. The stock broke down its major support on Friday on increased volume. Not a pretty picture. Long positions must be avoided.

( click to enlarge )
Finally, lets take a look at Elan Corporation, plc ELN and see if the stock is worth buying.
- The technical chart shows the stock is on a bull market as the stock is trading above both the 200-day moving average.
- The 50-day moving average still on top over 200-day moving average
- MACD Fast Line has just crossed over the slow line, which is a bullish sign.
- RSI shows the stock may be ready for a rebound
Nevertheless the short term trend is still weak as the stock has been trading below 50 day and 20 day MA, with 20 day MA now going downward showing bearish signal. Immediate resistance is at 13.39. A break above that area could trigger further upside recovery testing 13.84. Conversely, a plunge below 12.58 will drag the stock down to 12.10 or 11.90 range. Trend : Neutral-Bullish.
During the day I tweet many times to my readers. I encourage everybody to subscribe AC Investor Blog twitter and newsletter, so you can receive my trade ideas and stock news in real time.


Loading...
Loading...
© 2024 Benzinga.com. Benzinga does not provide investment advice. All rights reserved.
Posted In: Trading Ideas
Benzinga simplifies the market for smarter investing
Trade confidently with insights and alerts from analyst ratings, free reports and breaking news that affects the stocks you care about.
Join Now: Free!
Already a member?Sign in

