


HOUSTON, July 27, 2015 /PRNewswire/ -- Southwestern Energy Company SWN today announced its financial and operating results for the quarter ended June 30, 2015. Second quarter highlights include:
- Record production of 245 Bcfe, including 2 Bcfe associated with the East Texas and Arkoma assets that were divested during the second quarter;
- Total Appalachia net production of 122 Bcfe, comprised of 87 Bcf from Northeast Appalachia (a 43% increase compared to year-ago levels) and 35 Bcfe from Southwest Appalachia;
- Increased 2015 production guidance to 973 Bcfe to 982 Bcfe, including 6 Bcfe associated with the asset divestiture noted above, while decreasing 2015 capital expenditures guidance to $1.875 billion;
- Expanded firm transportation and sales portfolio in Southwest Appalachia, bringing long-term takeaway capacity to approximately 800 million cubic feet per day and additional firm sales enabling robust growth in 2016 and 2017;
- Early well results in Southwest Appalachia significantly outperforming offset wells;
- Favorable results from test wells in unproven acreage of Northeast Appalachia;
- Adjusted net loss attributable to common stock (a non-GAAP measure reconciled below) of $9 million, or $0.02 per diluted share when excluding a non-cash ceiling test impairment of natural gas and oil properties and certain other items; and
- Net cash provided by operating activities before changes in operating assets and liabilities (a non-GAAP measure reconciled below) of approximately $339 million.
"The second quarter presented challenges to the energy industry, but just as we have done historically, Southwestern Energy delivered another strong quarter," remarked Steve Mueller, Chairman and Chief Executive Officer of Southwestern Energy. "We have increased guidance on our already record production levels, reduced our 2015 capital investments, added new economic locations and after only seven months, are operationally performing alongside the best in our industry in our newest acquisition in southwest Appalachia. Our low cost structure and our unique portfolio continues to demonstrate our ability to thrive in an environment where many in the industry are focusing on how to survive. The operational momentum that we have built in 2015 is setting up an enduring future of delivering significant returns for our shareholders."
Second Quarter of 2015 Financial Results
For the second quarter of 2015, Southwestern reported an adjusted net loss attributable to common stock of $9 million, or $0.02 per diluted share, when excluding a non-cash ceiling test impairment of natural gas and oil properties of $1.5 billion ($944 million net of taxes) and certain other items typically excluded by the investment community in published estimates, which in aggregate decreased net income by $806 million or $2.11 per share (diluted) on an after-tax basis. Including these items, the net loss attributable to common stock for the second quarter of 2015 was $815 million, or $2.13 per diluted share (reconciled below). For the second quarter of 2014, Southwestern reported net income attributable to common stock and adjusted net income attributable to common stock of $207 million, or $0.59 per diluted share (reconciled below).
Net cash provided by operating activities before changes in operating assets and liabilities (reconciled below) was $339 million for the second quarter of 2015, compared to $579 million for the same period in 2014. On a GAAP basis, net cash provided by operating activities was $399 million for the second quarter of 2015, compared to $585 million in the second quarter of 2014.
The second quarter of 2014 includes the operating results from our gathering system in northeast Pennsylvania and our conventional E&P assets in East Texas and the Arkoma basin which were divested during the second quarter of 2015. The second quarter of 2015 includes the results from these assets up to the date of divestiture. See "Divestitures" below for additional information.
E&P Segment – The operating loss from the company's E&P segment was $104 million for the second quarter of 2015 (reconciled below), when excluding the non-cash impairment, compared to operating income of $275 million for the same period in 2014. The decrease was primarily due to lower realized natural gas prices and increased operating costs and expenses from higher activity levels, partially offset by the revenue impacts of higher production volumes. On a GAAP basis, the operating loss from the company's E&P segment was $1.6 billion for the second quarter of 2015, down from operating income of $275 million during the second quarter of 2014.
Gas, oil and NGL production totaled 245 Bcfe in the second quarter of 2015, up 30% from 189 Bcfe in the second quarter of 2014. The quarter included 121 Bcf from the Fayetteville Shale, 87 Bcf from Northeast Appalachia and 35 Bcfe from Southwest Appalachia. This compares to 124 Bcf from the Fayetteville Shale and 61 Bcf from Northeast Appalachia in the second quarter of 2014.
Including the effect of hedges, Southwestern's average realized gas price in the second quarter of 2015 was $2.23 per Mcf, down from $3.77 per Mcf in the second quarter of 2014. The company's commodity hedging activities increased its average realized gas price by $0.47 per Mcf during the second quarter of 2015, compared to a decrease of $0.17 per Mcf during the same period in 2014. As of July 23, 2015, the company had approximately 121 Bcf of its remaining 2015 forecasted gas production hedged at an average price of $4.40 per Mcf.
Like most producers, the company typically sells its natural gas at a discount to NYMEX settlement prices. This discount includes a basis differential, third-party transportation charges and fuel charges. Disregarding the impact of hedges, the company's average price received for its gas production during the second quarter of 2015 was approximately $0.88 per Mcf lower than average NYMEX settlement prices, compared to approximately $0.73 per Mcf lower during the second quarter of 2014. As of July 23, 2015, the company had protected approximately 163 Bcf of its remaining 2015 expected gas production from the potential of widening basis differentials through hedging activities and sales arrangements at an average basis differential to NYMEX gas prices of approximately ($0.24) per Mcf.
Lease operating expenses per unit of production for the company's E&P segment were $0.93 per Mcfe in the second quarter of 2015, compared to $0.90 per Mcfe in the second quarter of 2014. The increase was primarily due to higher operating costs in Southwest Appalachia associated with liquids production.
General and administrative expenses per unit of production were $0.21 per Mcfe in the second quarter of 2015, compared to $0.23 per Mcfe in the second quarter of 2014, down primarily due to the increase in production volumes.
Taxes other than income taxes were $0.10 per Mcfe in the second quarter of 2015, compared to $0.11 per Mcfe in the second quarter of 2014. Taxes other than income taxes per Mcfe vary from period to period due to changes in severance and ad valorem taxes that result from the mix of the company's production volumes and fluctuations in commodity prices.
The company's full cost pool amortization rate increased to $1.13 per Mcfe in the second quarter of 2015, compared to $1.09 per Mcfe in the second quarter of 2014. The amortization rate is impacted by the timing and amount of reserve additions and the costs associated with those additions, revisions of previous reserve estimates due to both price and well performance, write-downs that result from full cost ceiling tests, proceeds from the sale of properties that reduce the full cost pool and the levels of costs subject to amortization. The company cannot predict its future full cost pool amortization rate with accuracy due to the variability of each of the factors discussed above, as well as other factors.
Midstream Services – Operating income, excluding the gain on sale of assets divested, for the company's Midstream Services segment, which is comprised of gathering and marketing activities, was $77 million for the second quarter of 2015, down 17% from $93 million for the same period in 2014 (reconciled below). The decrease in operating income was primarily due to the 2015 divestiture of the gathering system in northeast Pennsylvania. On a GAAP basis, operating income for the Midstream Services segment was $355 million for the second quarter of 2015, compared to $93 million for the second quarter of 2014. At June 30, 2015, the company's midstream segment was gathering approximately 2.2 Bcf per day through 2,036 miles of gathering lines in the Fayetteville Shale.
First Six Months of 2015 Financial Results
For the first six months of 2015, Southwestern reported adjusted net income attributable to common stock, which includes the impact of the theoretical income allocation to preferred stock of $13 million, of $74 million, or $0.20 per diluted share, when excluding a non-cash ceiling test impairment of natural gas and oil properties of $1.5 billion ($944 million net of taxes) and certain other items typically excluded by the investment community in published estimates, which in aggregate decreased net income by $849 million or $2.24 per share (diluted) on an after-tax basis. Including these items, the net loss attributable to common stock for the first six months of 2015 was $762 million, or $2.01 per diluted share (reconciled below). For the first six months of 2014, Southwestern reported adjusted net income attributable to common stock of $438 million, or $1.24 per diluted share, when excluding a $62 million ($37 million net of taxes) loss on derivative contracts, net of settlements. Including this loss, Southwestern reported net income attributable to common stock of $401 million, or $1.14 per diluted share, for the first six months of 2014 (reconciled below).
Net cash provided by operating activities before changes in operating assets and liabilities (reconciled below) was $832 million for first six months of 2015, compared to $1.2 billion for the same period in 2014. On a GAAP basis, net cash provided by operating activities was $940 million for the first six months of 2015, compared to $1.2 billion for the first six months of 2014.
E&P Segment – The operating loss from the company's E&P segment was $26 million for the first six months of 2015 (reconciled below), when excluding the non-cash impairment, compared to operating income of $627 million for the same period in 2014. The decrease was primarily due to lower realized natural gas prices and increased operating costs and expenses from higher activity levels, partially offset by the revenue impacts of higher production volumes. On a GAAP basis, the operating loss from the company's E&P segment was $1.6 billion for the first six months of 2015, down from operating income of $627 million during the first six months of 2014.
Gas, oil and NGL production totaled 478 Bcfe in the first six months of 2015, up 29% from 371 Bcfe in the first six months of 2014. The first six months of 2015 included 236 Bcf from the Fayetteville Shale, 170 Bcf from Northeast Appalachia and 65 Bcfe from Southwest Appalachia. This compares to 243 Bcf from the Fayetteville Shale and 119 Bcf from Northeast Appalachia in the first six months of 2014.
Including the effect of hedges, Southwestern's average realized gas price in the first six months of 2015 was $2.60 per Mcf, down from $3.98 per Mcf in the first six months of 2014. The company's commodity hedging activities increased its average realized gas price by $0.41 per Mcf during the first six months of 2015, compared to a decrease of $0.30 per Mcf during the same period in 2014. Disregarding the impact of hedges, the average price received for the company's gas production during the first six months of 2015 was approximately $0.62 per Mcf lower than average monthly NYMEX settlement prices, compared to approximately $0.52 per Mcf during the first six months of 2014.
Lease operating expenses per unit of production for the company's E&P segment were $0.93 per Mcfe in the first six months of 2015, compared to $0.91 per Mcfe in the first six months of 2014. The increase was primarily due to higher operating costs in Southwest Appalachia associated with liquids production.
General and administrative expenses per unit of production were $0.22 per Mcfe in the first six months of 2015, compared to $0.24 per Mcfe in the first six months of 2014, down primarily due to the increase in production volumes.
Taxes other than income taxes were $0.11 per Mcfe during the first six months of 2015, compared to $0.12 per Mcfe in the first six months of 2014.
The company's full cost pool amortization rate increased to $1.14 per Mcfe in the first six months of 2015, compared to $1.10 per Mcfe in the first six months of 2014.
Midstream Services – Operating income, excluding the gain on sale of assets divested, for the company's Midstream Services segment was $165 million for the first six months of 2015, down 6% from $175 million for the same period in 2014 (reconciled below). The decrease in operating income was primarily due to the 2015 divestiture of the gathering system in northeast Pennsylvania and a decrease in gathered volumes in the Fayetteville Shale. On a GAAP basis, operating income for the Midstream Services segment was $443 million for the first six months of 2015, compared to $175 million for the first six months of 2014.
Capital Structure and Investments – At June 30, 2015, the company had approximately $4.5 billion in long-term debt, including a combined $676 million borrowed on its revolving credit facility and commercial paper program, which was down from the $800 million borrowed at the end of the first quarter. The company's debt-to-total capitalization ratio was 42% as of June 30, 2015.
During the first six months of 2015, excluding the $615 million of acquisition costs and post-closing adjustments for the Appalachia transactions that closed in December 2014 and January 2015, Southwestern invested a total of $971 million. This is down from $1.3 billion in the first six months of 2014 and included approximately $923 million invested in its E&P business, $38 million invested in its Midstream Services segment and $10 million invested for corporate and other purposes.
Divestitures
During the second quarter of 2015, the company closed the previously announced transactions to sell its gathering system in northeast Pennsylvania and its conventional E&P assets in East Texas and the Arkoma basin.
The northeast Pennsylvania gathering system generated operating income of less than $1 million and $12 million for the three and six months ended June 30, 2015, compared to operating income of $10 million and $19 million for the three and six months ended June 30, 2014. For the three and six months ended June 30, 2015, this gathering system generated net cash provided by operating activities of less than $1 million and $14 million, respectively. For the three and six months ended June 30, 2014, this gathering system generated net cash provided by operating activities of approximately $11 million and $22 million, respectively.
The conventional E&P assets in East Texas and the Arkoma basin had production of 2 Bcfe during the second quarter of 2015, compared to 4 Bcfe during the second quarter of 2014. For the first six months of 2015 and 2014, these assets had production of 6 Bcfe and 8 Bcfe, respectively. For the three and six months ended June 30, 2015, these assets generated an operating loss of approximately $1 million and operating income of $1 million, respectively, compared to operating income of $8 million and $19 million for the same periods of 2014.
Revised 2015 Capital Program and Production Guidance
As the company maintains its commitment to financial discipline, the capital investments planned for 2015 have been adjusted. The company currently expects its total capital investments for the full year of 2015, excluding the $615 million of acquisition costs and post-closing adjustments for the Appalachia transactions that closed in December 2014 and January 2015, to be approximately $1.9 billion, down from its prior estimate in February 2015 of $2.0 billion. The following table provides the company's capital investments forecast for 2015 as compared to previously provided guidance.
|
Capital Investments | |||
|
Previous |
Updated | ||
|
2015 (1) |
2015 (1) | ||
|
(in millions) | |||
|
Northeast Appalachia |
$ 700 |
$ 605 | |
|
Southwest Appalachia |
520 |
510 | |
|
Fayetteville Shale |
560 |
560 | |
|
Exploration, Sand Wash and Brown Dense |
110 |
85 | |
|
Midstream Services |
85 |
80 | |
|
E&P Services & Corporate |
40 |
35 | |
|
Total Capital Investments |
$ 2,015 |
$ 1,875 | |
|
(1) |
Excludes $615 million in acquisition costs and post-closing adjustments for the Appalachia transactions that closed in December 2014 and January 2015 | ||
Based on the strong performance of the portfolio for the first six months, the company has also updated its production guidance for 2015, including the impacts of the reduced capital investment program. The revised total gas and oil production guidance for 2015 of 973 to 982 Bcfe is an increase of approximately 27% over the company's 2014 gas and oil production. Of the company's total expected production in 2015, approximately 462 to 465 Bcf is expected to come from the Fayetteville Shale, approximately 363 to 366 Bcf is expected to come from Northeast Appalachia and 139 to 142 Bcfe is expected to come from Southwest Appalachia. The 2015 figures include approximately 6 Bcfe of production from the East Texas and Arkoma oil and gas assets, which were divested during the second quarter of 2015. The company's updated guidance for 2015 is shown below.
|
1st Quarter |
2nd Quarter |
3rd Quarter |
4th Quarter |
Total Year 2015 | ||||||||
|
Previous Guidance (Bcfe) |
225 - 228 |
230 - 234 |
238 - 242 |
247 - 251 |
940 - 955 | |||||||
|
New Guidance: |
||||||||||||
|
Retained Properties: |
||||||||||||
|
Production (Bcfe) |
229 |
243 |
246 - 250 |
249 - 254 |
967 - 976 | |||||||
|
Natural Gas (Bcf) |
215 |
224 |
227 - 230 |
229 - 234 |
895 - 903 | |||||||
|
Oil (MBbls) |
545 |
589 |
575 - 600 |
590 - 615 |
2,300 - 2,350 | |||||||
|
NGLs (MBbls) |
1,766 |
2,574 |
2,675 - 2,725 |
2,700 - 2,750 |
9,715 - 9,815 | |||||||
|
Divested Properties: |
||||||||||||
|
Production (Bcfe) |
4 |
2 |
- |
- |
6 | |||||||
|
Total Production (Bcfe) |
233 |
245 |
246 - 250 |
249 - 254 |
973 - 982 | |||||||
Estimated E&P Pricing Deductions in 2015
Average Gas Basis Differential and Transportation Charge $0.75 - $0.85 per Mcf
E&P Operations Review
During the first six months of 2015, Southwestern invested a total of approximately $923 million in its E&P business, excluding the acquisition costs and post-closing adjustments for the Appalachia transactions noted previously. This includes $320 million in Northeast Appalachia, $191 million in Southwest Appalachia, $343 million in the Fayetteville Shale, $1 million in its Ark-La-Tex division, $52 million in New Ventures, and $16 million in E&P Services.
Northeast Appalachia – In the second quarter of 2015, Southwestern placed 21 new wells on production in Northeast Appalachia and had net gas production of 87 Bcf, up 43% from 61 Bcf in the second quarter of 2014. Gross operated production in Northeast Appalachia was approximately 1,203 MMcf per day at June 30, 2015.
In the second quarter of 2015, the average 30th-day rate was 6,015 Mcf per day on 6 wells that had an average lateral length of 4,749 feet and an average cost of $5.8 million per well. This compares to an average 30th-day rate of 7,505 Mcf per day on 22 wells that had an average lateral length of 4,713 feet and an average cost of $5.8 million per well in the first quarter of 2015. The decrease in 30th-day rate from the first quarter was primarily due to location of activity.
Operational performance continues to improve in this area as the company once again decreased drilling times during the quarter. For the quarter, the company had an average time to drill to total depth of 9 days from re-entry to re-entry compared to 11 days in the first quarter of 2015. Included in the impressive drilling results for the quarter was a well with a lateral length of over 11,000 feet, the longest lateral drilled to date by Southwestern in northeast Pennsylvania. The company also drilled its fastest Marcellus well drilled to date with re-entry to re-entry of just over four days.
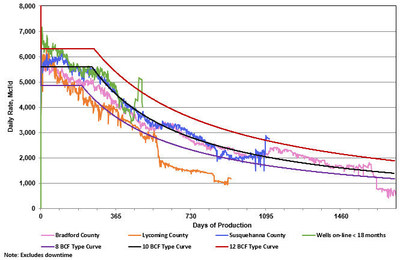
As of June 30, 2015, Southwestern had 368 operated wells on production and 85 wells in progress. Of the operated wells on production, 367 were horizontal wells of which 207 were located in Susquehanna County, 135 were located in Bradford County and 25 were located in Lycoming County. Of the 85 wells in progress, 42 were either waiting on completion or waiting to be placed to sales, including 33 in Susquehanna County, 5 in Bradford County and 4 wells in Sullivan, Tioga and Wyoming Counties, combined.
The graph below provides normalized average daily production data through June 30, 2015, for the horizontal wells drilled by the company in Northeast Appalachia. The "pink curve" indicates results for 135 wells in Bradford County, the "blue curve" indicates results for 207 wells in Susquehanna County, the "orange curve" indicates results for 25 wells in Lycoming County and the "green curve" indicates results for the 131 wells that have been put on production within the last 18 months. As a reminder, the production rates from all of our wells in Northeast Appalachia are managed to maximize the ultimate recovery from the wells. This is displayed in all of the curves in the relatively flat production for the first 365 days before the wells begin normal declines. The normalized production curves are intended to provide a qualitative indication of the company's Northeast Appalachia wells' performance and should not be used to estimate an individual well's estimated ultimate recovery. The 8, 10 and 12 Bcf type curves are shown solely for reference purposes and are not intended to be projections of the performance of the company's wells.

During the second quarter of 2015, the company also continued to make progress on the testing of various unproven areas of this acreage. The Karmazin 3H, located in far northeastern Susquehanna County, was also drilled and tested during the second quarter. The well, with a lateral length of 6,701 feet, provided encouraging results with a test rate of 8.8 million cubic feet per day. These results have added at least 35 drilling locations to Susquehanna County. Additional delineation wells are planned for the second half of 2015 in Susquehanna County.
Additionally, Southwestern further tested the Lepley 6H in Tioga County. While completing only 30% of the lateral, the well flowed at a restricted rate of 5 million cubic feet per day for 12 days, outperforming the expected production from the well over that period. The company now plans to move forward with the installation of infrastructure in preparation for additional development activities in the county.
The John Good 14H was drilled in Lycoming County, targeting the Geneseo formation. This well, with a lateral length of 6,750 feet, produced at a maximum rate of 9.5 million cubic feet per day during flowback. With these encouraging results, the company intends to further test additional Geneseo wells to determine its potential.
Southwest Appalachia – During the second quarter of 2015, the company's net production from the Southwest Appalachia was 35 Bcfe, 48% of which was natural gas. As the company continues its early development of this asset, top quartile results for time to drill, lateral lengths and productivity per foot are being achieved.
During the second quarter, the company drilled nine wells, with an average lateral length of 7,559 feet and average time to drill to total depth of 17 days from re-entry to re-entry. This drilling time represents a reduction of over two days since the first quarter while drilling over 12% longer average lateral lengths. Included in the drilling for the quarter were two wells with lateral lengths of over 12,000 feet. One of these wells was the longest lateral length Southwestern has ever drilled. Despite the record length of these wells, the company was able to drill within a targeted 10 to 15 foot zone 99% of the time. Staying in this targeted zone is a strong contributor to enhanced well results when compared to previous wells in this area.
Southwestern placed 10 wells on production in Southwest Appalachia in the second quarter. Results from these wells is shown in the table below.
|
Time Frame |
Wells Placed on Production |
Average Lateral Length |
Avg Rate |
30th-Day |
Avg Rate |
60th-Day |
|
2nd Qtr 2015 |
10 |
5,399 |
6,322 (10) |
51 / 13 / 36 |
9,216 (1) |
32 / 30 / 38 |
Included in the wells that were placed on production during the quarter were the first two wells that the company completed with enhanced completion techniques as compared to a typical completion design by the prior operator. With these completion changes, these wells have dramatically outperformed their offsets. On May 12th, the company placed on production its first well that was fully drilled and completed by Southwestern. The Robert Shorts WAS 5H, with a lateral length of 7,723 feet, was drilled 100% in the target landing interval and was completed with 260 foot stage spacing and 2,000 pounds of sand per foot, which is a 65% increase over prior practice. In this short period of time, this well has substantially outperformed its offsets and is on track to recover 15 Bcfe. Normalized for lateral length, this estimated ultimate recovery per lateral foot is 36% higher than the nearby offsets. For this first well drilled and completed by the company, the well cost was approximately $8.7 million, which would have been approximately $600 thousand lower when factoring in the service cost savings obtained by the company subsequent to this well being completed. This well cost compares to the $9.3 million well cost assumed during the acquisition due diligence.
The company is managing drawdown on the flowback of all of the new wells in this area. This method allows the preferential recovery of additional condensate versus natural gas by maintaining higher reservoir pressure. While this lowers the initial production rates for gas production, it improves condensate production in the first 180 days by 20%. This significantly improves the economics over the life of the wells and increased the PVI on these wells by approximately 20%.
As part of the plan for the third quarter, the company also intends to spud its first Utica well since acquiring this asset at a location in Marshall County, West Virginia, bracketed by high performing industry wells. First production is anticipated in late 2015 or early 2016.
As of June 30, 2015, Southwestern had 319 operated horizontal wells on production and 35 operated horizontal wells in progress. Of the operated horizontal wells on production, approximately 85% were in the wet gas portion of the acreage. Of the 35 wells in progress, 17 were waiting on completion. The company currently has three drilling rigs running, all company-owned.
During the second quarter of 2015, the company made significant progress in expanding its firm transportation capacity portfolio in Southwest Appalachia. An agreement was signed with Columbia Pipeline Group, securing 500 million cubic feet per day on the Mountaineer XPress pipeline with a portion of these volumes going to the Gulf Coast on the Gulf XPress pipeline. For these committed volumes, the agreement includes rates that were published in the open season for this project. This new pipeline has an estimated 2018 in service date and will be routed through much of the core of Southwestern's West Virginia acreage. This line will provide optionality as it will access the company's wet gas production from the Majorsville area and will allow the company to tie in future dry gas gathering systems. With this agreement and the previously announced Rover capacity, Southwestern has obtained long-term takeaway capacity of approximately 800 million cubic feet per day, with approximately 60% going to Gulf Coast markets. To date, the blended weighted average reservation charge of the transportation portfolio for all signed commitments is approximately $0.60 per MMBtu in Southwest Appalachia.
Additionally, if growth is assumed to be 35% per year in 2016 and 2017 in Southwest Appalachia, the company has already achieved its objective of covering at least 80% of the expected production with firm capacity or firm sales for both 2016 and 2017. The company continues to be engaged in discussion with a number of other counter parties for additional released capacity or firm sales opportunities.
Fayetteville Shale – In the second quarter of 2015, Southwestern's net gas production from the Fayetteville Shale was 121 Bcf, compared to 124 Bcf in the second quarter of 2014 and 115 Bcf in the first quarter of 2015. The 6 Bcf increase in net gas production from the first quarter of 2015 was primarily due to the timing of wells placed on production late in the first quarter. Gross operated gas production in the Fayetteville Shale was approximately 1,936 MMcf per day at June 30, 2015.
The 65 horizontal wells that were placed on production during the second quarter of 2015 had an average initial production rate of 4,439 Mcf per day, average completed well cost of $2.7 million per well, average horizontal lateral length of 5,881 feet and average time to drill to total depth of 6.9 days from re-entry to re-entry. This compares to the 99 horizontal wells that the company placed on production in the first quarter of 2015 that had an average initial production rate of 4,357 Mcf per day, an average horizontal lateral length of 5,875 feet, average time to drill to total depth of 7.2 days from re-entry to re-entry and an average completed well cost of $2.8 million per well.
Explanation and Reconciliation of Non-GAAP Financial Measures
The company reports its financial results in accordance with accounting principles generally accepted in the United States of America ("GAAP"). However, management believes certain non-GAAP performance measures may provide financial statement users with additional meaningful comparisons between current results and the results of its peers and of prior periods. These non-GAAP performance measures often exclude items typically excluded by the investment community in published estimates to improve comparability.
One such non-GAAP financial measure is net cash provided by operating activities before changes in operating assets and liabilities. Management presents this measure because (i) it is accepted as an indicator of an oil and gas exploration and production company's ability to internally fund exploration and development activities and to service or incur additional debt, (ii) changes in operating assets and liabilities relate to the timing of cash receipts and disbursements which the company may not control and (iii) changes in operating assets and liabilities may not relate to the period in which the operating activities occurred.
Additional non-GAAP financial measures the company may present from time to time are adjusted net income, adjusted diluted earnings per share, adjusted EBITDA and its E&P and Midstream segment operating income, all which exclude certain charges or amounts. Management presents these measures because (i) they are consistent with the manner in which the company's performance is measured relative to the performance of its peers, (ii) these measures are more comparable to earnings estimates provided by securities analysts, and (iii) charges or amounts excluded cannot be reasonably estimated and guidance provided by the company excludes information regarding these types of items. These adjusted amounts are not a measure of financial performance under GAAP.
See the reconciliations below of GAAP financial measures to non-GAAP financial measures for the three and six months ended June 30, 2015 and June 30, 2014. Non-GAAP financial measures should not be considered in isolation or as a substitute for the company's reported results prepared in accordance with GAAP.
|
3 Months Ended June 30, | |||
|
2015 |
2014 | ||
|
(in millions) | |||
|
Net income (loss) attributable to common stock: |
|||
|
Net income (loss) attributable to common stock |
$ (815) |
$ 207 | |
|
Add back (deduct): |
|||
|
Impairment of natural gas and oil properties (net of taxes) |
944 |
- | |
|
Gain on sale of assets (net of taxes) |
(170) |
- | |
|
Loss on certain derivatives (net of taxes) |
31 |
- | |
|
Transaction costs (net of taxes) |
1 |
- | |
|
Adjusted net income (loss) attributable to common stock |
$ (9) |
$ 207 | |
|
6 Months Ended June 30, | |||
|
2015 |
2014 | ||
|
(in millions) | |||
|
Net income attributable to common stock: |
|||
|
Net income (loss) attributable to common stock |
$ (762) |
$ 401 | |
|
Add back (deduct): |
|||
|
Participating securities – mandatory convertible preferred stock |
(13) |
- | |
|
Impairment of natural gas and oil properties (net of taxes) |
944 |
- | |
|
Gain on sale of assets (net of taxes) |
(170) |
- | |
|
Loss on certain derivatives (net of taxes) |
43 |
37 | |
|
Transaction costs (net of taxes) |
32 |
- | |
|
Adjusted net income attributable to common stock |
$ 74 |
$ 438 | |
|
3 Months Ended June 30, | |||
|
2015 |
2014 | ||
|
Diluted earnings per share: |
|||
|
Diluted earnings per share |
$ (2.13) |
$ 0.59 | |
|
Add back (deduct): |
|||
|
Impairment of natural gas and oil properties (net of taxes) |
2.47 |
- | |
|
Gain on sale of assets (net of taxes) |
(0.44) |
- | |
|
Loss on certain derivatives (net of taxes) |
0.08 |
- | |
|
Transaction costs (net of taxes) |
- |
- | |
|
Adjusted diluted earnings per share |
$ (0.02) |
$ 0.59 | |
|
6 Months Ended June 30, | |||
|
2015 |
2014 | ||
|
Diluted earnings per share: |
|||
|
Diluted earnings per share |
$ (2.01) |
$ 1.14 | |
|
Add back (deduct): |
|||
|
Participating securities – mandatory convertible preferred stock |
(0.03) |
- | |
|
Impairment of natural gas and oil properties (net of taxes) |
2.49 |
- | |
|
Gain on sale of assets (net of taxes) |
(0.45) |
- | |
|
Loss on certain derivatives (net of taxes) |
0.12 |
0.10 | |
|
Transaction costs (net of taxes) |
0.08 |
- | |
|
Adjusted diluted earnings per share |
$ 0.20 |
$ 1.24 | |
|
3 Months Ended June 30, | |||
|
2015 |
2014 | ||
|
(in millions) | |||
|
E&P segment operating income (loss): |
|||
|
E&P segment operating income (loss) |
$ (1,639 |
$ 275 | |
|
Add back (deduct): |
|||
|
Impairment of natural gas and oil properties |
1,535 |
- | |
|
E&P segment operating income (loss) excluding impairment of natural gas and oil properties |
$ (104) |
$ 275 | |
|
6 Months Ended June 30, | |||
|
2015 |
2014 | ||
|
(in millions) | |||
|
E&P segment operating income (loss): |
|||
|
E&P segment operating income (loss) |
$ (1,561) |
$ 627 | |
|
Add back (deduct): |
|||
|
Impairment of natural gas and oil properties |
1,535 |
- | |
|
E&P segment operating income (loss) excluding impairment of natural gas and oil properties |
$ (26) |
$ 627 | |
|
3 Months Ended June 30, | |||
|
2015 |
2014 | ||
|
(in millions) | |||
|
Midstream segment operating income: |
|||
|
Midstream segment operating income |
$ 355 |
$ 93 | |
|
Add back (deduct): |
|||
|
Gain on sale of assets |
(278) |
- | |
|
Midstream segment operating income excluding gain on sale of assets |
$ 77 |
$ 93 | |
|
6 Months Ended June 30, | |||
|
2015 |
2014 | ||
|
(in millions) | |||
|
Midstream segment operating income: |
|||
|
Midstream segment operating income |
$ 443 |
$ 175 | |
|
Add back (deduct): |
|||
|
Gain on sale of assets |
(278) |
- | |
|
Midstream segment operating income excluding gain on sale of assets |
$ 165 |
$ 175 | |
|
3 Months Ended June 30, | |||
|
2015 |
2014 | ||
|
(in millions) | |||
|
Cash flow from operating activities: |
|||
|
Net cash provided by operating activities |
$ 399 |
$ 585 | |
|
Add back (deduct): |
|||
|
Changes in operating assets and liabilities |
(60) |
(6) | |
|
Net cash provided by operating activities before changes in operating assets and liabilities |
$ 339 |
$ 579 | |
|
6 Months Ended June 30, | |||
|
2015 |
2014 | ||
|
(in millions) | |||
|
Cash flow from operating activities: |
|||
|
Net cash provided by operating activities |
$ 940 |
$ 1,194 | |
|
Add back (deduct): |
|||
|
Changes in operating assets and liabilities |
(108) |
2 | |
|
Net cash provided by operating activities before changes in operating assets and liabilities |
$ 832 |
$ 1,196 | |
Southwestern management will host a teleconference call on Tuesday, July 28, 2015 at 10:00 a.m. Eastern to discuss its second quarter 2015 results. The toll-free number to call is 877-407-8035 and the international dial-in number is 201-689-8035. The teleconference can also be heard "live" on the Internet at http://www.swn.com.
Southwestern Energy Company is an independent energy company whose wholly owned subsidiaries are engaged in natural gas and oil exploration, development and production, natural gas gathering and marketing. Additional information on the company can be found on the Internet at http://www.swn.com.
All statements, other than historical facts and financial information, may be deemed to be forward-looking statements within the meaning of Section 27A of the Securities Act of 1933, as amended, and Section 21E of the Securities Exchange Act of 1934, as amended. All statements that address activities, outcomes and other matters that should or may occur in the future, including, without limitation, statements regarding the financial position, business strategy, production and reserve growth and other plans and objectives for the company's future operations, are forward-looking statements. Although the company believes the expectations expressed in such forward-looking statements are based on reasonable assumptions, such statements are not guarantees of future performance and actual results or developments may differ materially from those in the forward-looking statements. The company has no obligation and makes no undertaking to publicly update or revise any forward-looking statements, other than to the extent set forth below. You should not place undue reliance on forward-looking statements. They are subject to known and unknown risks, uncertainties and other factors that may affect the company's operations, markets, products, services and prices and cause its actual results, performance or achievements to be materially different from any future results, performance or achievements expressed or implied by the forward-looking statements. In addition to any assumptions and other factors referred to specifically in connection with forward-looking statements, risks, uncertainties and factors that could cause the company's actual results to differ materially from those indicated in any forward-looking statement include, but are not limited to: the timing and extent of changes in market conditions and prices for natural gas and oil (including regional basis differentials); the company's ability to fund the company's planned capital investments; the company's ability to transport its production to the most favorable markets or at all; the timing and extent of the company's success in discovering, developing, producing and estimating reserves; the economic viability of, and the company's success in drilling, the company's large acreage position in various areas and, in particular, the Fayetteville Shale, Northeast Appalachia and Southwest Appalachia as well as relative to other productive shale gas plays; the company's ability to realize the expected benefits from recent acquisitions; the impact of title and environmental defects and other matters on the value of the properties acquired in the company's recent acquisitions and any other future acquisitions; difficulties in integrating the company's operations as a result of any significant acquisitions; the impact of government regulation, including any legislation relating to hydraulic fracturing, the climate or over-the-counter derivatives; the costs and availability of oil field personnel services and drilling supplies, raw materials and equipment, including pressure pumping equipment and crews; the company's ability to determine the most effective and economic fracture stimulation; the company's future property acquisition or divestiture activities; the effects of weather; increased competition and regulation; the financial impact of accounting regulations and critical accounting policies; the comparative cost of alternative fuels; the different risks and uncertainties associated with proposed activities in Canada; conditions in capital markets, changes in interest rates and the ability of the company's lenders to provide it with funds as agreed; credit risk relating to the risk of loss as a result of non-performance by the company's counterparties; and any other factors listed in the reports the company has filed and may file with the Securities and Exchange Commission (SEC). For additional information with respect to certain of these and other factors, see the reports filed by the company with the SEC. The company disclaims any intention or obligation to update or revise any forward-looking statements, whether as a result of new information, future events or otherwise.
|
OPERATING STATISTICS (Unaudited) |
Page 1 of 5 | |||||||||||
|
Southwestern Energy Company and Subsidiaries |
||||||||||||
|
For the three months ended |
For the six months ended | |||||||||||
|
June 30, |
June 30, | |||||||||||
|
2015 |
2014 |
2015 |
2014 | |||||||||
|
Exploration & Production |
||||||||||||
|
Production |
||||||||||||
|
Gas production (Bcf) |
226 |
189 |
445 |
371 | ||||||||
|
Oil production (MBbls) |
589 |
47 |
1,134 |
63 | ||||||||
|
NGL production (MBbls) |
2,574 |
7 |
4,340 |
16 | ||||||||
|
Total production (Bcfe) |
245 |
189 |
478 |
371 | ||||||||
|
Commodity Prices |
||||||||||||
|
Average realized gas price per Mcf, including hedges |
$ |
2.23 |
$ |
3.77 |
$ |
2.60 |
$ |
3.98 | ||||
|
Average realized gas price per Mcf, excluding hedges |
$ |
1.76 |
$ |
3.94 |
$ |
2.19 |
$ |
4.28 | ||||
|
Average oil price per Bbl |
$ |
40.88 |
$ |
103.27 |
$ |
36.08 |
$ |
102.55 | ||||
|
Average NGL price per Bbl |
$ |
5.77 |
$ |
37.78 |
$ |
7.63 |
$ |
44.36 | ||||
|
Summary of Derivatives Activity in the Statement of Operations |
||||||||||||
|
Settled Commodity Amounts included in "Operating Revenues" (in millions) |
$ |
53 |
$ |
(25) |
$ |
95 |
$ |
(67) | ||||
|
Settled Commodity Amounts included in "Gain (Loss) on Derivatives" (in millions) |
$ |
52 |
$ |
(8) |
$ |
88 |
$ |
(46) | ||||
|
Unsettled Commodity Amounts included in "Gain (Loss) on Derivatives" (in millions) |
$ |
(52) |
$ |
3 |
$ |
(70) |
$ |
(57) | ||||
|
Average unit costs per Mcfe: |
||||||||||||
|
Lease operating expenses |
$ |
0.93 |
$ |
0.90 |
$ |
0.93 |
$ |
0.91 | ||||
|
General and administrative expenses |
$ |
0.21 |
$ |
0.23 |
$ |
0.22 |
$ |
0.24 | ||||
|
Taxes, other than income taxes |
$ |
0.10 |
$ |
0.11 |
$ |
0.11 |
$ |
0.12 | ||||
|
Full cost pool amortization |
$ |
1.13 |
$ |
1.09 |
$ |
1.14 |
$ |
1.10 | ||||
|
Midstream |
||||||||||||
|
Volumes marketed (Bcfe) |
289 |
225 |
549 |
441 | ||||||||
|
Volumes gathered (Bcf) |
201 |
240 |
434 |
473 | ||||||||
|
STATEMENTS OF OPERATIONS (Unaudited) |
Page 2 of 5 | |||||||||||
|
Southwestern Energy Company and Subsidiaries |
||||||||||||
|
For the three months ended |
For the six months ended | |||||||||||
|
June 30, |
June 30, | |||||||||||
|
2015 |
2014 |
2015 |
2014 | |||||||||
|
(in millions, except share/per amounts) | ||||||||||||
|
Operating Revenues: |
||||||||||||
|
Gas sales |
$ |
457 |
$ |
717 |
$ |
1,082 |
$ |
1,510 | ||||
|
Oil sales |
24 |
5 |
41 |
6 | ||||||||
|
NGL sales |
15 |
– |
33 |
1 | ||||||||
|
Marketing |
222 |
266 |
447 |
538 | ||||||||
|
Gas gathering |
46 |
47 |
94 |
93 | ||||||||
|
764 |
1,035 |
1,697 |
2,148 | |||||||||
|
Operating Costs and Expenses: |
||||||||||||
|
Marketing purchases |
219 |
261 |
441 |
532 | ||||||||
|
Operating expenses |
176 |
101 |
331 |
201 | ||||||||
|
General and administrative expenses |
60 |
52 |
128 |
108 | ||||||||
|
Depreciation, depletion and amortization |
308 |
230 |
601 |
455 | ||||||||
|
Impairment of natural gas and oil properties |
1,535 |
– |
1,535 |
– | ||||||||
|
Gain on sale of assets, net |
(277) |
– |
(277) |
– | ||||||||
|
Taxes, other than income taxes |
27 |
24 |
57 |
50 | ||||||||
|
2,048 |
668 |
2,816 |
1,346 | |||||||||
|
Operating Income (Loss) |
(1,284) |
367 |
(1,119) |
802 | ||||||||
|
Interest Expense: |
||||||||||||
|
Interest on debt |
52 |
25 |
102 |
50 | ||||||||
|
Other interest charges |
3 |
– |
52 |
1 | ||||||||
|
Interest capitalized |
(54) |
(13) |
(102) |
(26) | ||||||||
|
1 |
12 |
52 |
25 | |||||||||
|
Other Income, Net |
3 |
– |
2 |
1 | ||||||||
|
Gain (Loss) on Derivatives |
1 |
(8) |
15 |
(108) | ||||||||
|
Income (Loss) Before Income Taxes |
(1,281) |
347 |
(1,154) |
670 | ||||||||
|
Provision (Benefit) for Income Taxes: |
||||||||||||
|
Current |
7 |
3 |
7 |
2 | ||||||||
|
Deferred |
(500) |
137 |
(451) |
267 | ||||||||
|
(493) |
140 |
(444) |
269 | |||||||||
|
Net Income (Loss) |
$ |
(788) |
$ |
207 |
$ |
(710) |
$ |
401 | ||||
|
Mandatory convertible preferred stock dividend |
27 |
– |
52 |
– | ||||||||
|
Net Income (Loss) Attributable to Common Stock |
$ |
(815) |
$ |
207 |
$ |
(762) |
$ |
401 | ||||
|
Earnings (Loss) Per Common Share: |
||||||||||||
|
Basic |
$ |
(2.13) |
$ |
0.59 |
$ |
(2.01) |
$ |
1.14 | ||||
|
Diluted |
$ |
(2.13) |
$ |
0.59 |
$ |
(2.01) |
$ |
1.14 | ||||
|
Weighted Average Common Shares Outstanding: | ||||||||||||
|
Basic |
382,114,011 |
351,391,582 |
378,797,446 |
351,307,527 | ||||||||
|
Diluted |
382,114,011 |
352,579,522 |
378,797,446 |
352,306,268 | ||||||||
|
BALANCE SHEETS (Unaudited) |
Page 3 of 5 | |||||
|
Southwestern Energy Company and Subsidiaries |
||||||
|
June 30, 2015 |
December 31, 2014 | |||||
|
(in millions) | ||||||
|
ASSETS |
||||||
|
Current assets |
$ |
699 |
$ |
1,115 | ||
|
Property and equipment |
23,549 |
22,557 | ||||
|
Less: Accumulated depreciation, depletion and amortization |
(10,934) |
(8,845) | ||||
|
Total property and equipment, net |
12,615 |
13,712 | ||||
|
Other long-term assets |
190 |
98 | ||||
|
Total assets |
13,504 |
14,925 | ||||
|
LIABILITIES AND EQUITY |
||||||
|
Current liabilities |
840 |
5,428 | ||||
|
Long-term debt |
4,539 |
2,466 | ||||
|
Deferred income taxes |
1,522 |
1,951 | ||||
|
Pension and other postretirement liabilities |
46 |
44 | ||||
|
Other long-term liabilities |
339 |
374 | ||||
|
Total liabilities |
7,286 |
10,263 | ||||
|
Equity: |
||||||
|
Common stock, $0.01 par value; authorized 1,250,000,000 |
4 |
4 | ||||
|
Preferred stock, $0.01 par value,10,000,000 shares authorized, 6.25% Series B Mandatory Convertible, $1,000 per share liquidation preference, 1,725,000 shares issued and outstanding |
– |
– | ||||
|
Additional paid-in capital |
3,384 |
1,019 | ||||
|
Retained earnings |
2,818 |
3,577 | ||||
|
Accumulated other comprehensive income |
13 |
62 | ||||
|
Common stock in treasury; 45,787 shares as of June 30, 2015 and 11,055 as of December 31, 2014 |
(1) |
– | ||||
|
Total equity |
6,218 |
4,662 | ||||
|
Total liabilities and equity |
$ |
13,504 |
$ |
14,925 | ||
|
STATEMENTS OF CASH FLOWS (Unaudited) |
Page 4 of 5 | |||||
|
Southwestern Energy Company and Subsidiaries |
||||||
|
For the six months ended | ||||||
|
June 30, | ||||||
|
2015 |
2014 | |||||
|
(in millions) | ||||||
|
Cash Flows From Operating Activities |
||||||
|
Net income (loss) |
$ |
(710) |
$ |
401 | ||
|
Adjustments to reconcile net income to net cash provided by operating |
||||||
|
Depreciation, depletion and amortization |
603 |
455 | ||||
|
Impairment of natural gas and oil properties |
1,535 |
– | ||||
|
Amortization of debt issuance cost |
49 |
2 | ||||
|
Deferred income taxes |
(451) |
267 | ||||
|
Loss on derivatives excluding derivatives, settled |
71 |
62 | ||||
|
Stock-based compensation |
12 |
9 | ||||
|
Gain on sale of assets, net |
(277) |
– | ||||
|
Change in assets and liabilities |
108 |
(2) | ||||
|
Net cash provided by operating activities |
940 |
1,194 | ||||
|
Cash Flows From Investing Activities |
||||||
|
Capital investments |
(974) |
(970) | ||||
|
Acquisitions |
(569) |
(174) | ||||
|
Proceeds from sale of property and equipment |
703 |
17 | ||||
|
Other |
10 |
3 | ||||
|
Net cash used in investing activities |
(830) |
(1,124) | ||||
|
Cash Flows From Financing Activities |
||||||
|
Payments on current portion of long-term debt |
(1) |
(1) | ||||
|
Payments on long-term debt |
(500) |
– | ||||
|
Payments on short-term debt |
(4,500) |
– | ||||
|
Payments on revolving credit facility |
(1,534) |
(2,486) | ||||
|
Borrowings under revolving credit facility |
1,804 |
2,375 | ||||
|
Payments on commercial paper |
(1,182) |
– | ||||
|
Borrowings under commercial paper |
1,288 |
– | ||||
|
Change in bank drafts outstanding |
(1) |
30 | ||||
|
Proceeds from issuance of long-term debt |
2,200 |
– | ||||
|
Debt issuance costs |
(17) |
– | ||||
|
Proceeds from exercise of common stock options |
– |
9 | ||||
|
Proceeds from issuance of common stock |
669 |
– | ||||
|
Proceeds from issuance of mandatory convertible preferred stock |
1,673 |
– | ||||
|
Mandatory convertible preferred stock dividend |
(25) |
– | ||||
|
Net cash used in financing activities |
(126) |
(73) | ||||
|
Decrease in cash and cash equivalents |
(16) |
(3) | ||||
|
Cash and cash equivalents at beginning of year |
53 |
23 | ||||
|
Cash and cash equivalents at end of period |
$ |
37 |
$ |
20 | ||
|
SEGMENT INFORMATION (Unaudited) |
Page 5 of 5 | ||||||||||||||
|
Southwestern Energy Company and Subsidiaries |
Exploration |
||||||||||||||
|
and |
Midstream |
||||||||||||||
|
Production |
Services |
Other |
Eliminations |
Total | |||||||||||
|
(in millions) | |||||||||||||||
|
Three months ended June 30, 2015 |
|||||||||||||||
|
Revenues |
$ |
490 |
766 |
– |
(492) |
764 | |||||||||
|
Marketing purchases |
– |
624 |
– |
(405) |
219 | ||||||||||
|
Operating expenses |
226 |
35 |
2 |
(87) |
176 | ||||||||||
|
General and administrative expenses |
52 |
9 |
(1) |
– |
60 | ||||||||||
|
Depreciation, depletion and amortization |
291 |
17 |
– |
– |
308 | ||||||||||
|
Impairment of natural gas and oil properties |
1,535 |
– |
– |
– |
1,535 | ||||||||||
|
(Gain) loss on sale of assets, net |
1 |
(278) |
– |
– |
(277) | ||||||||||
|
Taxes, other than income taxes |
24 |
4 |
(1) |
– |
27 | ||||||||||
|
Operating income (loss) |
(1,639) |
355 |
– |
– |
(1,284) | ||||||||||
|
Capital investments(1) |
389 |
19 |
7 |
– |
415 | ||||||||||
|
Three months ended June 30, 2014 |
|||||||||||||||
|
Revenues |
$ |
725 |
1,131 |
$ |
– |
$ |
(821) |
$ |
1,035 | ||||||
|
Marketing purchases |
– |
976 |
– |
(715) |
261 | ||||||||||
|
Operating expenses |
169 |
37 |
1 |
(106) |
101 | ||||||||||
|
General and administrative expenses |
43 |
9 |
– |
– |
52 | ||||||||||
|
Depreciation, depletion and amortization |
216 |
14 |
– |
– |
230 | ||||||||||
|
Taxes, other than income taxes |
22 |
2 |
– |
– |
24 | ||||||||||
|
Operating income (loss) |
275 |
93 |
(1) |
– |
367 | ||||||||||
|
Capital investments(1) |
676 |
36 |
9 |
– |
721 | ||||||||||
|
Six months ended June 30, 2015 |
|||||||||||||||
|
Revenues |
$ |
1,145 |
$ |
1,704 |
$ |
1 |
$ |
(1,153) |
$ |
1,697 | |||||
|
Marketing purchases |
– |
1,410 |
– |
(969) |
441 | ||||||||||
|
Operating expenses |
442 |
71 |
2 |
(184) |
331 | ||||||||||
|
General and administrative expenses |
108 |
20 |
– |
– |
128 | ||||||||||
|
Depreciation, depletion and amortization |
569 |
32 |
– |
– |
601 | ||||||||||
|
Impairment of natural gas and oil properties |
1,535 |
– |
– |
– |
1,535 | ||||||||||
|
(Gain) loss on sale of assets, net |
1 |
(278) |
– |
– |
(277) | ||||||||||
|
Taxes, other than income taxes |
51 |
6 |
– |
– |
57 | ||||||||||
|
Operating income (loss) |
(1,561) |
443 |
(1) |
– |
(1,119) | ||||||||||
|
Capital investments(1) |
1,419 |
157 |
10 |
– |
1,586 | ||||||||||
|
Six months ended June 30, 2014 |
|||||||||||||||
|
Revenues |
$ |
1,527 |
$ |
2,361 |
$ |
– |
$ |
(1,740) |
$ |
2,148 | |||||
|
Marketing purchases |
– |
2,061 |
– |
(1,529) |
532 | ||||||||||
|
Operating expenses |
340 |
72 |
– |
(211) |
201 | ||||||||||
|
General and administrative expenses |
89 |
19 |
– |
– |
108 | ||||||||||
|
Depreciation, depletion and amortization |
427 |
28 |
– |
– |
455 | ||||||||||
|
Taxes, other than income taxes |
44 |
6 |
– |
– |
50 | ||||||||||
|
Operating income |
627 |
175 |
– |
– |
802 | ||||||||||
|
Capital investments(1) |
1,175 |
75 |
13 |
– |
1,263 | ||||||||||
|
– |
– | ||||||||||||||
|
– |
– | ||||||||||||||
|
(1) |
Capital investments includes an $11 million decrease and a $56 million increase for the three months ended June 30, 2015 and 2014, respectively, and an $11 million decrease and a $61 million increase for the six months ended June 30, 2015 and 2014, respectively, relating to the change in accrued expenditures between periods. E&P capital for the three months ended June 31, 2015 includes approximately $516 million related to the WPX Property and Statoil Property Acquisitions. Midstream capital for the six months ended June 30, 2015 includes approximately $119 million of firm transport associated with the WPX Property Acquisition. | ||||||||||||||
Photo - http://photos.prnewswire.com/prnh/20150727/246213
To view the original version on PR Newswire, visit:http://www.prnewswire.com/news-releases/southwestern-energy-announces-second-quarter-2015-financial-and-operating-results-300119306.html
SOURCE Southwestern Energy Company

© 2024 Benzinga.com. Benzinga does not provide investment advice. All rights reserved.
Trade confidently with insights and alerts from analyst ratings, free reports and breaking news that affects the stocks you care about.

