


HOUSTON, April 23, 2015 /PRNewswire/ -- Southwestern Energy Company SWN today announced its financial and operating results for the quarter ended March 31, 2015. First quarter highlights include:
- Record production of 233 Bcfe, including 4 Bcfe associated with the East Texas and Arkoma assets scheduled to be divested in the second quarter;
- Total Appalachia net production of 113 Bcfe, comprised of 83 Bcf from Northeast Appalachia (a 43% increase compared to year-ago levels) and 30 Bcfe from Southwest Appalachia;
- Adjusted net income attributable to common stock (a non-GAAP measure reconciled below) of $84 million, or $0.22 per diluted share when excluding losses on derivative contracts, net of settlements and certain transaction costs associated with the West Virginia and southwest Pennsylvania acquisition closed in the fourth quarter of 2014;
- Net cash provided by operating activities before changes in operating assets and liabilities (a non-GAAP measure reconciled below) of approximately $493 million; and
- Completed long-term acquisition financing with issuance of equity and debt and agreements to divest of our northeast Pennsylvania gathering system and conventional E&P assets in East Texas and Arkoma.
"As we do every year, we have begun 2015 with the same focused approach on generating strong returns with a platform for significant growth for our shareholders in any price environment," remarked Steve Mueller, Chairman and Chief Executive Officer of Southwestern Energy. "Our first quarter results once again demonstrated the strength of our portfolio, which continues to deliver economic projects at current prices due to the quality of our assets, our focus on maintaining our low cost structure and our differentiating firm transportation capacity."
For the first quarter of 2015, Southwestern reported adjusted net income attributable to common stock of $84 million, or $0.22 per diluted share, when excluding $44 million ($27 million net of taxes) of certain transaction costs associated with the West Virginia and southwest Pennsylvania acquisition closed in the fourth quarter of 2014 and a $18 million ($11 million net of taxes) loss on derivative contracts, net of settlements. Including these items, net income attributable to common stock for the first quarter of 2015 was $46 million, or $0.12 per diluted share (reconciled below). For the first quarter of 2014, Southwestern reported adjusted net income attributable to common stock of $231 million, or $0.66 per diluted share, when excluding a $62 million ($37 million net of taxes) loss on derivative contracts, net of settlements. Including this loss, Southwestern reported net income attributable to common stock of $194 million, or $0.55 per diluted share, in the first quarter of 2014 (reconciled below).
Net cash provided by operating activities before changes in operating assets and liabilities (reconciled below) was $493 million for the first quarter of 2015, compared to $617 million for the same period in 2014.
The first quarter of 2015 and 2014 include the operating results from our gathering system in northeast Pennsylvania (divested in April 2015) and our conventional E&P assets in East Texas and the Arkoma basin (expected to be divested during the second quarter of 2015). See "Divestitures" below for additional information.
E&P Segment – Operating income from the company's E&P segment was $78 million for the first quarter of 2015, compared to $352 million for the same period in 2014. The decrease was primarily due to lower realized natural gas prices and increased operating costs and expenses from higher activity levels, partially offset by the revenue impacts of higher production volumes.
Gas, oil and NGL production totaled 233 Bcfe in the first quarter of 2015, up 28% from 182 Bcfe in the first quarter of 2014. The quarter included 115 Bcf from the Fayetteville Shale, 83 Bcf from Northeast Appalachia and 30 Bcfe from our newly acquired Southwest Appalachia. This compares to 119 Bcf from the Fayetteville Shale and 58 Bcf from Northeast Appalachia in the first quarter of 2014.
Including the effect of hedges, Southwestern's average realized gas price in the first quarter of 2015 was $2.99 per Mcf, down from $4.19 per Mcf in the first quarter of 2014. The company's commodity hedging activities increased its average realized gas price by $0.36 per Mcf during the first quarter of 2015, compared to a decrease of $0.44 per Mcf during the same period in 2014. As of April 21, 2015, the company had approximately 181 Bcf of its remaining 2015 forecasted gas production hedged at an average price of $4.40 per Mcf.
Like most producers, the company typically sells its natural gas at a discount to NYMEX settlement prices. This discount includes a basis differential, third-party transportation charges and fuel charges. Disregarding the impact of hedges, the company's average price received for its gas production during the first quarter of 2015 was approximately $0.35 per Mcf lower than average NYMEX settlement prices ($0.12 per Mcf lower in our combined Appalachia areas), compared to approximately $0.31 per Mcf lower during the first quarter of 2014 ($0.15 per Mcf higher in Northeast Appalachia). As of April 21, 2015, the company had protected approximately 245 Bcf of its remaining 2015 expected gas production from the potential of widening basis differentials through hedging activities and sales arrangements at an average basis differential to NYMEX gas prices of approximately ($0.23) per Mcf.
Lease operating expenses per unit of production for the company's E&P segment were $0.92 per Mcfe in the first quarter of 2015, compared to $0.93 per Mcfe in the first quarter of 2014. The decrease was primarily due to lower gathering costs per unit in Northeast Appalachia, partially offset by higher operating costs in Southwest Appalachia associated with liquids production.
General and administrative expenses per unit of production were $0.24 per Mcfe in the first quarter of 2015, compared to $0.25 per Mcfe in the first quarter of 2014, down primarily due to a larger increase in production volumes compared to the increase in personnel costs.
Taxes other than income taxes were $0.12 per Mcfe in the first quarter of 2015, compared to $0.13 per Mcfe in the first quarter of 2014. Taxes other than income taxes per Mcfe vary from period to period due to changes in severance and ad valorem taxes that result from the mix of the company's production volumes and fluctuations in commodity prices.
The company's full cost pool amortization rate increased to $1.15 per Mcfe in the first quarter of 2015, compared to $1.10 per Mcfe in the first quarter of 2014. The amortization rate is impacted by the timing and amount of reserve additions and the costs associated with those additions, revisions of previous reserve estimates due to both price and well performance, write-downs that result from full cost ceiling tests, proceeds from the sale of properties that reduce the full cost pool and the levels of costs subject to amortization. The company cannot predict its future full cost pool amortization rate with accuracy due to the variability of each of the factors discussed above, as well as other factors.
Midstream Services – Operating income for the company's Midstream Services segment, which is comprised of gathering and marketing activities, was $88 million for the first quarter of 2015, up 6% from $83 million for the same period in 2014. The growth in operating income was primarily due to an increase in volumes marketed. At March 31, 2015, the company's midstream segment was gathering approximately 2.3 Bcf per day through 2,029 miles of gathering lines in the Fayetteville Shale.
Divestitures – During the first quarter of 2015, the company announced the signing of an agreement to sell its gathering system in northeast Pennsylvania. This transaction closed on April 10 for an adjusted sales price of approximately $488 million, subject to customary post-closing adjustments, with the proceeds used to substantially repay borrowings under our $500 million term loan facility that was scheduled to mature in December 2016. This gathering system generated operating income and net cash provided by operating activities of approximately $12 million and $14 million, respectively, for the first quarter of 2015. For the same period of 2014, this gathering system generated operating income and net cash provided by operating activities of approximately $9 million and $10 million, respectively.
Additionally in the first quarter of 2015, the company announced the signing of an agreement to sell conventional E&P assets in East Texas and the Arkoma basin for $218 million. This transaction is expected to close during the second quarter with the proceeds used to reduce the balance on the company's revolving credit facility. These E&P assets had production of 3.6 Bcfe and operating income of approximately $2 million in the first quarter of 2015. This compares to production of 4.3 Bcfe and operating income of approximately $11 million in the first quarter of 2014.
With the closing of these two transactions, the acquisition financing plan that was announced in the fourth quarter of 2014 will be complete.
Capital Structure and Investments – At March 31, 2015, the company had approximately $5.2 billion in long-term debt, including approximately $800 million borrowed on its revolving credit facility, and its debt-to-total capitalization ratio was 42%. Adjusting for the proceeds received in the April closing of the divestiture of our northeast Pennsylvania gathering system, our pro forma total debt was $4.7 billion at March 31, 2015.
During the first quarter of 2015, excluding $365 million and $288 million associated with the closing of the transactions with Statoil and WPX Energy, respectively, Southwestern invested a total of $518 million. This is down from $542 million in the first quarter of 2014 and included approximately $496 million invested in its E&P business, $19 million invested in its Midstream Services segment and $3 million invested for corporate and other purposes.
E&P Operations Review
During the first quarter of 2015, Southwestern invested a total of approximately $496 million in its E&P business, excluding the transactions with Statoil and WPX Energy noted previously. This includes $135 million in Northeast Appalachia, $91 million in Southwest Appalachia, $229 million in the Fayetteville Shale, $1 million in its Ark-La-Tex division, $34 million in New Ventures, and $6 million in E&P Services.
Northeast Appalachia – In the first quarter of 2015, Southwestern placed 22 new wells on production in Northeast Appalachia resulting in net gas production of 83 Bcf, up 43% from 58 Bcf in the first quarter of 2014. Gross operated production in Northeast Appalachia was approximately 1,148 MMcf per day at March 31, 2015.
In the first quarter of 2015, the average 30th-day rate was 8,217 Mcf per day on 12 wells that had an average lateral length of 5,090 feet and an average cost of $5.8 million per well. This compares to an average 30th-day rate of 6,922 Mcf per day on 26 wells that had an average lateral length of 5,333 feet and an average cost of $5.9 million per well in the fourth quarter of 2014.
As of March 31, 2015, Southwestern had 349 operated wells on production and 95 wells in progress. Of the operated wells on production, 348 were horizontal wells of which 198 were located in Susquehanna County, 129 were located in Bradford County and 21 were located in Lycoming County. Of the 95 wells in progress, 35 were either waiting on completion or waiting to be placed to sales, including 15 in Susquehanna County, 13 in Bradford County, 4 in Lycoming County and 3 wells in Sullivan, Tioga and Wyoming Counties, combined.
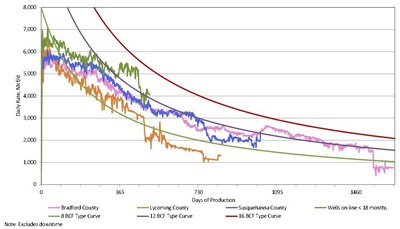
The graph below provides normalized average daily production data through March 31, 2015, for the horizontal wells drilled by the company in Northeast Appalachia. The "pink curve" indicates results for 124 wells in Bradford County, the "blue curve" indicates results for 136 wells in Susquehanna County, the "orange curve" indicates results for 21 wells in Lycoming County and the "green curve" indicates results for the 130 wells that have been put on production within the last 18 months. As a reminder, the production rates from all of our wells in Northeast Appalachia are managed to maximize the ultimate recovery from the wells. The normalized production curves are intended to provide a qualitative indication of the company's Northeast Appalachia wells' performance and should not be used to estimate an individual well's estimated ultimate recovery. The 8, 12 and 16 Bcf type curves are shown solely for reference purposes and are not intended to be projections of the performance of the company's wells.

Southwest Appalachia – During the first quarter of 2015, Southwestern placed 13 wells on production in Southwest Appalachia resulting in net production of 30 Bcfe, 55% of which was natural gas. The company made significant progress in integrating the newly acquired West Virginia and southwest Pennsylvania assets into the portfolio. In addition to successfully working with the state of West Virginia to transfer the permits already in progress, the company drilled its first five wells. The average time to drill to total depth was 19 days from re-entry to re-entry. With pad drilling, this would have been 4 days shorter. The company also completed its first four wells, which will be placed on production in the second quarter.
As of March 31, 2015, Southwestern had 300 operated horizontal wells on production and 35 operated horizontal wells in progress. Of the operated horizontal wells on production, approximately 85% were in the wet gas portion of the acreage. Of the 35 wells in progress, 14 were waiting on completion. The company currently has two drilling rigs running, one company-owned, with plans to exit the year with 4 rigs.
Fayetteville Shale – In the first quarter of 2015, Southwestern's net gas production from the Fayetteville Shale was 115 Bcf, compared to 119 Bcf in the first quarter of 2014. Gross operated gas production in the Fayetteville Shale was approximately 2,038 MMcf per day at March 31, 2015.
The 99 horizontal wells that were placed on production during the first quarter of 2015 had an average initial production rate of 4,357 Mcf per day, average completed well cost of $2.8 million per well, average horizontal lateral length of 5,875 feet and average time to drill to total depth of 7.2 days from re-entry to re-entry. This compares to the 97 horizontal wells that the company placed on production in the fourth quarter of 2014 that had an average initial production rate of 4,840 Mcf per day, an average horizontal lateral length of 5,547 feet, average time to drill to total depth of 7.2 days from re-entry to re-entry and an average completed well cost of $2.7 million per well.
Explanation and Reconciliation of Non-GAAP Financial Measures
The company reports its financial results in accordance with accounting principles generally accepted in the United States of America ("GAAP"). However, management believes certain non-GAAP performance measures may provide financial statement users with additional meaningful comparisons between current results and the results of its peers and of prior periods.
One such non-GAAP financial measure is net cash provided by operating activities before changes in operating assets and liabilities. Management presents this measure because (i) it is accepted as an indicator of an oil and gas exploration and production company's ability to internally fund exploration and development activities and to service or incur additional debt, (ii) changes in operating assets and liabilities relate to the timing of cash receipts and disbursements which the company may not control and (iii) changes in operating assets and liabilities may not relate to the period in which the operating activities occurred.
Additional non-GAAP financial measures the company may present from time to time are adjusted net income, adjusted diluted earnings per share, adjusted EBITDA and its E&P segment operating income, all which exclude certain charges or amounts. Management presents these measures because (i) they are consistent with the manner in which the company's performance is measured relative to the performance of its peers, (ii) these measures are more comparable to earnings estimates provided by securities analysts, and (iii) charges or amounts excluded cannot be reasonably estimated and guidance provided by the company excludes information regarding these types of items. These adjusted amounts are not a measure of financial performance under GAAP.
See the reconciliations below of GAAP financial measures to non-GAAP financial measures for the three months ended March 31, 2015 and March 31, 2014. Non-GAAP financial measures should not be considered in isolation or as a substitute for the company's reported results prepared in accordance with GAAP.
|
3 Months Ended March 31, | |||
|
2015 |
2014 | ||
|
(in millions) | |||
|
Net income attributable to common stock: |
|||
|
Net income attributable to common stock |
$ 46 |
$ 194 | |
|
Add back (attributable to common stock): |
|||
|
Loss on certain derivatives (net of taxes) |
11 |
37 | |
|
Transaction costs (net of taxes) |
27 |
- | |
|
Adjusted net income attributable to common stock |
$ 84 |
$ 231 | |
|
3 Months Ended March 31, | |||
|
2015 |
2014 | ||
|
Diluted earnings per share: |
|||
|
Diluted earnings per share |
$ 0.12 |
$ 0.55 | |
|
Add back (attributable to common stock): |
|||
|
Loss on certain derivatives (net of taxes) |
0.03 |
0.11 | |
|
Transaction costs (net of taxes) |
0.07 |
- | |
|
Adjusted diluted earnings per share |
$ 0.22 |
$ 0.66 | |
|
3 Months Ended March 31, | |||
|
2015 |
2014 | ||
|
(in millions) | |||
|
Cash flow from operating activities: |
|||
|
Net cash provided by operating activities |
$ 541 |
$ 609 | |
|
Add back (deduct): |
|||
|
Changes in operating assets and liabilities |
(48) |
8 | |
|
Net cash provided by operating activities before changes in operating assets and liabilities |
$ 493 |
$ 617 | |
Southwestern management will host a teleconference call on Friday, April 24, 2015 at 10:00 a.m. Eastern to discuss its first quarter 2015 results. The toll-free number to call is 877-407-8035 and the international dial-in number is 201-689-8035. The teleconference can also be heard "live" on the Internet at http://www.swn.com.
Southwestern Energy Company is an independent energy company whose wholly owned subsidiaries are engaged in natural gas and oil exploration, development and production, natural gas gathering and marketing. Additional information on the company can be found on the Internet at http://www.swn.com.
All statements, other than historical facts and financial information, may be deemed to be forward-looking statements within the meaning of Section 27A of the Securities Act of 1933, as amended, and Section 21E of the Securities Exchange Act of 1934, as amended. All statements that address activities, outcomes and other matters that should or may occur in the future, including, without limitation, statements regarding the financial position, business strategy, production and reserve growth and other plans and objectives for the company's future operations, are forward-looking statements. Although the company believes the expectations expressed in such forward-looking statements are based on reasonable assumptions, such statements are not guarantees of future performance and actual results or developments may differ materially from those in the forward-looking statements. The company has no obligation and makes no undertaking to publicly update or revise any forward-looking statements, other than to the extent set forth below. You should not place undue reliance on forward-looking statements. They are subject to known and unknown risks, uncertainties and other factors that may affect the company's operations, markets, products, services and prices and cause its actual results, performance or achievements to be materially different from any future results, performance or achievements expressed or implied by the forward-looking statements. In addition to any assumptions and other factors referred to specifically in connection with forward-looking statements, risks, uncertainties and factors that could cause the company's actual results to differ materially from those indicated in any forward-looking statement include, but are not limited to: the timing and extent of changes in market conditions and prices for natural gas and oil (including regional basis differentials); the company's ability to fund the company's planned capital investments; the company's ability to transport its production to the most favorable markets or at all; the timing and extent of the company's success in discovering, developing, producing and estimating reserves; the economic viability of, and the company's success in drilling, the company's large acreage position in various areas and, in particular, the Fayetteville Shale, Northeast Appalachia and Southwest Appalachia as well as relative to other productive shale gas plays; the company's ability to realize the expected benefits from recent acquisitions; the impact of title and environmental defects and other matters on the value of the properties acquired in the company's recent acquisitions and any other future acquisitions; difficulties in integrating the company's operations as a result of any significant acquisitions; the impact of government regulation, including any legislation relating to hydraulic fracturing, the climate or over-the-counter derivatives; the costs and availability of oil field personnel services and drilling supplies, raw materials and equipment, including pressure pumping equipment and crews; the company's ability to determine the most effective and economic fracture stimulation; the company's future property acquisition or divestiture activities; the effects of weather; increased competition and regulation; the financial impact of accounting regulations and critical accounting policies; the comparative cost of alternative fuels; the different risks and uncertainties associated with proposed activities in Canada; conditions in capital markets, changes in interest rates and the ability of the company's lenders to provide it with funds as agreed; credit risk relating to the risk of loss as a result of non-performance by the company's counterparties; and any other factors listed in the reports the company has filed and may file with the Securities and Exchange Commission (SEC). For additional information with respect to certain of these and other factors, see the reports filed by the company with the SEC. The company disclaims any intention or obligation to update or revise any forward-looking statements, whether as a result of new information, future events or otherwise.
|
OPERATING STATISTICS (Unaudited) |
Page 1 of 5 | |||||
|
Southwestern Energy Company and Subsidiaries |
||||||
|
For the three months ended March 31, | ||||||
|
2015 |
2014 | |||||
|
Exploration & Production |
||||||
|
Production |
||||||
|
Gas Production (Bcf) |
219 |
182 | ||||
|
Oil Production (MBbls) |
545 |
16 | ||||
|
NGL production (MBbls) |
1,766 |
9 | ||||
|
Total production (Bcfe) |
233 |
182 | ||||
|
Commodity Prices |
||||||
|
Average realized gas price per Mcf, including hedges |
$ |
2.99 |
$ |
4.19 | ||
|
Average realized gas price per Mcf, excluding hedges |
$ |
2.63 |
$ |
4.63 | ||
|
Average oil price per Bbl |
$ |
30.90 |
$ |
100.43 | ||
|
Average NGL price per Bbl |
$ |
10.35 |
$ |
50.16 | ||
|
Summary of Derivatives Activity in the Statement of Operations |
||||||
|
Settled Commodity Amounts included in "Operating Revenues" |
$ |
42 |
$ |
(42) | ||
|
Settled Commodity Amounts included in "Gain (Loss) on Derivatives" |
$ |
36 |
$ |
(38) | ||
|
Unsettled Commodity Amounts included in "Gain (Loss) on Derivatives" |
$ |
(21) |
$ |
(62) | ||
|
Operating Expenses per Mcfe |
||||||
|
Lease operating expenses |
$ |
0.92 |
$ |
0.93 | ||
|
General & administrative expenses |
$ |
0.24 |
$ |
0.25 | ||
|
Taxes, other than income taxes |
$ |
0.12 |
$ |
0.13 | ||
|
Full cost pool amortization |
$ |
1.15 |
$ |
1.10 | ||
|
Midstream |
||||||
|
Volumes marketed (Bcfe) |
260 |
216 | ||||
|
Volumes gathered (Bcf) |
233 |
233 | ||||
|
STATEMENTS OF OPERATIONS (Unaudited) |
Page 2 of 5 | ||||||||||
|
Southwestern Energy Company and Subsidiaries |
|||||||||||
|
For the three months ended March 31, | |||||||||||
|
2015 |
2014 | ||||||||||
|
(in millions, except share/per amounts) | |||||||||||
|
Operating Revenues |
|||||||||||
|
Gas sales |
$ |
625 |
$ |
793 | |||||||
|
Oil sales |
17 |
2 | |||||||||
|
NGL sales |
18 |
– | |||||||||
|
Marketing |
225 |
272 | |||||||||
|
Gas gathering |
48 |
46 | |||||||||
|
933 |
1,113 | ||||||||||
|
Operating Costs and Expenses |
|||||||||||
|
Marketing purchases |
222 |
271 | |||||||||
|
Operating expenses |
155 |
100 | |||||||||
|
General and administrative expenses |
68 |
57 | |||||||||
|
Depreciation, depletion and amortization |
293 |
225 | |||||||||
|
Taxes, other than income taxes |
30 |
25 | |||||||||
|
768 |
678 | ||||||||||
|
Operating Income |
165 |
435 | |||||||||
|
Interest Expense: |
|||||||||||
|
Interest on debt |
50 |
25 | |||||||||
|
Other interest charges |
49 |
1 | |||||||||
|
Interest capitalized |
(48) |
(13) | |||||||||
|
51 |
13 | ||||||||||
|
Other Income (Loss), Net |
(1) |
1 | |||||||||
|
Gain (Loss) on Derivatives |
14 |
(100) | |||||||||
|
Income Before Income Taxes |
127 |
323 | |||||||||
|
Provision (Benefit) for Income Taxes |
|||||||||||
|
Current |
– |
(1) | |||||||||
|
Deferred |
49 |
130 | |||||||||
|
49 |
129 | ||||||||||
|
Net Income |
$ |
78 |
$ |
194 | |||||||
|
Mandatory convertible preferred stock dividend |
25 |
– | |||||||||
|
Participating securities – mandatory convertible preferred stock |
7 |
– | |||||||||
|
Net Income Attributable to Common Stock |
$ |
46 |
$ |
194 | |||||||
|
Earnings Per Common Share: |
|||||||||||
|
Basic |
$ |
0.12 |
$ |
0.55 | |||||||
|
Diluted |
$ |
0.12 |
$ |
0.55 | |||||||
|
Weighted Average Common Shares Outstanding: | |||||||||||
|
Basic |
375,444,030 |
351,222,538 | |||||||||
|
Diluted |
375,578,054 |
351,985,821 | |||||||||
|
BALANCE SHEETS (Unaudited) |
Page 3 of 5 | |||||||||||
|
Southwestern Energy Company and Subsidiaries |
||||||||||||
|
March 31, |
December 31, | |||||||||||
|
(in millions) | ||||||||||||
|
ASSETS |
||||||||||||
|
Current assets |
$ |
888 |
$ |
1,115 | ||||||||
|
Property and equipment |
23,627 |
22,557 | ||||||||||
|
Less: Accumulated depreciation, depletion and amortization |
(9,144) |
(8,845) | ||||||||||
|
Total property and equipment, net |
14,483 |
13,712 | ||||||||||
|
Other long-term assets |
216 |
98 | ||||||||||
|
Total assets |
$ |
15,587 |
$ |
14,925 | ||||||||
|
LIABILITIES AND EQUITY |
||||||||||||
|
Current liabilities |
945 |
5,428 | ||||||||||
|
Long-term debt |
5,163 |
2,466 | ||||||||||
|
Deferred income taxes |
2,009 |
1,951 | ||||||||||
|
Pension and other postretirement liabilities |
45 |
44 | ||||||||||
|
Other long-term liabilities |
368 |
374 | ||||||||||
|
Total liabilities |
8,530 |
10,263 | ||||||||||
|
Equity: |
||||||||||||
|
Common stock, $0.01 par value; authorized 1,250,000,000 shares; issued 384,572,080 shares as of March 31, 2015 and 354,488,992 as of December 31, 2014 |
4 |
4 | ||||||||||
|
Preferred stock, $0.01 par value,10,000,000 shares authorized, 6.25% Series B Mandatory Convertible, $1,000 per share liquidation preference, 1,725,000 shares issued and outstanding |
– |
– | ||||||||||
|
Additional paid-in capital |
3,372 |
1,019 | ||||||||||
|
Retained earnings |
3,633 |
3,577 | ||||||||||
|
Accumulated other comprehensive income |
48 |
62 | ||||||||||
|
Common stock in treasury; 13,893 shares in 2015 and 11,055 in 2014 |
– |
– | ||||||||||
|
Total equity |
7,057 |
4,662 | ||||||||||
|
Total liabilities and equity |
$ |
15,587 |
$ |
14,925 | ||||||||
|
STATEMENTS OF CASH FLOWS (Unaudited) |
Page 4 of 5 | |||||
|
Southwestern Energy Company and Subsidiaries |
||||||
|
For the three months ended March 31, | ||||||
|
2015 |
2014 | |||||
|
(in millions) | ||||||
|
Cash Flows From Operating Activities |
||||||
|
Net Income |
$ |
78 |
$ |
194 | ||
|
Adjustments to reconcile net income to net cash provided by operating |
||||||
|
Depreciation, depletion and amortization |
293 |
225 | ||||
|
Amortization of debt issuance cost |
46 |
1 | ||||
|
Deferred income taxes |
49 |
130 | ||||
|
Loss on derivatives excluding derivatives, settled |
21 |
62 | ||||
|
Stock-based compensation |
6 |
4 | ||||
|
Other |
– |
1 | ||||
|
Change in assets and liabilities |
48 |
(8) | ||||
|
Net cash provided by operating activities |
541 |
609 | ||||
|
Cash Flows From Investing Activities |
||||||
|
Capital investments |
(508) |
(525) | ||||
|
Acquisitions |
(591) |
(9) | ||||
|
Proceeds from sale of property and equipment |
1 |
17 | ||||
|
Other |
3 |
1 | ||||
|
Net cash used in investing activities |
(1,095) |
(516) | ||||
|
Cash Flows From Financing Activities |
||||||
|
Payments on revolving long-term debt |
(830) |
(1,131) | ||||
|
Borrowings under revolving long-term debt |
1,330 |
1,009 | ||||
|
Change in bank drafts outstanding |
(7) |
19 | ||||
|
Payments on short-term debt |
(4,500) |
– | ||||
|
Proceeds from issuance of long term debt |
2,200 |
– | ||||
|
Debt issuance costs |
(17) |
– | ||||
|
Proceeds from exercise of common stock options |
– |
6 | ||||
|
Proceeds from issuance of common stock |
669 |
– | ||||
|
Proceeds from issuance of mandatory convertible preferred stock |
1,673 |
– | ||||
|
Net cash provided by (used in) financing activities |
518 |
(97) | ||||
|
Decrease in cash and cash equivalents |
(36) |
(4) | ||||
|
Cash and cash equivalents at beginning of year |
53 |
23 | ||||
|
Cash and cash equivalents at end of period |
$ |
17 |
$ |
19 | ||
|
SEGMENT INFORMATION (Unaudited) |
Page 5 of 5 | |||||||||||||
|
Southwestern Energy Company and Subsidiaries |
||||||||||||||
|
Exploration |
||||||||||||||
|
and |
Midstream |
|||||||||||||
|
Production |
Services |
Other |
Eliminations |
Total | ||||||||||
|
Three months ended March 31, 2015 |
||||||||||||||
|
Revenues |
$ |
655 |
$ |
938 |
$ |
1 |
$ |
(661) |
$ |
933 | ||||
|
Marketing purchases |
– |
786 |
– |
(564) |
222 | |||||||||
|
Operating expenses |
216 |
36 |
– |
(97) |
155 | |||||||||
|
General and administrative expenses |
56 |
11 |
1 |
– |
68 | |||||||||
|
Depreciation, depletion and amortization |
278 |
15 |
– |
– |
293 | |||||||||
|
Taxes, other than income taxes |
27 |
2 |
1 |
– |
30 | |||||||||
|
Operating income (loss) |
78 |
88 |
(1) |
– |
165 | |||||||||
|
Capital investments(1) |
1,030 |
138 |
3 |
– |
1,171 | |||||||||
|
Three months ended March 31, 2014 |
||||||||||||||
|
Revenues |
$ |
802 |
$ |
1,230 |
$ |
– |
$ |
(919) |
$ |
1,113 | ||||
|
Marketing purchases |
– |
1,085 |
– |
(814) |
271 | |||||||||
|
Operating expenses |
169 |
36 |
– |
(105) |
100 | |||||||||
|
General and administrative expenses |
47 |
10 |
– |
– |
57 | |||||||||
|
Depreciation, depletion and amortization |
211 |
14 |
– |
– |
225 | |||||||||
|
Taxes, other than income taxes |
23 |
2 |
– |
– |
25 | |||||||||
|
Operating income |
352 |
83 |
– |
– |
435 | |||||||||
|
Capital investments(1) |
499 |
39 |
4 |
– |
542 | |||||||||
|
(1) |
Capital investments includes an immaterial increase and $6 million increase for the three month periods ended March 31, 2015 and 2014, respectively, relating to the change in accrued expenditures between periods. E&P capital for the three months ended March 31, 2015 includes approximately $534 million related to the WPX and Statoil Property Acquisitions. Midstream capital for the three months ended March 31, 2015 includes approximately $119 million of firm transport associated with the WPX Property Acquisition. | |||||||||||||||
Photo - http://photos.prnewswire.com/prnh/20150423/201230-INFO
To view the original version on PR Newswire, visit:http://www.prnewswire.com/news-releases/southwestern-energy-announces-first-quarter-2015-financial-and-operating-results-300071427.html
SOURCE Southwestern Energy Company

© 2024 Benzinga.com. Benzinga does not provide investment advice. All rights reserved.
Trade confidently with insights and alerts from analyst ratings, free reports and breaking news that affects the stocks you care about.

