


HOUSTON, Feb. 26, 2015 /PRNewswire/ -- Southwestern Energy Company SWN today announced its financial and operating results for the fourth quarter and the year ended December 31, 2014. Calendar year 2014 highlights include:
- Record adjusted net income (a non-GAAP measure reconciled below) of $801 million, or $2.27 per diluted share, up 14% compared to 2013 levels when excluding gains on derivative contracts, net of settlements, discrete income tax adjustments and certain transaction costs associated with the West Virginia and southwest Pennsylvania acquisition closed in the fourth quarter of 2014;
- Record net cash provided by operating activities before changes in operating assets and liabilities (a non-GAAP measure reconciled below) of approximately $2.3 billion, up 14% compared to 2013;
- Record gas and oil production of 768 Bcfe, up 17% compared to 2013;
- Northeast Appalachia production up 69% compared to 2013; gross operated production reaches 1.0 Bcf per day;
- Record total proved reserves of approximately 10.7 Tcfe, up 54% compared to 2013 levels;
- Reserve replacement of 591%, including reserve revisions and acquisitions; and
- Closing of the acquisition of 413,000 net acres in West Virginia and southwest Pennsylvania for approximately $5.0 billion in December 2014, with the closing in January 2015 of an additional 30,000 net acres in this area for approximately $365 million and approximately 46,700 net acres in northeast Pennsylvania and firm transportation capacity of 260 million cubic feet per day for $288 million.
"2014 was an exciting year for Southwestern Energy," remarked Steve Mueller, Chairman and Chief Executive Officer of Southwestern Energy. "We once again set records in production, reserves, net income and cash flow as we continued our organizational focus on efficiency and continuous learning. While achieving these significant results, we were able to enhance the portfolio and build for an even brighter future with the acquisition of the West Virginia and southwest Pennsylvania acreage. This transaction provides another scalable project in which we can create industry-leading shareholder value for years to come."
The production growth in 2014 was primarily driven by the Northeast Appalachia division where gross operated production surpassed 1.0 Bcf per day at year-end. This exit rate compared to an exit rate of 700 MMcf per day at year-end 2013.
The Fayetteville Shale division achieved record production of 494 Bcf, generating over $300 million in excess cash flow to reinvest in other growth areas of the company. In the play's tenth year of development, the division continues to learn and apply those learnings to build on the past results to make them even better.
The Southwest Appalachia division is making great progress integrating the new acreage into the portfolio and building great operational momentum. It currently has one rig drilling in the area with a second rig on location and expected to begin drilling very shortly. "It is an exciting time as we begin the process of extracting the value that we identified when we made the acquisition," Mueller commented.
"The strength and flexibility of our portfolio will once again be demonstrated in 2015. As we did in 2012 when natural gas prices began the year in a similar fashion, we have made adjustments to our 2015 guidance to maintain financial flexibility while we continue our focus on delivering value for our shareholders. As we look further into the future, we expect a comparable capital program can deliver another year of double digit growth in 2016."
Fourth Quarter of 2014 Financial Results
For the fourth quarter of 2014, Southwestern reported adjusted net income of $185 million, or $0.52 per diluted share, when excluding a $138 million ($84 million net of taxes) gain on derivative contracts that have not been settled, discrete income tax adjustments totaling $46 million and $5 million ($3 million net of taxes) of certain transaction costs associated with the West Virginia and southwest Pennsylvania acquisition closed in the fourth quarter of 2014. Including these items, net income for the fourth quarter of 2014 was $312 million, or $0.88 per diluted share (reconciled below). For the fourth quarter of 2013, Southwestern reported adjusted net income of $188 million, or $0.54 per diluted share, when excluding a $51 million ($31 million net of taxes) loss on derivative contracts that had not been settled, and discrete income tax adjustments totaling $13 million. Including these items, Southwestern reported net income of $144 million, or $0.41 per diluted share, in the fourth quarter of 2013 (reconciled below).
Net cash provided by operating activities before changes in operating assets and liabilities was $570 million for the fourth quarter of 2014 (reconciled below), up 6% compared to $538 million for the same period in 2013.
E&P Segment – Operating income from the company's E&P segment was $196 million for the fourth quarter of 2014, compared to $227 million for the same period in 2013. The decrease was primarily due to lower realized natural gas prices and increased operating costs and expenses from higher activity levels, partially offset by the revenue impacts of higher production volumes.
Gas and oil production totaled 201 Bcfe in the fourth quarter of 2014, up 14% from 177 Bcfe in the fourth quarter of 2013, and included 125 Bcf from the Fayetteville Shale, compared to 123 Bcf in the fourth quarter of 2013. Gas production from Northeast Appalachia was 69 Bcf in the fourth quarter of 2014, an increase of 41% from its production of 49 Bcf in the fourth quarter of 2013. Gas and oil production from Southwest Appalachia was 3 Bcfe in the fourth quarter of 2014, all following the closing of the acquisition in late December.
Including the effect of hedges, Southwestern's average realized gas price in the fourth quarter of 2014 was $3.52 per Mcf, down slightly from $3.68 per Mcf in the fourth quarter of 2013. The company's commodity hedging activities increased its average gas price by $0.26 per Mcf during the fourth quarter of 2014, compared to an increase of $0.53 per Mcf during the same period in 2013. As of February 24, 2015, the company had approximately 240 Bcf of its 2015 forecasted gas production hedged at an average price of $4.40 per Mcf. As of February 24, 2015, the company had protected approximately 310 Bcf of its 2015 expected gas production from the potential of widening basis differentials through hedging activities and sales arrangements at an average basis differential to NYMEX gas prices of approximately ($0.17) per Mcf.
The company typically sells its natural gas at a discount to NYMEX settlement prices. This discount includes a basis differential, third-party transportation charges and fuel charges. Disregarding the impact of hedges, the company's average price received for its gas production during the fourth quarter of 2014 was approximately $0.74 per Mcf lower than average NYMEX settlement prices, compared to approximately $0.45 per Mcf lower during the fourth quarter of 2013.
Lease operating expenses per unit of production for the company's E&P segment were $0.90 per Mcfe in the fourth quarter of 2014, which is comparable to $0.89 per Mcfe from the fourth quarter of 2013.
General and administrative expenses per unit of production were $0.24 per Mcfe in the fourth quarter of 2014, compared to $0.26 per Mcfe in the fourth quarter of 2013, down primarily due to a larger increase in production volumes compared to the increase in personnel costs.
Taxes other than income taxes were $0.10 per Mcfe in the fourth quarter of 2014, compared to $0.11 per Mcfe in the fourth quarter of 2013. Taxes other than income taxes per Mcfe vary from period to period due to changes in severance and ad valorem taxes that result from the mix of the company's production volumes and fluctuations in commodity prices.
The company's full cost pool amortization rate increased slightly to $1.12 per Mcfe in the fourth quarter of 2014, compared to $1.10 per Mcfe in the fourth quarter of 2013. The amortization rate is impacted by the timing and amount of reserve additions and the costs associated with those additions, revisions of previous reserve estimates due to both price and well performance, impairments that result from full cost ceiling tests, proceeds from the sale of properties that reduce the full cost pool and the levels of costs subject to amortization. The company cannot predict its future full cost pool amortization rate with accuracy due to the variability of each of the factors discussed above, as well as other factors.
Midstream Services – Operating income for the company's Midstream Services segment, which is comprised of natural gas gathering and marketing activities, was $89 million for the fourth quarter of 2014, compared to $90 million for the same period in 2013. At December 31, 2014, the company's midstream segment was gathering approximately 2.4 Bcf per day through 2,017 miles of gathering lines in the Fayetteville Shale and gathering approximately 443 MMcf per day in Northeast Appalachia.
Full-Year 2014 Financial Results
For 2014, Southwestern reported adjusted net income of $801 million, or $2.27 per diluted share, when excluding a $131 million ($80 million net of taxes) gain on derivative contracts that have not been settled, discrete income tax adjustments totaling $46 million and $5 million ($3 million net of taxes) of certain transaction costs associated with the West Virginia and southwest Pennsylvania acquisition closed in the fourth quarter of 2014. Including these items, net income for 2014 was $924 million, or $2.62 per diluted share (reconciled below). For 2013, Southwestern reported adjusted net income of $704 million, or $2.00 per diluted share, when excluding a $21 million ($13 million net of taxes) gain on derivative contracts that had not been settled and discrete income tax adjustments totaling $13 million. Including these items, Southwestern reported net income of $704 million, or $2.00 per diluted share, in 2013 (reconciled below).
Net cash provided by operating activities before changes in operating assets and liabilities was approximately $2.3 billion in 2014 (reconciled below), up 14% compared to $2.0 billion for the same period in 2013.
E&P Segment – Operating income from the company's E&P segment was $1,013 million in 2014, up 15% compared to $879 million in 2013. The increase was primarily due to higher production volumes and higher realized natural gas prices, partially offset by higher operating costs and expenses due to increased activity levels.
Gas and oil production was 768 Bcfe in 2014, up 17% compared to 657 Bcfe in 2013, and included 494 Bcf from the company's Fayetteville Shale division, up from 486 Bcf in 2013, and 254 Bcf in 2014 from Northeast Appalachia, an increase of 69% from its production of 151 Bcf in 2013.
Southwestern's average realized gas price was $3.72 per Mcf, including the effect of hedges, in 2014 compared to $3.65 per Mcf in 2013. The company's hedging activities decreased the average gas price realized in 2014 by $0.02 per Mcf, compared to an increase of $0.48 per Mcf in 2013. Disregarding the impact of hedges, the average price received for the company's gas production during 2014 was approximately $0.67 per Mcf lower than average NYMEX settlement prices, compared to approximately $0.48 per Mcf lower than NYMEX settlement prices in 2013. For 2015, the company expects its total gas sales discount to NYMEX to range from $0.70 to $0.85 per Mcf.
Lease operating expenses for the company's E&P segment were $0.91 per Mcfe in 2014, up from $0.86 per Mcfe in 2013. The increase was primarily due to increased gathering and compression costs associated with our Northeast Appalachia operations.
General and administrative expenses were $0.24 per Mcfe in 2014 and 2013. The increased costs were offset by the increased production volumes, resulting in a flat rate between the years.
Taxes other than income taxes were $0.11 per Mcfe in 2014, compared to $0.10 per Mcfe in 2013.
The company's full cost pool amortization rate slightly increased to $1.10 per Mcfe in 2014, compared to $1.08 per Mcfe in 2013.
Midstream Services – Operating income for the company's midstream activities was $361 million in 2014, up 11% compared to $325 million in 2013. The growth in operating income was primarily due to an increase in gas marketing margins and the increase in gathering activity from the company's Fayetteville Shale and Northeast Appalachia properties, partially offset by increased operating costs and expenses due to higher activity levels.
Capital Structure and Investments – At December 31, 2014, the company had approximately $7.0 billion in debt outstanding and its debt-to-total capitalization ratio was 60%. On December 19, 2014, the Company entered into a $4.5 billion unsecured 364-day Bridge Term Loan Credit Agreement and a two-year $500 million Term Loan Agreement with various lenders. The Company repaid the $4.5 billion outstanding and terminated the Bridge Facility in January 2015 with net proceeds of $669 million and $1.7 billion from common stock and depositary share offerings, respectively, and $2.2 billion from senior note offerings with the difference utilized to pay down amounts under its revolving credit facility. At December 31, 2014, the company had approximately $300 million borrowed on its revolving credit facility and had cash and cash equivalents of $53 million. In January 2015, this debt balance was reduced by the $2.3 billion net proceeds from the issuance of common and preferred stock, partially offset by the increase associated with the $653 million in acquisition costs related to the closing of the previously announced Statoil and WPX Energy transactions.
In 2014, excluding the acquisition of oil and gas properties in West Virginia and southwest Pennsylvania that closed in the fourth quarter of 2014 totaling $5.0 billion, Southwestern's capital investments totaled approximately $2.4 billion, compared to $2.2 billion in 2013, and included $2.2 billion for its E&P segment, $144 million for its Midstream Services segment and $49 million for corporate and other purposes.
Revised 2015 Capital Program and Production Guidance
The company currently expects that its total capital investments for the full year of 2015, excluding the $653 million of acquisition costs for transactions that closed in January 2015, to be approximately $2.0 billion, down from its prior estimate in December 2014 of $2.6 billion. The following table provides the company's capital investments forecast for 2015 as compared to 2014 results.
|
Capital Investments | |||
|
Actual |
Forecast | ||
|
2014 (1) |
2015 (1) | ||
|
(in millions) | |||
|
Northeast Appalachia |
$ 695 |
$ 700 | |
|
Southwest Appalachia |
4 |
520 | |
|
Fayetteville Shale |
944 |
560 | |
|
Exploration, Sand Wash and Brown Dense |
493 |
110 | |
|
Midstream Services |
144 |
85 | |
|
E&P Services & Corporate |
63 |
40 | |
|
Ark-La-Tex |
5 |
- | |
|
Drilling Rigs |
92 |
- | |
|
Total Capital Investments |
$ 2,440 |
$ 2,015 | |
|
(1) |
Excludes $5.0 billion acquisition closed in 4Q 2014 with Chesapeake Energy and $365 million and $288 million acquisitions closed in 1Q 2015 with Statoil and WPX Energy, respectively | |||
The company has also updated its production guidance for 2015 due to the reduction in its previous planned capital investments. The revised total gas and oil production guidance for 2015 of 940 to 955 Bcfe is an increase of approximately 23% over the company's 2014 gas and oil production (using midpoints). Of the company's total expected production in 2015, approximately 448 to 453 Bcf is expected to come from the Fayetteville Shale, approximately 356 to 361 Bcf is expected to come from Northeast Appalachia and 136 to 141 Bcfe is expected to come from Southwest Appalachia. All of the 2015 figures exclude the impact from the East Texas and Arkoma oil and gas assets, which are expected to be divested during the second quarter of 2015. The company's guidance for 2015 is shown below.
|
Estimated Production by Quarter in 2015 | ||||||||||
|
1st Quarter |
2nd Quarter |
3rd Quarter |
4th Quarter |
Total Year 2015 | ||||||
|
Total Production (Bcfe) |
225 - 228 |
230 -234 |
238 - 242 |
247 - 251 |
940 - 955 | |||||
|
Natural Gas (Bcf) |
211 - 214 |
215 - 219 |
221 - 225 |
228 - 232 |
875 - 890 | |||||
|
Oil (MBbls) |
470 - 520 |
495 - 545 |
560 - 610 |
620 - 670 |
2,145 - 2,345 | |||||
|
NGLs (MBbls) |
1,805 - 1,855 |
1,960 - 2,010 |
2,235 - 2,285 |
2,380 - 2,430 |
8,380 - 8,580 | |||||
|
Estimated E&P Pricing Deductions in 2015 ($ per Mcfe) | |
|
Average Basis Differential and Transportation Charge |
$0.70 - $0.85 |
|
Estimated E&P Operating Expenses in 2015 (assumes $3.25 per Mcf gas price) | |
|
Lease Operating Expenses |
$0.90 - $0.95 |
|
General & Administrative Expense |
$0.20 - $0.24 |
|
Taxes, Other Than Income Taxes |
$0.11 - $0.13 |
|
Other Operating Income and Expenses in 2015 (assumes $3.25 per Mcf gas price) | |
|
Midstream EBITDA ($ in millions) |
$325 - $335 |
|
Net Interest Expense ($ in millions) |
$20 - $25 |
|
Income Tax Rate (Over 95% Deferred) |
38.5% |
With this revised plan, the company has provided estimates of net income, net cash provided by operating activities before changes in operating assets and liabilities (a non-GAAP measure; see "Explanation and Reconciliation of Non-GAAP Financial Measures" below) and net income plus interest, income tax expense, depreciation, depletion and amortization (also known as EBITDA, a non-GAAP measure; see "Explanation and Reconciliation of Non-GAAP Financial Measures" below) for various price scenarios in the table below.
NYMEX Commodity Prices |
Net Income (1) |
Net Cash Flow (2) (3) |
EBITDA (1) (2) |
|
$3.00 Gas $60.00 Oil |
$140 - $160 Million |
$1,640 - $1,660 Million |
$1,525 - $1,545 Million |
|
$3.25 Gas $50.00 Oil |
$215 - $235 Million |
$1,760 - $1,780 Million |
$1,645 - $1,665 Million |
|
$3.25 Gas $60.00 Oil |
$240 - $260 Million |
$1,800 - $1,820 Million |
$1,680 - $1,700 Million |
|
(1) |
Includes the impact of $106 million in preferred dividends |
|
(2) |
Net cash provided by operating activities before changes in operating assets and liabilities (net cash flow) and EBITDA are non-GAAP measures; see Explanation and Reconciliation of Non-GAAP Financial Measures below. |
|
(3) |
Excludes the impact of preferred dividends |
2014 Gas and Oil Reserves and Operational Review
Southwestern's estimated proved gas and oil reserves increased by 54% to approximately 10,747 Bcfe at December 31, 2014, compared to 6,976 Bcfe at the end of 2013. The significant increase in reserves in 2014 was primarily due to the acquisition of oil and gas properties in West Virginia and southwest Pennsylvania, the company's successful development drilling programs in the Fayetteville Shale and Northeast Appalachia, and revisions resulting from continued strong well performance in Northeast Appalachia for wells drilled in prior years. The average prices utilized to value the company's estimated proved natural gas and oil reserves at December 31, 2014 were $4.35 per MMBtu for natural gas, $91.48 per barrel for oil and $23.79 per barrel for NGLs, compared to $3.67 per MMBtu for natural gas, $93.42 per barrel for oil and $43.45 per barrel for NGLs at December 31, 2013. Approximately 91% of the company's estimated proved reserves were natural gas and 55% were classified as proved developed at year-end 2014, compared to 100% and 61%, respectively, at year-end 2013.
The following table details additional information relating to reserve estimates as of and for the year ended December 31, 2014:
|
Natural Gas |
Oil |
NGL |
Total |
|||||
|
(Bcf) |
(MBbls) |
(MBbls) |
(Bcfe) |
|||||
|
Proved reserves, beginning of year |
6,974 |
373 |
– |
6,976 |
||||
|
Revisions of previous estimates |
542 |
(14) |
66 |
543 |
||||
|
Extensions, discoveries and other additions |
1,691 |
250 |
48 |
1,693 |
||||
|
Production |
(765) |
(235) |
(231) |
(768) |
||||
|
Acquisition of reserves in place |
1,367 |
37,246 |
118,816 |
2,304 |
||||
|
Disposition of reserves in place |
– |
(5) |
– |
(1) |
||||
|
Proved reserves, end of year |
9,809 |
37,615 |
118,699 |
10,747 |
||||
|
Proved developed reserves: |
||||||||
|
Beginning of year |
4,237 |
372 |
– |
4,240 |
||||
|
End of year |
5,675 |
7,445 |
38,632 |
5,951 |
||||
|
Note: Figures may not add due to rounding |
||||||||
In 2014, we replaced 591% of our production volumes with 1,693 Bcfe of proved reserve additions, net upward revisions of 543 Bcfe, and 2,304 Bcfe of proved reserve additions as a result of acquisitions. Of the reserve additions, 531 Bcfe were proved developed and 1,162 Bcfe were proved undeveloped. In 2014, we had revisions of 646 Bcf, (88) Bcf and (15) Bcf in our Northeast Appalachia, Fayetteville Shale and Ark-La-Tex divisions, respectively. Additionally, our reserves increased by 2,304 Bcfe in 2014 as a result of acquisitions primarily associated with acreage in West Virginia and southwest Pennsylvania. For the period ending December 31, 2014, the company's three-year average reserve replacement ratio, including revisions and acquisitions, was 351%. Excluding reserve revisions, the company's 2014 and three-year average reserve replacement ratios were 520% and 412%, respectively. Excluding the acquisition in West Virginia and southwest Pennsylvania that closed in December 2014, the company's 2014 and three-year average reserve replacement ratios, including revisions, were 291% and 235%, respectively.
The company's 2014 and three-year average finding and development costs, including revisions, were $0.98 and $1.31 per Mcfe, respectively, when excluding the acquisition in West Virginia and southwest Pennsylvania that closed in December 2014 (a non-GAAP financial measure computed below). Including reserve revisions and acquisitions, the company's 2014 and three-year average finding and development costs for the period ending December 31, 2014 were $1.59 per Mcfe and $1.60 per Mcfe, respectively.
The following table provides an overall and by category summary of the company's gas, oil and NGL reserves as of December 31, 2014 and sets forth 2014 annual information related to production and capital investments for each of its operating areas:
|
2014 PROVED RESERVES BY CATEGORY AND SUMMARY OPERATING DATA | ||||||||||||||||||||
|
Appalachia |
Ark-La-Tex |
|||||||||||||||||||
|
Fayetteville |
East |
Arkoma |
New |
|||||||||||||||||
|
Shale |
Northeast |
Southwest |
Texas |
Basin |
Ventures |
Total | ||||||||||||||
|
Estimated Proved Reserves: |
||||||||||||||||||||
|
Natural Gas (Bcf): |
||||||||||||||||||||
|
Developed (Bcf) |
3,353 |
1,594 |
543 |
42 |
141 |
2 |
5,675 | |||||||||||||
|
Undeveloped (Bcf) |
1,716 |
1,598 |
819 |
– |
1 |
– |
4,134 | |||||||||||||
|
5,069 |
3,192 |
1,362 |
42 |
142 |
2 |
9,809 | ||||||||||||||
|
Crude Oil (MMBbls): |
||||||||||||||||||||
|
Developed (MMBbls) |
– |
– |
7.0 |
– |
– |
0.4 |
7.4 | |||||||||||||
|
Undeveloped (MMBbls) |
– |
– |
30.2 |
– |
– |
– |
30.2 | |||||||||||||
|
– |
– |
37.2 |
– |
– |
0.4 |
37.6 | ||||||||||||||
|
Natural Gas Liquids (MMBbls): |
||||||||||||||||||||
|
Developed (MMBbls) |
– |
– |
38.5 |
– |
– |
0.1 |
38.6 | |||||||||||||
|
Undeveloped (MMBbls) |
– |
– |
80.1 |
– |
– |
– |
80.1 | |||||||||||||
|
– |
– |
118.6 |
– |
– |
0.1 |
118.7 | ||||||||||||||
|
Total Proved Reserves (Bcfe)(1): |
||||||||||||||||||||
|
Developed (Bcfe) |
3,353 |
1,594 |
816 |
42 |
141 |
5 |
5,951 | |||||||||||||
|
Undeveloped (Bcfe) |
1,716 |
1,598 |
1,481 |
– |
1 |
– |
4,796 | |||||||||||||
|
5,069 |
3,192 |
2,297 |
42 |
142 |
5 |
10,747 | ||||||||||||||
|
Percent of Total |
47% |
30% |
22% |
– |
1% |
– |
100% | |||||||||||||
|
Percent Proved Developed |
66% |
50% |
36% |
100% |
99% |
100% |
55% | |||||||||||||
|
Percent Proved Undeveloped |
34% |
50% |
64% |
– |
1% |
– |
45% | |||||||||||||
|
Production (Bcfe) |
494 |
254 |
3 |
5 |
10 |
2 |
768 | |||||||||||||
|
Capital Investments (millions)(2) |
$ |
944 |
$ |
695 |
$ |
5,012 |
$ |
2 |
$ |
3 |
$ |
493 |
$ |
7,149 | ||||||
|
Total Gross Producing Wells(3) |
4,027 |
522 |
1,034 |
153 |
1,138 |
13 |
6,887 | |||||||||||||
|
Total Net Producing Wells(3) |
2,777 |
257 |
800 |
94 |
556 |
10 |
4,494 | |||||||||||||
|
Total Net Acreage |
764,287 |
(4) |
266,073 |
(5) |
413,376 |
(6) |
48,292 |
(7) |
228,789 |
(8) |
4,181,044 |
(9) |
5,901,861 | |||||||
|
Net Undeveloped Acreage |
267,456 |
(4) |
205,491 |
(5) |
188,244 |
(6) |
64 |
(7) |
45,425 |
(8) |
4,170,687 |
(9) |
4,877,367 | |||||||
|
PV-10: |
||||||||||||||||||||
|
Pre-tax (millions)(10) |
$ |
5,250 |
$ |
2,120 |
$ |
1,859 |
$ |
55 |
$ |
175 |
$ |
(1) |
$ |
9,458 | ||||||
|
PV of taxes (millions)(10) |
1,063 |
429 |
376 |
11 |
36 |
– |
1,915 | |||||||||||||
|
After-tax (millions)(10) |
$ |
4,187 |
$ |
1,691 |
$ |
1,483 |
$ |
44 |
$ |
139 |
$ |
(1) |
$ |
7,543 | ||||||
|
Percent of Total |
55% |
22% |
20% |
1% |
2% |
– |
100% | |||||||||||||
|
Percent Operated(11) |
97% |
98% |
98% |
97% |
87% |
100% |
97% | |||||||||||||
|
(1) |
We have no reserves from synthetic gas, synthetic oil or nonrenewable natural resources intended to be upgraded into synthetic gas or oil. We used standard engineering and geoscience methods, or a combination of methodologies in determining estimates of material properties, including performance and test date analysis offset statistical analogy of performance data, volumetric evaluation, including analysis of petrophysical parameters (including porosity, net pay, fluid saturations (i.e., water, oil and gas) and permeability) in combination with estimated reservoir parameters (including reservoir temperature and pressure, formation depth and formation volume factors), geological analysis, including structure and isopach maps and seismic analysis, including review of 2-D and 3-D data to ascertain faults, closure and other factors. |
|
(2) |
Our Total and Fayetteville Shale capital investments exclude $105 million related to our drilling rig related equipment, sand facility and other equipment. |
|
(3) |
Represents all producing wells, including wells in which we only have an overriding royalty interest, as of December 31, 2014. |
|
(4) |
Assuming successful wells are not drilled to develop the acreage and leases are not extended, leasehold expiring over the next three years will be 15,289 net acres in 2015, 921 net acres in 2016, and 779 net acres in 2017 (excluding 158,231 net acres held on federal lands which are currently suspended by the Bureau of Land Management). |
|
(5) |
Assuming successful wells are not drilled to develop the acreage and leases are not extended, leasehold expiring over the next three years will be 32,215 net acres in 2015, 28,912 net acres in 2016 and 69,497 net acres in 2017. |
|
(6) |
Assuming successful wells are not drilled to develop the acreage and leases are not extended, leasehold expiring over the next three years will be 46,342 net acres in 2015, 41,184 net acres in 2016 and 44,256 net acres in 2017. Of this acreage, 16,876 net acres in 2015, 17,798 net acres in 2016 and 15,691 net acres in 2017 can be extended for an average of an additional 4.6 years. |
|
(7) |
Assuming successful wells are not drilled to develop the acreage and leases are not extended, leasehold expiring over the next three years will be 64 net acres in 2015, zero net acres in 2016 and zero net acres in 2017. |
|
(8) |
Includes 123,442 net developed acres and 432 net undeveloped acres in the Arkoma Basin that are also within our Fayetteville Shale focus area but not included in the Fayetteville Shale acreage in the table above. Assuming successful wells are not drilled to develop the acreage and leases are not extended, leasehold expiring over the next three years will be 15,332 net acres in 2015, 5,533 net acres in 2016 and 986 net acres in 2017. |
|
(9) |
Assuming successful wells are not drilled to develop the acreage and leases are not extended, our leasehold expiring over the next three years, excluding New Brunswick, Canada, the Brown Dense area and the Sand Wash Basin will be 143,109 net acres in 2015, 302,688 net acres in 2016 and 221,189 net acres in 2017. With regard to our acreage in New Brunswick, Canada, 2,518,518 net acres are scheduled to expire in March 2015. In February 2015, we requested an extension of our license agreement. With regard to our acreage in the Brown Dense, assuming successful wells are not drilled and leases are not extended, leasehold expiring over the next three years will be 153,866 net acres in 2015, 60,078 net acres in 2016 and 17,057 net acres in 2017. With regard to our acreage in the Sand Wash Basin, assuming successful wells are not drilled and leases are not extended, leasehold expiring over the next three years will be 107,963 net acres in 2015, 85,977 net acres in 2016, and 34,970 net acres in 2017. |
|
(10) |
Pre-tax PV-10 (a non-GAAP measure) is one measure of the value of a company's proved reserves that we believe is used by securities analysts to compare relative values among peer companies without regard to income taxes. The reconciling difference in pre-tax PV-10 and the after-tax PV-10, or standardized measure, is the discounted value of future income taxes on the estimated cash flows from our proved natural gas and oil reserves. |
|
(11) |
Based upon pre-tax PV-10 of proved developed producing activities. |
During 2014, excluding the acquisition closed in the fourth quarter of 2014, Southwestern invested a total of $2.2 billion in its E&P business and participated in drilling 576 wells, 280 of which were successful, and 296 which were in progress at year-end. Of the 296 wells in progress at year-end, 224 and 71 were located in its Fayetteville Shale and Northeast Appalachia divisions, respectively. Additionally, the company had 42 wells in progress in its new Southwest Appalachia division at the end of 2014. Of the $2.2 billion invested in the company's E&P business in 2014, $944 million was invested in the Fayetteville Shale, $695 million in Northeast Appalachia, $5 million in its Ark-La-Tex division and $493 million in New Ventures projects, including $288 million in the Sand Wash Basin and $115 million in the Brown Dense.
Excluding the acquisitions announced in the fourth quarter of 2014, of the $2.2 billion invested in 2014, $1.5 billion was invested in exploratory and development drilling and workovers, $247 million in capitalized interest and other expenses, $320 million for acquisition of properties, and $56 million for seismic expenditures. Additionally, the company invested $110 million in its drilling rig related equipment, sand facility and other equipment.
Northeast Appalachia – In 2014, Southwestern invested $695 million in Northeast Appalachia, which included $571 million to spud 99 operated wells. Total capital investments in Northeast Appalachia during 2014 also included $28 million for the acquisition of properties, $25 million for seismic and $71 million in facilities, capitalized costs and other expenses.
Southwestern's net gas production from Northeast Appalachia was 254 Bcf in 2014, up 69% from 151 Bcf in 2013. Gross operated production in Northeast Appalachia was over 1.0 Bcf per day at the end of 2014 compared to approximately 700 MMcf per day at the end of 2013.
Total proved reserves in Northeast Appalachia grew by 63% to 3,192 Bcf in 2014, compared to 1,963 Bcf in 2013. The net increase in reserves included reserve additions of 834 Bcf, 636 Bcf of upward revisions due to well performance, upward price revisions of 10 Bcf, acquisitions of 2 Bcf and production of 254 Bcf. The average gross proved reserves for the 200 undeveloped locations included in the company's 2014 year-end reserves was approximately 9.6 Bcf per well, compared to 6.9 Bcf per well for the 189 undeveloped locations as of December 2013.
In 2014, Southwestern's operated horizontal wells had an average completed well cost of $6.1 million per well, average horizontal lateral length of 4,752 feet and an average of 15 fracture stimulation stages. This compares to an average completed operated well cost of $7.0 million per well, average horizontal lateral length of 4,982 feet and an average of 18 fracture stimulation stages in 2013. In the fourth quarter of 2014, the average 30th-day rate was 6,472 Mcf per day on 23 wells that had an average lateral length of 5,151 feet and an average cost of $5.9 million per well. This compares to an average 30th-day rate of 6,159 Mcf per day on 18 wells that had an average lateral length of 5,288 feet and an average cost of $6.3 million per well in the third quarter of 2014.
As of December 31, 2014, Southwestern had spud 376 operated wells, 254 of which were horizontal and on production and 96 were in progress. Of the 254 operated horizontal wells on production, 117 were located in Bradford County, 20 were located in Lycoming County and 117 were located in Susquehanna County. Of the 96 wells in progress, 36 were either waiting on completion or waiting to be placed to sales, including 23 in Susquehanna County, 10 in Bradford County and 3 wells in Sullivan, Tioga and Wyoming Counties, combined.
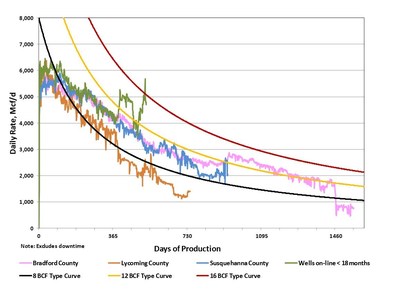
The graph below provides normalized average daily production data through December 31, 2014, for the company's horizontal wells in Northeast Appalachia. The "pink curve" indicates results for 117 wells in Bradford County, the "blue curve" indicates results for 117 wells in Susquehanna County, the "orange curve" indicates results for 20 wells in Lycoming County and the "green curve" indicates results for the 130 wells that have been put on production within the last 18 months. The normalized production curves are intended to provide a qualitative indication of the company's Northeast Appalachia wells' performance and should not be used to estimate an individual well's estimated ultimate recovery. The 8, 12 and 16 Bcf typecurves are shown solely for reference purposes and are not intended to be projections of the performance of the company's wells.

At December 31, 2014, Southwestern held leases for approximately 266,073 net acres in Northeast Appalachia, compared to approximately 292,446 net acres at year-end 2013. In addition to this acreage, the company also closed the previously announced transaction in January 2015 to acquire an additional 46,700 net acres. In 2015, Southwestern plans to invest approximately $700 million, excluding the acquisition costs for transactions closed in January 2015, in Northeast Appalachia and expects to participate in a total of 88 to 92 gross operated wells in 2015.
Southwest Appalachia – In December 2014, the Company closed a transaction to acquire oil and gas assets in West Virginia and southwest Pennsylvania for approximately $5.0 billion. This acreage has at least three drilling objectives, namely the Marcellus, Utica and Upper Devonian Shales. As of December 31, 2014, we had approximately 413,376 net acres in Southwest Appalachia (188,244 net undeveloped acres and 225,132 net developed acres held by production). On this acreage, the average working interest was 68% with an average net revenue interest of 86% at December 31, 2014, with the average working interest increasing to 73% upon the closing of the acquisition from Statoil in January 2015.
Approximately 2,297 Bcfe of our total proved net reserves at year-end 2014 were attributable to Southwest Appalachia, of which 2,260 Bcfe were associated with the Marcellus Shale. The Company had a total of 255 horizontal and 667 vertical wells that the Company operated and that were on production as of December 31, 2014. Additionally, there were 42 horizontal Marcellus wells in progress at the end of 2014.
Southwestern's 2014 year-end reserves in Southwest Appalachia include a total of 1,502 locations, of which 1,034 were proved developed producing, 124 were proved developed non-producing and 344 were proved undeveloped. The average gross proved reserves for the undeveloped wells included in our year-end reserves for 2014 was approximately 8.4 Bcfe per well.
In 2015, Southwestern plans to invest approximately $520 million, excluding the acquisition costs for transactions closed in January 2015, in Southwest Appalachia and expect to participate in a total of 50 to 55 gross wells in 2015, most of which will be operated by the Company. In 2015, we estimate our net production from Southwest Appalachia will be in the range of 136 to 141 Bcfe.
Fayetteville Shale – In 2014, Southwestern invested $944 million in the Fayetteville Shale, which included $838 million to spud 468 wells, 464 of which were operated. Total capital investments in the Fayetteville Shale during 2014 also included $7 million for the acquisition of properties and $99 million in capitalized costs and other expenses.
Southwestern's net gas production from the Fayetteville Shale was 494 Bcf in 2014, compared to 486 Bcf in 2013. Gross operated gas production in the Fayetteville Shale was approximately 2,132 MMcf per day at the end of 2014 compared to approximately 2,011 MMcf per day at the end of 2013.
Total proved reserves in the Fayetteville Shale grew to 5,069 Bcf in 2014, compared to 4,795 Bcf in 2013. The net increase in reserves included reserve additions of 856 Bcf, net downward revisions of 88 and production of 494 Bcf. A total of 1,213 undeveloped locations were included in the 2014 year-end reserves at approximately 2.3 Bcf per well, compared to the 1,061 undeveloped locations booked as of December 2013.
Southwestern's operated horizontal wells had an average completed well cost of $2.6 million per well, average horizontal lateral length of 5,440 feet and average time to drill to total depth of 6.8 days from re-entry to re-entry in 2014. This compares to an average completed operated well cost of $2.4 million per well, average horizontal lateral length of 5,356 feet and average time to drill to total depth of 6.2 days from re-entry to re-entry in 2013.
Southwestern placed 454 operated wells on production during 2014 with average initial production rates of 4,430 Mcf per day, compared to 414 operated wells with average initial production rates of 4,041 Mcf per day in 2013. The increase in initial production rates in 2014 was primarily due to longer lateral lengths, improved well bore placement, and further refined completion and flowback techniques. During 2014, the company placed 145 operated wells on production with initial production rates that exceeded 5,000 Mcf per day, compared to 93 wells in 2013. In its tenth year of development, 24 of its 30 highest initial production rate wells in the history of the Fayetteville Shale were drilled and placed on production during 2014.
During the fourth quarter of 2014, the company's horizontal wells had an average initial production rate of 4,840 Mcf per day, average completed well cost of $2.7 million per well, average horizontal lateral length of 5,547 feet and average time to drill to total depth of 7.2 days from re-entry to re-entry. This compares to an average initial production rate of 4,303 Mcf per day, an average horizontal lateral length of 5,202 feet, average time to drill to total depth of 6.5 days from re-entry to re-entry and an average completed well cost of $2.4 million per well in the third quarter of 2014.
In the fourth quarter of 2014, the company placed 39 operated wells on production with initial production rates that exceeded 5,000 Mcf per day, 26 wells that exceeded 6,000 Mcf per day and four that exceeded 10,000 Mcf per day.
At December 31, 2014, Southwestern held leases for approximately 888,161 net acres in the Fayetteville Shale area, compared to approximately 905,684 net acres at year-end 2013. In 2015, Southwestern plans to invest approximately $560 million in the Fayetteville Shale and drill approximately 225 to 235 gross horizontal wells, all of which will be operated by the company.
New Ventures – As of December 31, 2014, Southwestern held 4,170,687 net undeveloped acres in connection with its New Ventures prospects, of which 2,518,518 net acres were located in New Brunswick, Canada. This compares to 3,972,732 net undeveloped acres held at year-end 2013. The New Ventures portfolio includes multiple projects at various stages in their exploration lifecycle.
In 2014, the Company acquired approximately 376,497 net acres in northwest Colorado targeting crude oil, natural gas liquids and natural gas contained in the Sand Wash Basin. Testing of the play commenced in the second half of the year with the Company drilling four vertical wells and one horizontal well. Results have been encouraging to date and the Company intends to continue to test the play in 2015.
Our Brown Dense project is an unconventional liquids rich play in southern Arkansas and northern Louisiana. As of December 31, 2014, we held approximately 304,371 net acres in the area. During 2014, the Company drilled its most economic well to date, the Benson 27-22-1 #1, with an initial rate of over 700 barrels of oil per day and 2.1 million cubic feet of gas per day. After six months of production, the well is still producing over 400 barrels of oil per day and 1.7 million cubic feet of gas per day and has had total cumulative production of almost 1.0 Bcfe to date. As of December 31, 2014, we had drilled 14 operated wells in the play area, 6 of which were currently producing. In 2015, the Company plans to analyze 75 square miles of recently acquired 3-D seismic data and further test the play.
Ark-La-Tex – In 2014, Southwestern invested $5 million in its Ark-La-Tex division. Net production from these assets was 15 Bcfe in 2014, compared to 18 Bcfe in 2013, and total proved net reserves were approximately 184 Bcfe at December 31, 2014, compared to 216 Bcfe at year-end 2013. As previously announced, the company is currently planning to divest these assets during the first half of 2015 as part of the funding for the acquisitions announced in the fourth quarter of 2014.
Explanation and Reconciliation of Non-GAAP Financial Measures
The company reports its financial results in accordance with accounting principles generally accepted in the United States of America ("GAAP"). However, management believes certain non-GAAP performance measures may provide financial statement users with additional meaningful comparisons between current results and the results of its peers and of prior periods.
One such non-GAAP financial measure is net cash provided by operating activities before changes in operating assets and liabilities. Management presents this measure because (i) it is accepted as an indicator of an oil and gas exploration and production company's ability to internally fund exploration and development activities and to service or incur additional debt, (ii) changes in operating assets and liabilities relate to the timing of cash receipts and disbursements which the company may not control and (iii) changes in operating assets and liabilities may not relate to the period in which the operating activities occurred.
Additional non-GAAP financial measures the company may present from time to time are adjusted net income, adjusted diluted earnings per share, adjusted EBITDA and its E&P segment operating income, all which exclude certain charges or amounts. Management presents these measures because (i) they are consistent with the manner in which the company's performance is measured relative to the performance of its peers, (ii) these measures are more comparable to earnings estimates provided by securities analysts, and (iii) charges or amounts excluded cannot be reasonably estimated and guidance provided by the company excludes information regarding these types of items. These adjusted amounts are not a measure of financial performance under GAAP.
See the reconciliations below of GAAP financial measures to non-GAAP financial measures for the three and twelve months ended December 31, 2014 and December 31, 2013. Non-GAAP financial measures should not be considered in isolation or as a substitute for the company's reported results prepared in accordance with GAAP.
|
3 Months Ended Dec. 31, | |||
|
2014 |
2013 | ||
|
(in millions) | |||
|
Net income: |
|||
|
Net income |
$ 312 |
$ 144 | |
|
Add back (deduct): |
|||
|
Loss (Gain) on certain derivatives (net of taxes) |
(84) |
31 | |
|
Adjustments due to discrete tax items(1) |
(46) |
13 | |
|
Transaction costs (net of taxes) |
3 |
-- | |
|
Adjusted net income |
$ 185 |
$ 188 | |
|
12 Months Ended Dec. 31, | |||
|
2014 |
2013 | ||
|
(in millions) | |||
|
Net income: |
|||
|
Net income |
$ 924 |
$ 704 | |
|
Add back (deduct): |
|||
|
Loss (Gain) on certain derivatives (net of taxes) |
(80) |
(13) | |
|
Adjustments due to discrete tax items(1) |
(46) |
13 | |
|
Transaction costs (net of taxes) |
3 |
-- | |
|
Adjusted net income |
$ 801 |
$ 704 | |
|
3 Months Ended Dec. 31, | |||
|
2014 |
2013 | ||
|
Diluted earnings per share: |
|||
|
Diluted earnings per share |
$ 0.88 |
$ 0.41 | |
|
Add back (deduct): |
|||
|
Loss (Gain) on certain derivatives (net of taxes) |
(0.24) |
0.09 | |
|
Adjustments due to discrete tax items(1) |
(0.13) |
0.04 | |
|
Transaction costs (net of taxes) |
0.01 |
-- | |
|
Adjusted diluted earnings per share |
$ 0.52 |
$ 0.54 | |
|
12 Months Ended Dec. 31, | |||
|
2014 |
2013 | ||
|
Diluted earnings per share: |
|||
|
Diluted earnings per share |
$ 2.62 |
$ 2.00 | |
|
Add back (deduct): |
|||
|
Loss (Gain) on certain derivatives (net of taxes) |
(0.23) |
(0.04) | |
|
Adjustments due to discrete tax items(1) |
(0.13) |
0.04 | |
|
Transaction costs (net of taxes) |
0.01 |
-- | |
|
Adjusted diluted earnings per share |
$ 2.27 |
$ 2.00 | |
|
3 Months Ended Dec. 31, | |||
|
2014 |
2013 | ||
|
(in millions) | |||
|
Cash flow from operating activities: |
|||
|
Net cash provided by operating activities |
$ 561 |
$ 531 | |
|
Add back (deduct): |
|||
|
Changes in operating assets and liabilities |
9 |
7 | |
|
Net cash provided by operating activities before changes in operating assets and liabilities |
$ 570 |
$ 538 | |
|
12 Months Ended Dec. 31, | |||
|
2014 |
2013 | ||
|
(in millions) | |||
|
Cash flow from operating activities: |
|||
|
Net cash provided by operating activities |
$ 2,335 |
$ 1,909 | |
|
Add back (deduct): |
|||
|
Changes in operating assets and liabilities |
(65) |
76 | |
|
Net cash provided by operating activities before changes in operating assets and liabilities |
$ 2,270 |
$ 1,985 | |
|
(1) |
Primarily relates to the exclusion of certain discrete tax adjustments that were recognized in the fourth quarter of 2014 due to a redetermination of deferred state tax liabilities to reflect updated state apportionment factors. The company expects its 2015 effective income tax rate to be 38.5%. |
Finding and development costs – Finding and development (F&D) costs are computed by dividing acquisition, exploration and development capital costs incurred for the indicated period by reserve additions, including reserves acquired, for that same period. The following computes F&D costs using information required by GAAP for the periods ending December 31, 2014 and 2013 and the three years ending December 31, 2014. A breakdown is also shown detailing these amounts separately for Northeast Appalachia and the Fayetteville Shale.
|
Northeast Appalachia |
Fayetteville Shale | ||||||
|
For the 12 Months |
For the 12 Months |
For the 12 Months |
For the 12 Months | ||||
|
Ending |
Ending |
Ending |
Ending | ||||
|
December 31, 2014 |
December 31, 2013 |
December 31, 2014 |
December 31, 2013 | ||||
|
Total exploration, development and acquisition costs incurred ($ in thousands) |
$ 711,647 |
$ 880,997 |
$ 972,823 |
$ 939,052 | |||
|
Reserve extensions, discoveries and acquisitions (MMcfe) |
836,250 |
1,200,232 |
856,307 |
2,086,596 | |||
|
Finding and development costs, excluding revisions ($/Mcfe) |
$ 0.85 |
$ 0.73 |
$ 1.14 |
$ 0.45 | |||
|
Reserve extensions, discoveries, acquisitions and reserve revisions (MMcfe) |
1,482,675 |
1,297,162 |
767,616 |
2,293,587 | |||
|
Finding and development costs, including revisions ($/Mcfe) |
$ 0.48 |
$ 0.68 |
$ 1.27 |
$ 0.41 | |||
|
Total Company |
|||||||
|
For the 12 Months |
For the 12 Months |
For the 3 Years |
|||||
|
Ending |
Ending |
Ending |
|||||
|
December 31, 2014 |
December 31, 2013 |
December 31, 2014 |
|||||
|
Total exploration, development and acquisition costs incurred ($ in thousands) |
$ 7,220,776 |
$ 2,023,278 |
$ 11,154,997 |
||||
|
Reserve extensions, discoveries and acquisitions (MMcfe) |
3,996,875 |
3,288,984 |
8,205,374 |
||||
|
Finding and development costs, excluding revisions ($/Mcfe) |
$ 1.81 |
$ 0.62 |
$ 1.36 |
||||
|
Reserve extensions, discoveries, acquisitions and reserve revisions (MMcfe) |
4,539,478 |
3,614,884 |
6,985,630 |
||||
|
Finding and development costs, including revisions ($/Mcfe) |
$ 1.59 |
$ 0.56 |
$ 1.60 |
||||
|
Finding and development costs, including revisions and excluding Dec 2014 |
$ 0.98 |
$ 0.56 |
$ 1.31 |
||||
The company believes that providing a measure of F&D costs is useful for investors as a means of evaluating a company's cost to add proved reserves, on a per thousand cubic feet of natural gas equivalent basis. These measures are provided in addition to, and not as an alternative for the financial statements, including the notes thereto, contained in Southwestern's Annual Report. Due to various factors, including timing differences, F&D costs do not necessarily reflect precisely the costs associated with particular reserves. For example, exploration costs may be recorded in periods prior to the periods in which related acquisitions and increases in reserves are recorded and development costs, including future development costs for proved undeveloped reserve additions, may be recorded in periods subsequent to the periods in which related increases in reserves are recorded. In addition, changes in commodity prices can affect the magnitude of recorded increases in reserves independent of the related costs of such increases. As a result of the foregoing factors and various factors that could materially affect the timing and amounts of future increases in reserves and the timing and amounts of future costs, including factors disclosed in Southwestern's filings with the SEC, future F&D costs may differ materially from those set forth above. Further, the methods used by Southwestern to calculate its F&D costs may differ significantly from methods used by other companies to compute similar measures and, as a result, Southwestern's F&D costs may not be comparable to similar measures provided by other companies.
Southwestern management will host a teleconference call on Friday, February 27, 2015 at 10:00 a.m. EST to discuss its fourth quarter and year-end 2014 results. The toll-free number to call is 877-407-8035 and the international dial-in number is 201-689-8035. The teleconference can also be heard "live" on the Internet at http://www.swn.com.
Southwestern Energy Company is an independent energy company whose wholly-owned subsidiaries are engaged in natural gas and oil exploration, development and production, natural gas gathering and marketing. Additional information on the company can be found on the Internet at http://www.swn.com.
All statements, other than historical facts and financial information, may be deemed to be forward-looking statements within the meaning of Section 27A of the Securities Act of 1933, as amended, and Section 21E of the Securities Exchange Act of 1934, as amended. All statements that address activities, outcomes and other matters that should or may occur in the future, including, without limitation, statements regarding the financial position, business strategy, production and reserve growth and other plans and objectives for the company's future operations, are forward-looking statements. Although the company believes the expectations expressed in such forward-looking statements are based on reasonable assumptions, such statements are not guarantees of future performance and actual results or developments may differ materially from those in the forward-looking statements. The company has no obligation and makes no undertaking to publicly update or revise any forward-looking statements, other than to the extent set forth below. You should not place undue reliance on forward-looking statements. They are subject to known and unknown risks, uncertainties and other factors that may affect the company's operations, markets, products, services and prices and cause its actual results, performance or achievements to be materially different from any future results, performance or achievements expressed or implied by the forward-looking statements. In addition to any assumptions and other factors referred to specifically in connection with forward-looking statements, risks, uncertainties and factors that could cause the company's actual results to differ materially from those indicated in any forward-looking statement include, but are not limited to: the timing and extent of changes in market conditions and prices for natural gas and oil (including regional basis differentials); the company's ability to transport its production to the most favorable markets or at all; the timing and extent of the company's success in discovering, developing, producing and estimating reserves; the economic viability of, and the company's success in drilling, the company's large acreage position in various areas and, in particular, the Fayetteville Shale play, overall as well as relative to other productive shale gas areas; the company's ability to fund the company's planned capital investments; the impact of federal, state and local government regulation, including any legislation relating to hydraulic fracturing, the climate or over the counter derivatives; the company's ability to determine the most effective and economic fracture stimulation for its shale plays; the costs and availability of oil field personnel services and drilling supplies, raw materials, and equipment and services; the company's future property acquisition or divestiture activities; increased competition; the company's ability to access debt and equity capital markets to refinance its short- and long-term bank debt; the financial impact of accounting regulations and critical accounting policies; the comparative cost of alternative fuels; conditions in capital markets, changes in interest rates and the ability of the company's lenders to provide it with funds as agreed; credit risk relating to the risk of loss as a result of non-performance by the company's counterparties and any other factors listed in the reports the company has filed and may file with the Securities and Exchange Commission (SEC). For additional information with respect to certain of these and other factors, see the reports filed by the company with the SEC. The company disclaims any intention or obligation to update or revise any forward-looking statements, whether as a result of new information, future events or otherwise.
|
OPERATING STATISTICS (Unaudited) |
Page 1 of 5 | |||||||||||
|
Southwestern Energy Company and Subsidiaries |
||||||||||||
|
Three Months |
Twelve Months | |||||||||||
|
Periods Ended December 31, |
2014 |
2013 |
2014 |
2013 | ||||||||
|
Exploration & Production |
||||||||||||
|
Production |
||||||||||||
|
Gas Production (Bcf) |
199 |
176 |
766 |
656 | ||||||||
|
Oil Production (MBbls) |
121 |
36 |
235 |
138 | ||||||||
|
NGL production (MBbls) |
204 |
10 |
231 |
50 | ||||||||
|
Total equivalent production (Bcfe) |
201 |
177 |
768 |
657 | ||||||||
|
Commodity Prices |
||||||||||||
|
Average realized gas price per Mcf, including hedges |
$ |
3.52 |
$ |
3.68 |
$ |
3.72 |
$ |
3.65 | ||||
|
Average realized gas price per Mcf, excluding hedges |
$ |
3.26 |
$ |
3.15 |
$ |
3.74 |
$ |
3.17 | ||||
|
Average oil price per Bbl |
$ |
60.51 |
$ |
98.41 |
$ |
79.91 |
$ |
103.32 | ||||
|
Average NGL price per Bbl |
$ |
12.38 |
$ |
41.54 |
$ |
15.72 |
$ |
43.63 | ||||
|
Summary of Derivative Activity in the Statement of Operations (in millions) |
||||||||||||
|
Settled Commodity Amounts included in "Operating Revenues" |
$ |
22 |
$ |
91 |
$ |
(26) |
$ |
309 | ||||
|
Settled Commodity Amounts included in "Gain (Loss) on Derivatives" |
$ |
31 |
$ |
2 |
$ |
9 |
$ |
5 | ||||
|
Unsettled Commodity Amounts included in "Gain (Loss) on Derivatives" |
$ |
137 |
$ |
(51) |
$ |
130 |
$ |
21 | ||||
|
Operating Expenses per Mcfe |
||||||||||||
|
Lease operating expenses |
$ |
0.90 |
$ |
0.89 |
$ |
0.91 |
$ |
0.86 | ||||
|
General & administrative expenses |
$ |
0.24 |
$ |
0.26 |
$ |
0.24 |
$ |
0.24 | ||||
|
Taxes, other than income taxes |
$ |
0.10 |
$ |
0.11 |
$ |
0.11 |
$ |
0.10 | ||||
|
Full cost pool amortization |
$ |
1.12 |
$ |
1.10 |
$ |
1.10 |
$ |
1.08 | ||||
|
Midstream |
||||||||||||
|
Gas volumes marketed (Bcf) |
234 |
211 |
904 |
786 | ||||||||
|
Gas volumes gathered (Bcf) |
243 |
233 |
963 |
900 | ||||||||
|
STATEMENTS OF OPERATIONS (Unaudited) |
Page 2 of 5 | |||||||||||
|
Southwestern Energy Company and Subsidiaries |
||||||||||||
|
Three Months |
Twelve Months | |||||||||||
|
Periods Ended December 31, |
2014 |
2013 |
2014 |
2013 | ||||||||
|
(in millions, except share/per share amounts) | ||||||||||||
|
Operating Revenues |
||||||||||||
|
Gas sales |
$ |
672 |
$ |
645 |
$ |
2,827 |
$ |
2,381 | ||||
|
Oil sales |
9 |
4 |
22 |
16 | ||||||||
|
Marketing |
231 |
210 |
996 |
792 | ||||||||
|
Gas gathering |
50 |
48 |
193 |
182 | ||||||||
|
962 |
907 |
4,038 |
3,371 | |||||||||
|
Operating Costs and Expenses |
||||||||||||
|
Marketing purchases |
228 |
206 |
980 |
782 | ||||||||
|
Operating expenses |
118 |
92 |
427 |
328 | ||||||||
|
General and administrative expenses |
59 |
56 |
221 |
191 | ||||||||
|
Depreciation, depletion and amortization |
249 |
215 |
942 |
787 | ||||||||
|
Taxes, other than income taxes |
23 |
21 |
95 |
79 | ||||||||
|
677 |
590 |
2,665 |
2,167 | |||||||||
|
Operating Income |
285 |
317 |
1,373 |
1,204 | ||||||||
|
Interest Expense |
||||||||||||
|
Interest on debt |
26 |
25 |
101 |
100 | ||||||||
|
Other interest charges |
9 |
1 |
13 |
4 | ||||||||
|
Interest capitalized |
(15) |
(14) |
(55) |
(62) | ||||||||
|
20 |
12 |
59 |
42 | |||||||||
|
Other Gain (Loss), Net |
(5) |
2 |
(4) |
2 | ||||||||
|
Gain (Loss) on Derivatives |
168 |
(49) |
139 |
26 | ||||||||
|
Income Before Income Taxes |
428 |
258 |
1,449 |
1,190 | ||||||||
|
Provision (Benefit) for Income Taxes |
||||||||||||
|
Current |
(13) |
(11) |
21 |
(11) | ||||||||
|
Deferred |
129 |
125 |
504 |
497 | ||||||||
|
116 |
114 |
525 |
486 | |||||||||
|
Net Income |
$ |
312 |
$ |
144 |
$ |
924 |
$ |
704 | ||||
|
Earnings Per Share |
||||||||||||
|
Basic |
$ |
0.89 |
$ |
0.41 |
$ |
2.63 |
$ |
2.01 | ||||
|
Diluted |
$ |
0.88 |
$ |
0.41 |
$ |
2.62 |
$ |
2.00 | ||||
|
Weighted Average Common Shares Outstanding | ||||||||||||
|
Basic |
351,710,349 |
350,851,141 |
351,446,747 |
350,465,430 | ||||||||
|
Diluted |
352,289,601 |
351,364,481 |
352,410,683 |
351,101,452 | ||||||||
|
BALANCE SHEETS (Unaudited) |
Page 3 of 5 | |||||
|
Southwestern Energy Company and Subsidiaries |
||||||
|
December 31, |
2014 |
2013 | ||||
|
(in millions) | ||||||
|
ASSETS |
||||||
|
Current assets |
$ |
1,115 |
$ |
644 | ||
|
Property and equipment |
22,557 |
15,303 | ||||
|
Less: Accumulated depreciation, depletion and amortization |
(8,845) |
(8,006) | ||||
|
Total property and equipment, net |
13,712 |
7,297 | ||||
|
Other long-term assets |
98 |
107 | ||||
|
Total assets |
14,925 |
8,048 | ||||
|
LIABILITIES AND EQUITY |
||||||
|
Current liabilities |
5,428 |
688 | ||||
|
Long-term debt |
2,466 |
1,950 | ||||
|
Deferred income taxes |
1,951 |
1,532 | ||||
|
Other long-term liabilities |
418 |
256 | ||||
|
Commitments and contingencies |
– |
– | ||||
|
Total liabilities |
10,263 |
4,426 | ||||
|
Equity |
||||||
|
Common stock, $0.01 par value; authorized 1,250,000,000 |
4 |
4 | ||||
|
Additional paid-in capital |
1,019 |
969 | ||||
|
Retained earnings |
3,577 |
2,653 | ||||
|
Accumulated other comprehensive income (loss) |
62 |
(4) | ||||
|
Common stock in treasury; 11,055 shares in 2014 |
– |
– | ||||
|
Total equity |
4,662 |
3,622 | ||||
|
Total liabilities and equity |
$ |
14,925 |
$ |
8,048 | ||
|
STATEMENTS OF CASH FLOWS (Unaudited) |
Page 4 of 5 | |||||
|
Southwestern Energy Company and Subsidiaries |
||||||
|
Twelve Months | ||||||
|
Periods Ended December 31, |
2014 |
2013 | ||||
|
(in millions) | ||||||
|
Cash Flows From Operating Activities |
||||||
|
Net Income |
$ |
924 |
$ |
704 | ||
|
Adjustment to reconcile net income to net cash provided by operating |
||||||
|
Depreciation, depletion and amortization |
942 |
787 | ||||
|
Amortization of debt issuance cost |
10 |
4 | ||||
|
Deferred income taxes |
504 |
497 | ||||
|
(Gain) loss on derivatives, net of settlement |
(130) |
(21) | ||||
|
Stock-based compensation |
18 |
13 | ||||
|
Other |
2 |
1 | ||||
|
Change in assets and liabilities |
65 |
(76) | ||||
|
Net cash provided by operating activities |
2,335 |
1,909 | ||||
|
Cash Flows From Investing Activities |
||||||
|
Capital investments |
(2,043) |
(2,157) | ||||
|
Acquisition of oil and gas properties |
(5,298) |
(96) | ||||
|
Proceeds from sale of property and quipment |
43 |
18 | ||||
|
Transfers to restricted cash |
– |
9 | ||||
|
Other |
10 |
10 | ||||
|
Net cash used in investing activities |
(7,288) |
(2,216) | ||||
|
Cash Flows From Financing Activities |
||||||
|
Payments on current portions of long-term debt |
(1) |
(1) | ||||
|
Payments on revolving long-term debt |
(5,179) |
(3,148) | ||||
|
Borrowings under revolving long-term debt |
5,196 |
3,430 | ||||
|
Change in bank drafts outstanding |
11 |
(7) | ||||
|
Proceeds from issuance of long-term debt |
500 |
– | ||||
|
Proceeds from short-term debt |
4,500 |
– | ||||
|
Debt Issuance costs |
(56) |
– | ||||
|
Proceeds from exercise of common stock options |
12 |
10 | ||||
|
Other |
– |
(7) | ||||
|
Net cash provided by financing activities |
4,983 |
277 | ||||
|
Effect of exchange rate changes on cash |
– |
(1) | ||||
|
Increase (decrease) in cash and cash equivalents |
30 |
(31) | ||||
|
Cash and cash equivalents at beginning of year |
23 |
54 | ||||
|
Cash and cash equivalents at end of period |
$ |
53 |
$ |
23 | ||
|
SEGMENT INFORMATION (Unaudited) |
Page 5 of 5 | |||||||||||||
|
Southwestern Energy Company and Subsidiaries |
||||||||||||||
|
Exploration |
||||||||||||||
|
& |
Midstream |
|||||||||||||
|
Production |
Services |
Other |
Eliminations |
Total | ||||||||||
|
(in millions) | ||||||||||||||
|
Quarter Ending December 31, 2014 |
||||||||||||||
|
Revenues |
$ |
680 |
$ |
1,014 |
$ |
– |
$ |
(732) |
$ |
962 | ||||
|
Gas purchases |
– |
855 |
– |
(627) |
228 | |||||||||
|
Operating expenses |
180 |
42 |
1 |
(105) |
118 | |||||||||
|
General & administrative expenses |
49 |
10 |
– |
– |
59 | |||||||||
|
Depreciation, depletion & amortization |
234 |
15 |
– |
– |
249 | |||||||||
|
Taxes, other than income taxes |
21 |
3 |
(1) |
– |
23 | |||||||||
|
Operating income |
196 |
89 |
– |
– |
285 | |||||||||
|
Capital investments(1) |
5,548 |
35 |
27 |
– |
5,610 | |||||||||
|
Quarter Ending December 31, 2013 |
||||||||||||||
|
Revenues |
$ |
652 |
$ |
891 |
$ |
– |
$ |
(636) |
$ |
907 | ||||
|
Gas purchases |
– |
740 |
– |
(534) |
206 | |||||||||
|
Operating expenses |
158 |
36 |
– |
(102) |
92 | |||||||||
|
General & administrative expenses |
46 |
10 |
– |
– |
56 | |||||||||
|
Depreciation, depletion & amortization |
202 |
13 |
– |
– |
215 | |||||||||
|
Taxes, other than income taxes |
19 |
2 |
– |
– |
21 | |||||||||
|
Operating income (loss) |
227 |
90 |
– |
– |
317 | |||||||||
|
Capital investments(1) |
450 |
22 |
8 |
– |
480 | |||||||||
|
Twelve months Ending Dec 31, 2014 |
||||||||||||||
|
Revenues |
$ |
2,862 |
$ |
4,358 |
$ |
– |
$ |
(3,182) |
$ |
4,038 | ||||
|
Gas purchases |
– |
3,738 |
– |
(2,758) |
980 | |||||||||
|
Operating expenses |
697 |
153 |
1 |
(424) |
427 | |||||||||
|
General & administrative expenses |
183 |
38 |
– |
– |
221 | |||||||||
|
Depreciation, depletion & amortization |
884 |
58 |
– |
– |
942 | |||||||||
|
Taxes, other than income taxes |
85 |
10 |
– |
– |
95 | |||||||||
|
Operating income (loss) |
1,013 |
361 |
(1) |
– |
1,373 | |||||||||
|
Capital investments(1) |
7,254 |
144 |
49 |
– |
7,447 | |||||||||
|
Twelve months Ending Dec 31, 2013 |
||||||||||||||
|
Revenues |
$ |
2,404 |
$ |
3,347 |
$ |
– |
$ |
(2,380) |
$ |
3,371 | ||||
|
Gas purchases |
– |
2,783 |
– |
(2,001) |
782 | |||||||||
|
Operating expenses |
564 |
143 |
– |
(379) |
328 | |||||||||
|
General & administrative expenses |
157 |
34 |
– |
– |
191 | |||||||||
|
Depreciation, depletion & amortization |
736 |
51 |
– |
– |
787 | |||||||||
|
Taxes, other than income taxes |
68 |
11 |
– |
– |
79 | |||||||||
|
Operating income |
879 |
325 |
– |
– |
1,204 | |||||||||
|
Capital investments(1) |
2,052 |
158 |
25 |
– |
2,235 | |||||||||
|
(1) Capital investments includes an increase of $41 million and a decrease of $63 million for the three-month periods ended December 31, 2014 and 2013, respectively, and an increase of $155 million and a decrease of $37 million for the twelve-month periods ended December 31, 2014 and 2013, respectively, relating to the change in accrued expenditures between periods. |
Photo - http://photos.prnewswire.com/prnh/20150226/178089-INFO
To view the original version on PR Newswire, visit:http://www.prnewswire.com/news-releases/southwestern-energy-announces-2014-financial-and-operating-results-and-revises-2015-capital-investment-program-and-guidance-300042465.html
SOURCE Southwestern Energy Company

© 2024 Benzinga.com. Benzinga does not provide investment advice. All rights reserved.
Trade confidently with insights and alerts from analyst ratings, free reports and breaking news that affects the stocks you care about.

