


The Vanguard FTSE Developed Markets ETF VEA just formed a Golden Cross on the technical charts. Developed markets, outside the U.S., hope for a bullish price trend ahead.
The VEA ETF: The VEA ETF tracks the FTSE Developed ex-U.S. All Cap Net Tax (US RIC) Index. It offers exposure to developed markets outside of North America, including:
- Europe (~53%)
- Japan (20%)
- Australia (6%).
In essence, it is an investment vehicle popularly used to get overweight ex-U.S. developed markets.
Currently, 70% of the ETF is invested in large-cap stocks, with the financial sector being the dominating sector at 21.62%.
The VEA ETF trumps the iShares MSCI EAFE ETF EFA in depth of holdings and cost efficiency. While the VEA is invested across 4,500 holdings, the EFA portfolio is spread across 1,000 holdings. The VEA has an expense ratio of 0.05% versus the EFA which charges 0.35%.
“Japanese stocks remain attractive, given rerating potential driven by corporate governance reforms,” John Bilton, head of Global Multi-Asset Strategy at JPMorgan, said.
For the first quarter of 2024, Bilton expects to see U.K. equity as cheap and supported by valuations and flows.
“It is a defensive market; with a positive gearing towards commodities,” he added.
Wells Fargo has a year-end 2024 target of 2,000-2,200 for the MSCI EAFE Index which tracks the developed markets ex-U.S. and Canada. The investment firm said they “prefer developed-market over emerging-market equities.”
Compelling alternatives to the VEA ETF include: the Vanguard Total International Stock ETF VXUS and the RAFI-weighted Invesco FTSE RAFI Developed Markets ex-U.S. ETF PXF (which also includes Canadian stocks).
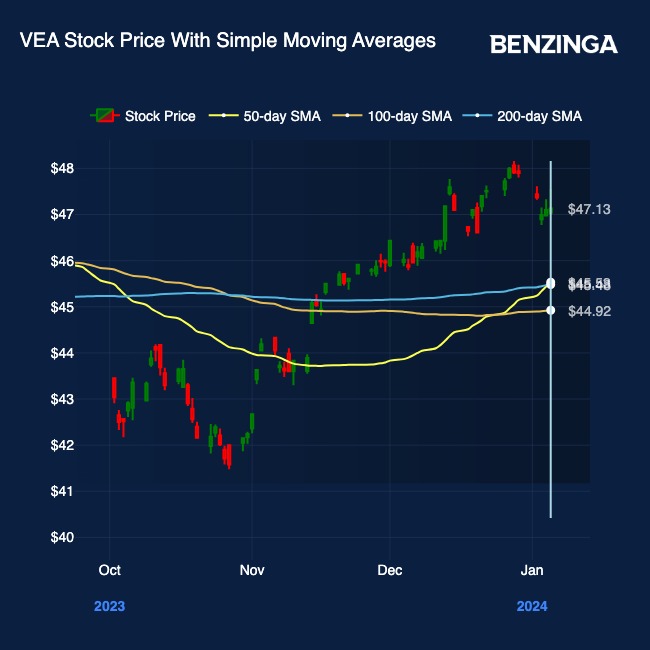
The VEA Chart: The VEA technical price chart indicates a Golden Cross forming. The 50-day SMA can be seen crossing over the 200-day SMA, indicating a bullish trend kicking in.

At a P/E ratio of 12.97, investors in developed markets may find the VEA particularly attractive.
Now Read: Earnings Season Preview – How Will Corporate Profit Outlooks Impact Markets In 2024?
Image: Shutterstock
© 2024 Benzinga.com. Benzinga does not provide investment advice. All rights reserved.
Trade confidently with insights and alerts from analyst ratings, free reports and breaking news that affects the stocks you care about.

