


(Friday Market Open) U.S. equity futures moved higher early Friday as investors digested better-than-expected June retail sales data and China’s worst GDP numbers since the start of the pandemic. Later this morning, many are awaiting more detailed consumer sentiment data from Ann Arbor.
Potential Market Movers
So much for a sleepy summer Friday in July. As Q2 earnings announcements accelerate, investors will have plenty of economic developments and consumer data to consider before—and possibly over—the weekend.
As the market hopes to snap a multi-day losing streak, June retail sales rose 1% on a monthly basis and ahead of estimates, indicating consumers are still spending despite 40-year-high inflation. We’ll get a broader picture of what consumers are thinking later this morning with the release of preliminary University of Michigan consumer sentiment numbers for July.
Overnight, China reported its weakest growth rate since its initial COVID-19 Wuhan lockdowns in 2020 with the nation’s second-quarter GDP expanding at a 0.4% rate, reflecting the impact of its zero-COVID policies amid continuing lockdowns. In a poll of economists, The Wall Street Journal estimated China grew at a 0.9% rate these past three months.
Before the open, the Dow Jones futures gained 1.09% on the early economic reports, S&P 500 futures rose 1.02%, and Nasdaq futures gained 0.92%.
The Cboe Market Volatility Index (VIX) fell more than 3% before the open to 25.
After a week of downward pressure from signs of a slowing global economy, WTI crude oil futures bounced up 2.19% early Friday to $97.84 per barrel. President Biden’s trip to the Middle East this week has so far failed to deliver news on the direction of energy prices.
The 10-year Treasury yield stood at 2.948% before the open, down slightly.
Among earnings releases before the opening bell:
- Citigroup C offered slightly better news on the big-bank earnings front with above-estimate profits and revenue due in part to better business in its credit card operation. Citi reported Q2 earnings per share EPS of $2.19 (estimate $1.68) on revenues of $19.64 billion (estimate $18.22 billion). Shares of C were up nearly 5% premarket. On Thursday, JPMorgan Chase JPM and Morgan Stanley MS reported misses on earnings and revenues, with JPM suspending its stock buyback program to boost loan loss reserves to navigate a potential recession. Bank of America BAC and Goldman Sachs GS will report next week.
- Wells Fargo WFC reported a 48% Q2 profit decline as the bank set aside reserves for bad loans and suffered investment losses. WFC reported $0.82 EPS (estimate $0.80) on revenue of $17.03 billion (estimate $17.53 billion). Shares were off 0.72% premarket.
- UnitedHealth Group UNH gained 2.70% premarket after reporting second-quarter earnings ahead of expectations and raising its full-year outlook. The health care giant reported earnings per share (EPS) of $5.57 (estimate: $5.21) and revenue of $80.3 billion (estimate: $79.7 billion).
Reviewing the Market Minutes
The stock market continued its sell-off yesterday after JPMorgan Chase JPM and Morgan Stanley MS started off earnings season on a sour note by missing on earnings and revenue estimates. JPM announced it would halt its stock buyback program in order to keep more money on hand in case of loan losses. MS was hurt by fewer capital deals for mergers and underwriting. The stocks fell 3.49% and 0.39% respectively.
The miss by the big banks took the PHLX KBW Bank Index (BKX) down 2.01%, testing its recent lows. Likewise, the Financials Select Sector Index dropped 1.91%, back to its June lows.
Despite the weakness in financials, energy was actually the worst-performing sector because WTI crude oil futures sold off right after the open, breaking support and trading as low as $90.56 per barrel. However, bulls were able to drive the commodity back above support to settle at $95.78.
Technology was the top sector, and the only one to finish the day in the green. Semiconductors led tech higher as the PHLX Semiconductor Index (SOX) jumped 1.92% in reaction to a better-than-expected earnings report from Taiwan Semiconductor (TSM) that prompted the stock to rally 2.93%.
The tech-heavy Nasdaq ($COMP) cut its early session losses to close 0.03% higher on the day. While the S&P 500® index (SPX) and the Dow Jones Industrials ($DJI) were also able to recover much of their early losses, they respectively closed 0.30% and 0.46% lower.
Business service company Cintas (CTAS) was able to overcome early market negativity to close 0.64% higher yesterday after reporting better-than-expected earnings and revenue. The company provided forward fiscal year revenue guidance above analysts’ estimates, but its forward guidance for earnings was in-line with the analysts.
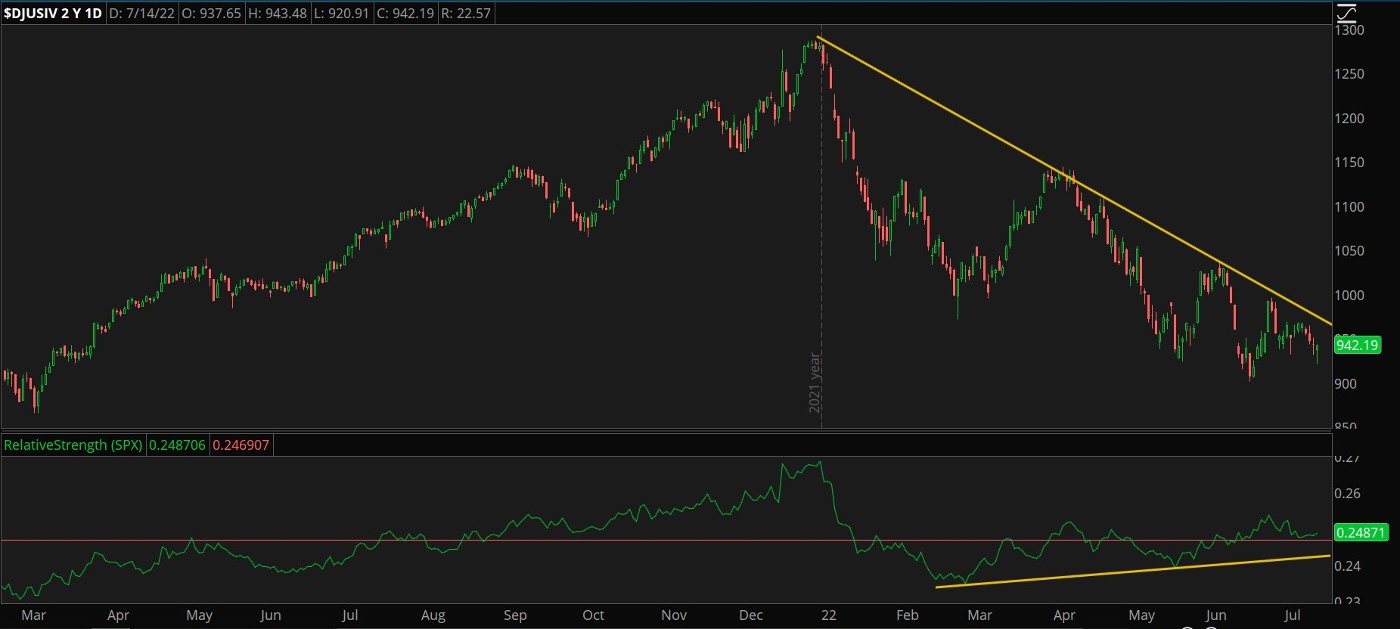
CHART OF THE DAY: THE BIG MO. The Dow Jones U.S. Business Support Service Index ($DJUSIV—candlesticks) has been downtrending since the first of the year but has recently exhibited relative strength (green) against the S&P 500, resulting in a bullish divergence that may signal a change in the trend. Chart source: The thinkorswim® platform. For illustrative purposes only. Past performance does not guarantee future results.
Three Things to Watch
Divergence Emergence: A benefit with oscillators—technical analysis tools that help track price ebbs and flows—is that they measure momentum, and momentum tends to lead price. It’s similar to throwing a ball in the air. You know when the ball is going to change direction by watching its momentum slow. Divergences show a change in the momentum, which often precede a change in the direction of the price.
However, countertrend trading is often referred to as “catching a falling knife,” so it’s important to be cautious.
Conjunction Function: When analyzing a divergence, it helps to have other filtering tools. For example, a chartist might use divergences in conjunction with a price pattern or moving average. Other investors might use them with their fundamental reading of a company’s earnings or their calculation of intrinsic value.
Investors that track sector rotation know that during a bear market, consumer staples, utilities, and health care often outperform the market. In the last six months, these sectors have been among the strongest in the market. At the tail end of a bear market, the services sector often moves to the top of the pack. Using this knowledge with the divergence on the Dow Jones U.S. Business Support Service Index in the graph above, investors may have increased confidence in how they’re interpreting the chart.
Of course, when dealing with “falling knives,” it’s not uncommon to have more than two pieces of data to work with.
Dousing Housing: Some of the numbers on the mortgage markets appear contradictory. CoreLogic’s April 2022 Loan Performance Insights Report found that mortgage delinquencies were down 13 months in a row and only 2.9% of all U.S. mortgages were at least 30 days overdue, lower than April 2021 at 4.7%. However, National Mortgage News is reporting that foreclosure starts are near the same level they were before a federal moratorium was put into place during the COVID-19 pandemic.
It may be that both groups are reading the same numbers with a different bias or that they’re measuring the data differently. With mixed information, real estate investors may want to keep paying attention to how much money the banks are setting aside for potential loan losses. This could be a better indicator of where the mortgage markets are going.
Notable Calendar Items
July 18: Earnings from Bank of America BAC, IBM IBM, and Goldman Sachs GS
July 19: Building permits, Housing starts, and earnings from Johnson & Johnson JNJ, Lockheed Martin LMT, Netflix NFLX, Haliburton HAL, JB Hunt JBHT, and Hasbro HAS
July 20: Existing home sales and earnings from Tesla TSLA, Abbott Labs ABT, Kinder Morgan KMI, Biogen BIIB, and Baker Hughes BKR
July 21: Philadelphia Fed Manufacturing Index and earnings from AT&T T, Philip Morris PM, Union Pacific UNP, Intuitive Surgical ISRG, and Freeport-McMoRan FCX
July 22: Earnings from Verizon VZ, American Express AXP, Schlumberger SLB, and Twitter TWTR
Image sourced from Shutterstock
TD Ameritrade® commentary for educational purposes only. Member SIPC.
This post contains sponsored advertising content. This content is for informational purposes only and not intended to be investing advice.
© 2024 Benzinga.com. Benzinga does not provide investment advice. All rights reserved.
Date | ticker | name | Actual EPS | EPS Surprise | Actual Rev | Rev Surprise |
|---|
Trade confidently with insights and alerts from analyst ratings, free reports and breaking news that affects the stocks you care about.

