
Investors and traders return to the market in a shortened equities trading session today that doesn’t feature any major economic data reports. So the last trading session of the month could shape up to be a quiet one.
This morning, it’s looking like stocks could open lower amid concerns about relations between the United States and China. With a new round of U.S. duties on Chinese goods scheduled to go into effect in mid-December, worries have ratcheted up after President Trump signed legislation supporting the Hong Kong protesters, angering Beijing.
Despite the lowered optimism, sentiment doesn’t appear to be severely damaged. A Wall Street Journal report said both sides were confident they can still get a partial deal done soon as Beijing and Washington have been trying to keep political issues separate from trade talks.
The pullback in optimism could offer some cover for traders and investors who might want to book some profits after stocks have hit a string of record highs. Some week- and month-end profit-taking could serve to help consolidate recent gains.
Trading volume could be thin again, potentially exacerbating moves in either direction, and what happens during the first half of trading could set the pace for the rest of the day. Slow trading like today’s session is expected to feature can leave the market vulnerable to outsized moves based on headlines.
Meanwhile, shoppers are expected to hit the stores on what is traditionally an important day for retailer sales. But the influence of Black Friday has been waning as online purchases and discounts disrupt traditional brick-and-mortar shopping.
Still, the U.S. consumer has been a strong support of the domestic economy and a bright spot amid global economic concerns, and today likely won’t prove insubstantial in boosting retailers’ bottom lines.
On Wednesday, as many traders and investors were likely eyeing the exits on the day before Thanksgiving and volumes were light, the three main U.S. indices notched another round of record closes.
The day started out with follow-through optimism after Trump said the world’s two largest economies were getting close to a deal and the Chinese Commerce Ministry said negotiators from both sides had agreed to discussions about a partial trade deal.
Momentum built throughout the day as a series of economic reports provided more evidence that the U.S. economy continues to be a bright spot amid a global economy that has been facing headwinds as the trade war between the U.S. and China lingers.
A Check Of The Numbers
Though Wednesday was a quiet day in terms of market action, is was a busy day in terms of economic releases. If you were among the throngs who checked out early, here’s a brief rundown.
GDP. The U.S. government’s second crack at a gross domestic product (GDP) estimate showed that the domestic economy expanded more than previously thought in the third quarter. Wednesday’s GDP report showed 2.1% annualized growth, a better print than the Briefing.com consensus expectation for the second estimate to be unchanged at 1.9%.
Of course, GDP is a backward-looking indicator, and the stock market is perpetually looking ahead. But a GDP growth figure with a 2-handle on it is a substantially better showing than the European and Japanese economies.
DURABLE GOODS. Meanwhile, durable goods orders in October also made a strong showing, bouncing back from the previous month’s decline. These orders rose 0.6%, handily beating a Briefing.com consensus estimate for a decline of 0.7%.
The gain was an encouraging sign for the nation’s factory activity, providing a counterpoint to recent Institute for Supply Management numbers that have shown the U.S. manufacturing sector contracting for three consecutive months through October.
PCE. The Fed’s preferred measure of inflation, the core PCE price index, showed an increase of 0.1% in October, in line with a Briefing.com consensus estimate. That put yearly inflation from the core reading at 1.6%, which was down from the prior month’s 1.7% growth and well below the Fed’s target inflation goal of 2%.
The new figure doesn’t ring alarm bells about the central bank potentially raising rates at its meeting next month, and the futures market still shows a high probability that monetary policy makers will hold rates steady.
But low inflation is worth monitoring as it can indicate economic weakness. The latest numbers seem to be an indicator that the domestic economy is doing relatively well but not going gangbusters.
BEIGE BOOK. To underscore that point, the Fed’s Beige Book, which summarizes anecdotes from business contacts around the nation, was slightly more upbeat about the economy from October through mid-November than it was in its previous assessment. The central bank said the economy was growing “modestly” during the period, compared with its prior statement of “slight to modest” expansion.
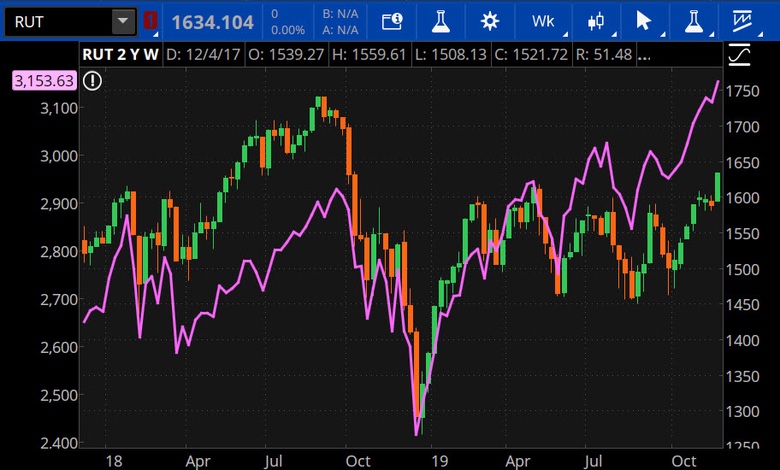
CHART OF THE DAY: RUTTING SEASON.The Russell 2000 (RUT - candlestick) has rallied this week, leading some market watchers to think that’s a healthy indicator for the broader market upswing we’ve been seeing. Still, the RUT hasn’t surpassed a previous all-time high recently like other U.S. equity benchmarks such as the S&P 500 (SPX - purple line). RUT was hit particularly hard during the equity meltdown in late 2018, and the small-cap index has been slower to recover than other major indices (see more below). Data source: FTSE Russell Indexes, S&P Dow Jones Indices. Chart source: The thinkorswim® platform from TD Ameritrade. For illustrative purposes only. Past performance does not guarantee future results.
Small-Cap Recap: Small-cap U.S. stocks are often thought to be relatively insulated from international trade issues because they tend to be focused domestically and have less exposure to international markets than larger multinational companies. While that can be a benefit for investors looking for shelter from trade-related gyrations, it may also partly explain why the Russell 2000 (RUT) hasn’t hit an all-time high like the three main U.S. indices have recently.
With large international exposure, those indices have been hitting a string of records in large part because of optimism over a potential partial trade deal being signed soon. Since the RUT is somewhat shielded from trade-related risk, it’s also removed from some of the reward when investors are optimistic about a deal.
Playing Catch Up: As of Wednesday afternoon, the Dow Jones Industrial Average ($DJI) was up roughly 14% over the last 12 months, the S&P 500 Index (SPX) was up more than 17% and the Nasdaq Composite (COMP) was up nearly 23%. The RUT was up less than 10% over that time period. The RUT hit a string of 52-week highs earlier this week. But as the chart above shows, small caps really took it on the chin—relative to the broader market—when the market tanked in late 2018. Though the market recouped those losses in short order, RUT has sort of chopped around in 2019 while SPX, $DJI and COMP soared to new all-time highs.
Cause for Optimism: Some market watchers think the rally in the RUT is an indicator of health in the broader market gains we’ve been seeing recently. “We’ve already seen large caps and various countries around the world break out, and now we have participation from a once-lagging group,” LPL Financial’s senior market strategist Ryan Detrick said in a blog post this week.
“Participation is the key to any lasting bull market, and this is another great sign as we head into 2020.” And Sam Stovall, chief investment strategist with CFRA, said in a note that the RUT’s break above year-long resistance puts it “in synch with clearly defined uptrends” in the SPX and Nasdaq 100 Index (NDX). That “adds credence” to the string of records the S&P 500 and Nasdaq-100 have posted since late last month, he said.
Information from TDA is not intended to be investment advice or construed as a recommendation or endorsement of any particular investment or investment strategy, and is for illustrative purposes only. Be sure to understand all risks involved with each strategy, including commission costs, before attempting to place any trade.
Image by David Mark from Pixabay
© 2024 Benzinga.com. Benzinga does not provide investment advice. All rights reserved.
Comments
Trade confidently with insights and alerts from analyst ratings, free reports and breaking news that affects the stocks you care about.

