


The Q3 reporting season is just about ready to ramp up, and after the negative surprises that rocked the mega-cap tech sector and the revenue beats recorded by the much maligned retail sector, traders should be ready to anticipate potential earnings wins and upsets at a glance.
That’s where heat maps come in handy. Using a stock heat map, traders can get a quick visualization of which stocks offer the most promising outlook across a variety of criteria.
In anticipation of the upcoming reporting period, let’s take a look at a few metrics trades should be most aware of using the Finscreener platform’s interactive heat map.
Estimate Revisions
The most straightforward way of gauging whether a company is situated for quarterly revenue growth is by surveying their EPS estimates and checking how it has been revised.
Using the Finscreener heat map, we can take a look at where in the S&P 500 there is the most (and least) optimism among companies steeling themselves for quarterly investor scrutiny.
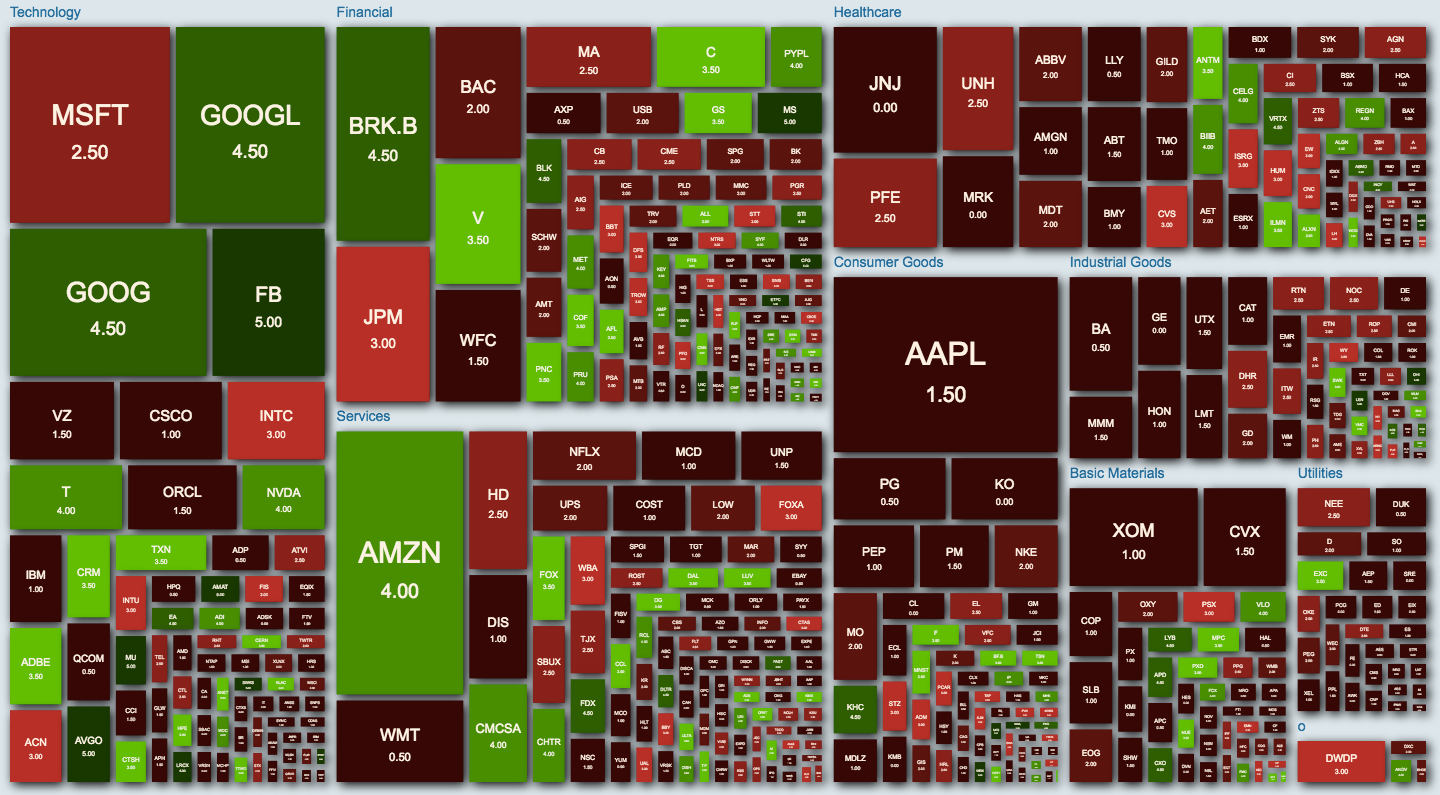
To do this, we simply pull up the heat map page and filter the visualization by EPS estimate revisions for the current quarter. We’ll also break up out results by sector and limit them to S&P companies, though we could also browse through other broad indexes like the Nasdaq 100 companies or sift the entire market segmented by analyst ratings, market cap or Finscreener's own ranking metrics.
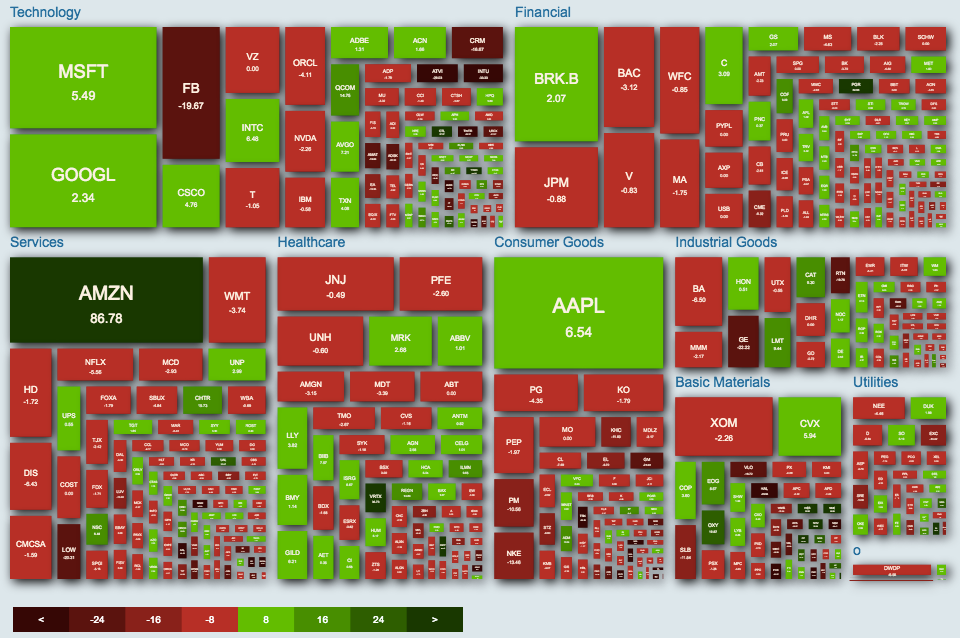
Taking a look at the read-out, we can see a lot of red showing through the splotches of green. Already, this shows some diminished expectations among many companies for delivering on their bottom line. This appears particularly true in the consumer goods sector.
Let’s narrow down the results to just those companies that raised their estimates between 8 and 16 percent.
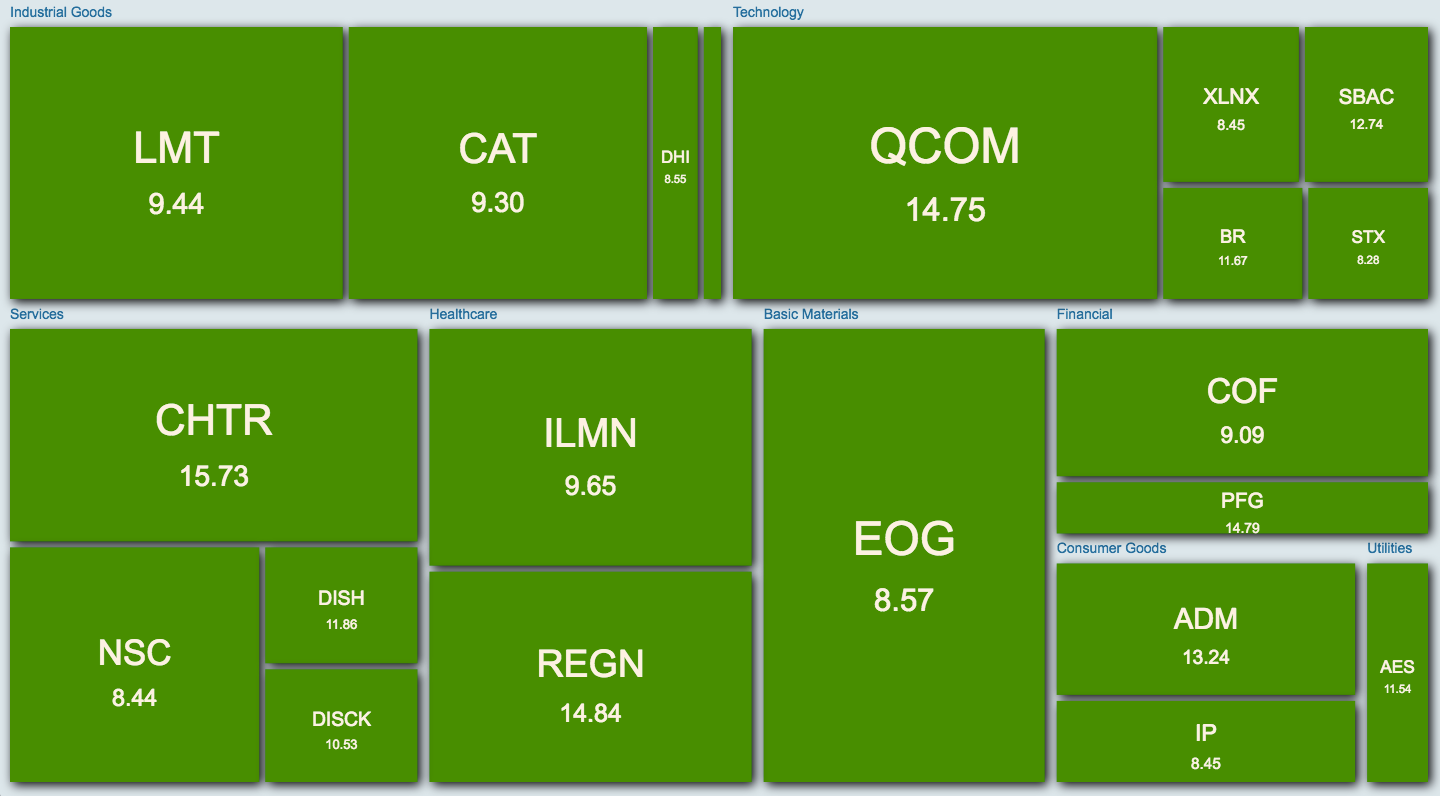
The Industrial and Tech/telecom sectors come to the fore in this map, with strong Q3 stocks like Lockheed Martin Corporation LMT, Caterpillar Inc CAT and Qualcomm, Inc. QCOM
Surprise
Of course, estimates are only as good as the track record of the company making them. If a stock has a history of surprising on either the up- or downside, traders would do well to keep their eyes on the former while remaining wary of the latter.
We can filter the FInscreener map to reveal where in the market the biggest upside was last quarter by selecting the earnings surprise from last quarter metric.
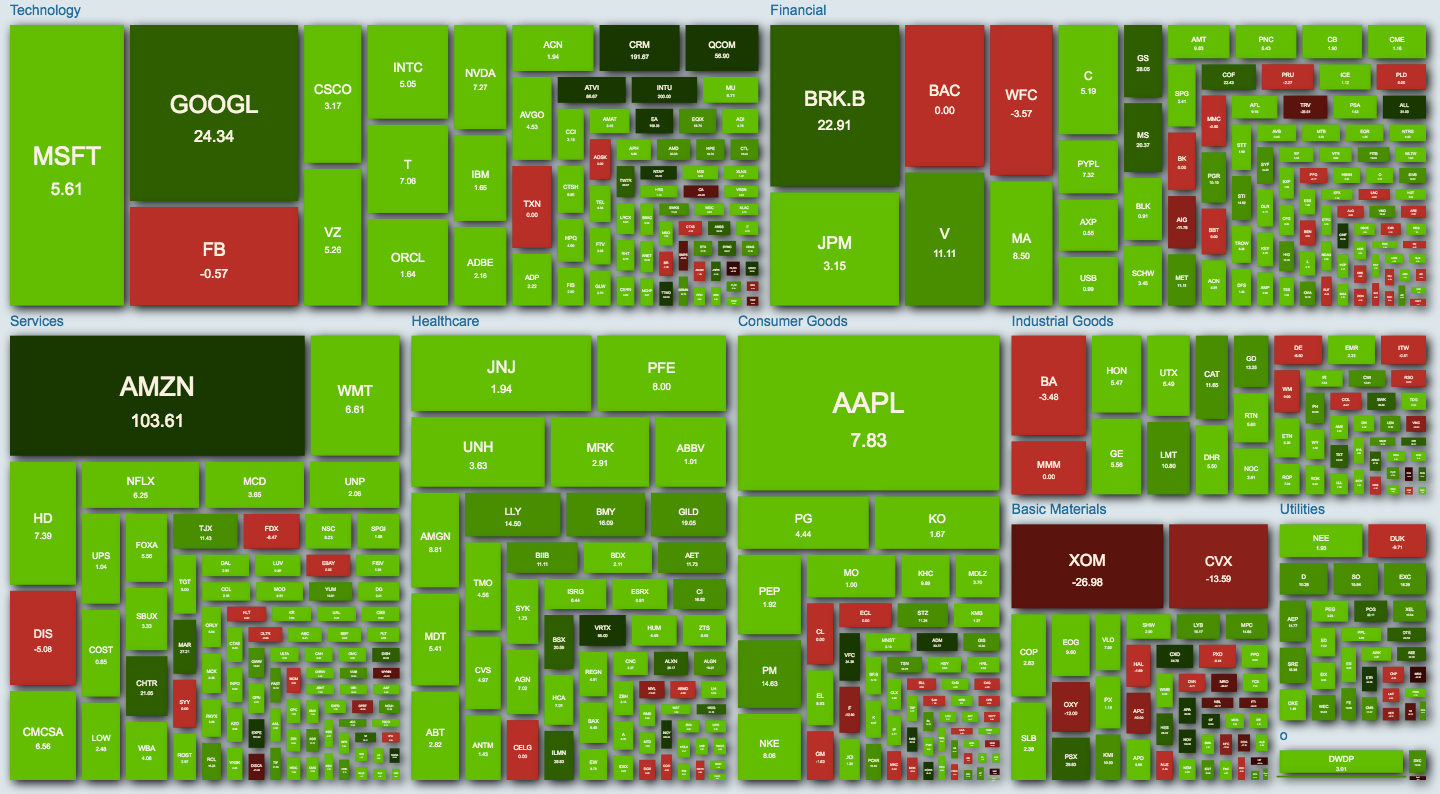
Traders with a good memory should recall that the Q2 reporting season was an extremely positive one, and this map certainly backs that up. While technology and consumer services garnered a lot of attention at the time, let’s focus in on healthcare, which stocks have had a stellar third quarter.
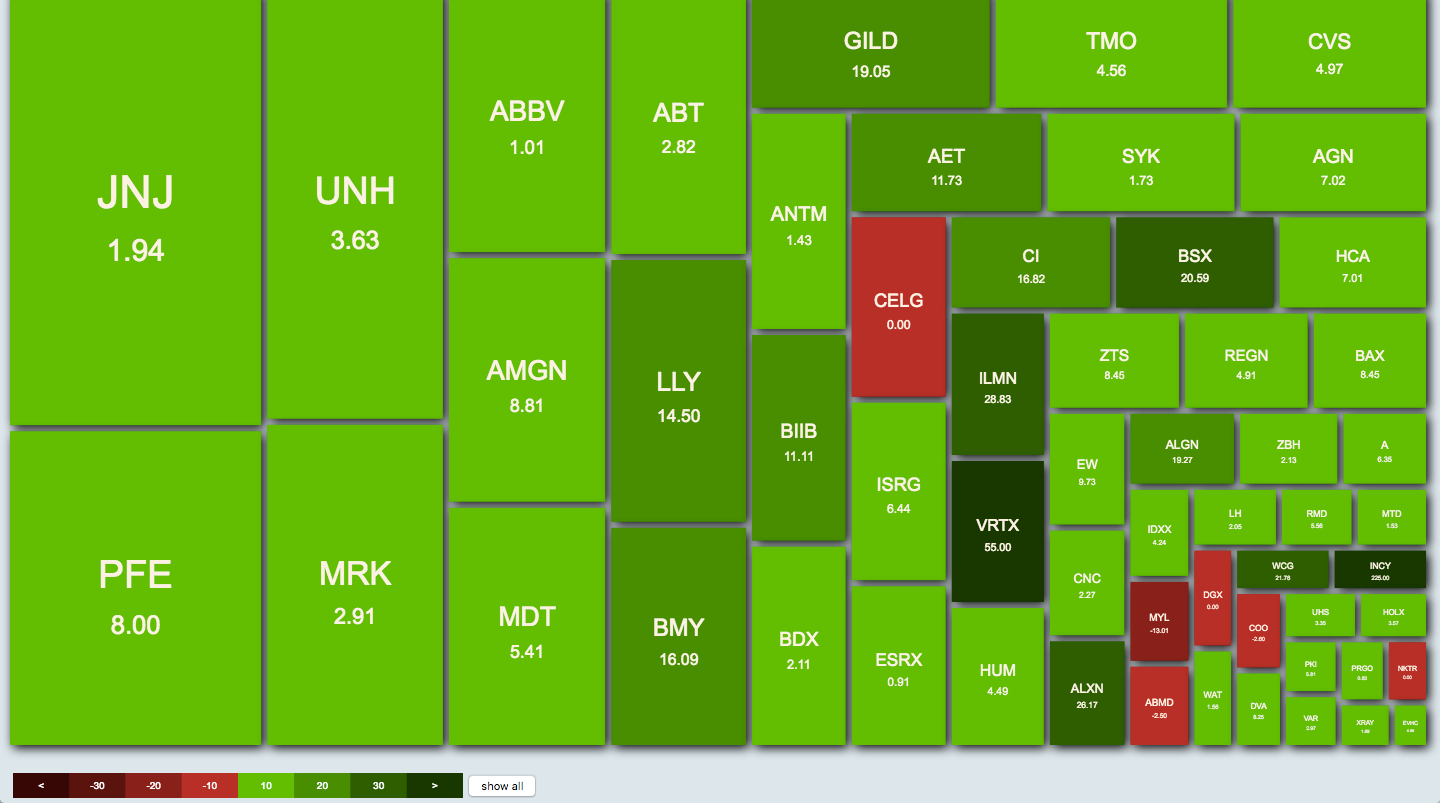
With this closer look, we can see that large cap healthcare stocks with market caps between $45 and $50 billion like Vertex Pharmaceuticals Incorporated VRTX Illumina, Inc. ILMN Boston Scientific Corporation BSX had the best performance against estimates.
Hovering over Vertex, we can see some basic stats on the stock. Of note is the large uptick in average volume between the average trading volume and that of the last three months
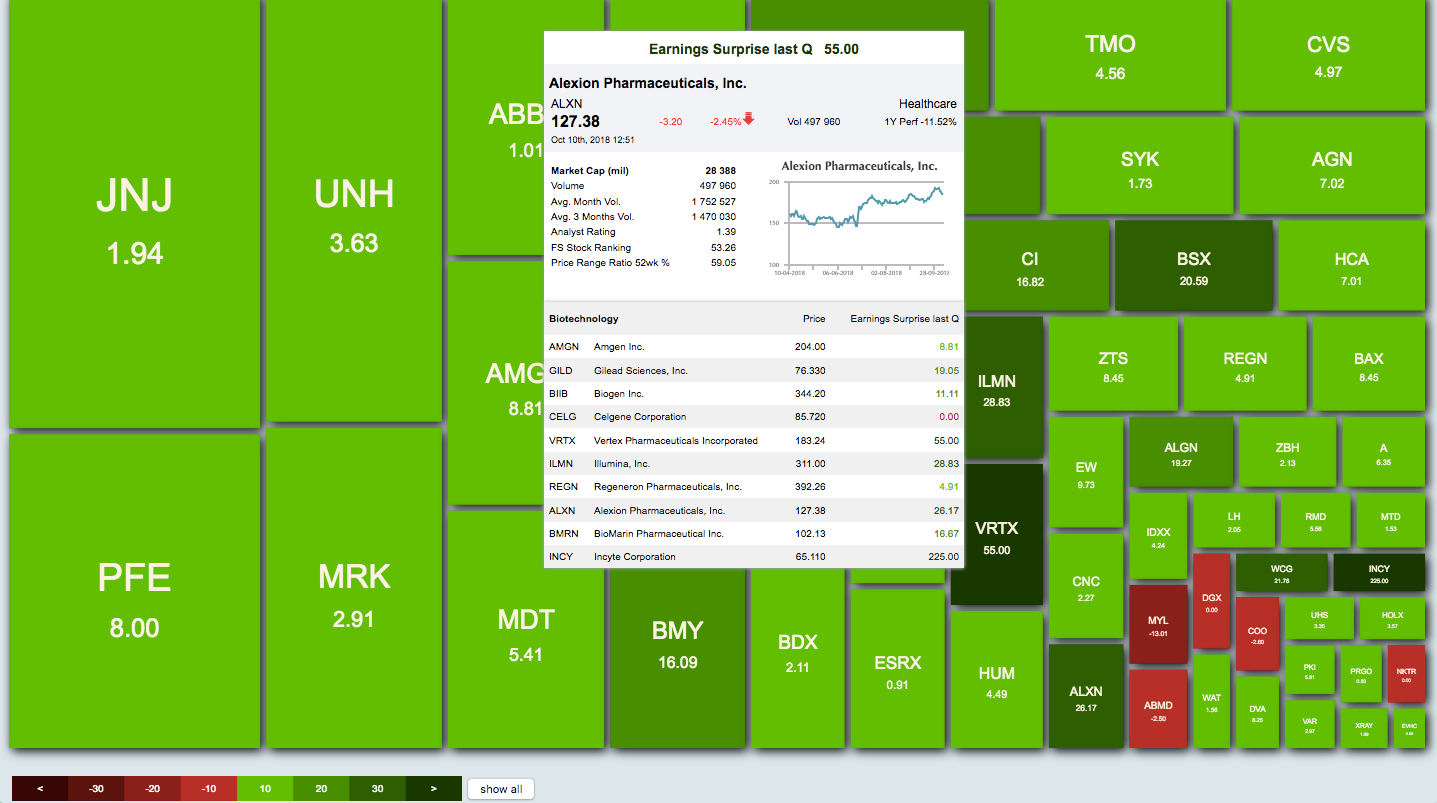
This could mute some of market reaction if the company surprises to the upside again. It might also cause stronger selling pressure if the company’s per share earnings disappoint.
Proprietary Rankings
Finally, some platforms that offer a heat map also allow users to view the market through the lens of their own data and metrics. let’s take a look at how Finscreener’s broad, five-star ranking system rearranges the S&P’s geography.
At the moment, technology companies still hold the most overall performance potential according to Finscreener's ranking. More interesting is how low most of the +$100 billion market cap companies are on the low end of the five-point scale. This is particularly apparent in industrial and utility stocks, sectors that have seen heightened market interest near the tail end of Q3.
Traders looking for more specific insight can also select Finscreener-derived metrics weighted toward growth, value or income.
What’s interesting about this final map is that Finscreener’s ranking posit that, despite recent dips in performance stocks toward defensive picks, the general economic environment might bolster some of those high-flyers back to new highs. Whether this is the case, or if value stocks finally comes back into fashion, October and November reports promise to intrigue.
© 2024 Benzinga.com. Benzinga does not provide investment advice. All rights reserved.
Date | ticker | name | Actual EPS | EPS Surprise | Actual Rev | Rev Surprise |
|---|
Trade confidently with insights and alerts from analyst ratings, free reports and breaking news that affects the stocks you care about.

