


Loading...
Loading...
- The daily RSI shows bullish trend reversal.
- Still too early to call a bottom as the key descending trendline hurdle is intact.
- Further, USD/JPY is at the mercy of the US stocks.
The 300-point rally in the Dow lifted the USD/JPY pair above the 100-hour moving average (MA), confirming a bullish price-relative strength index (RSI) divergence.
Daily chart
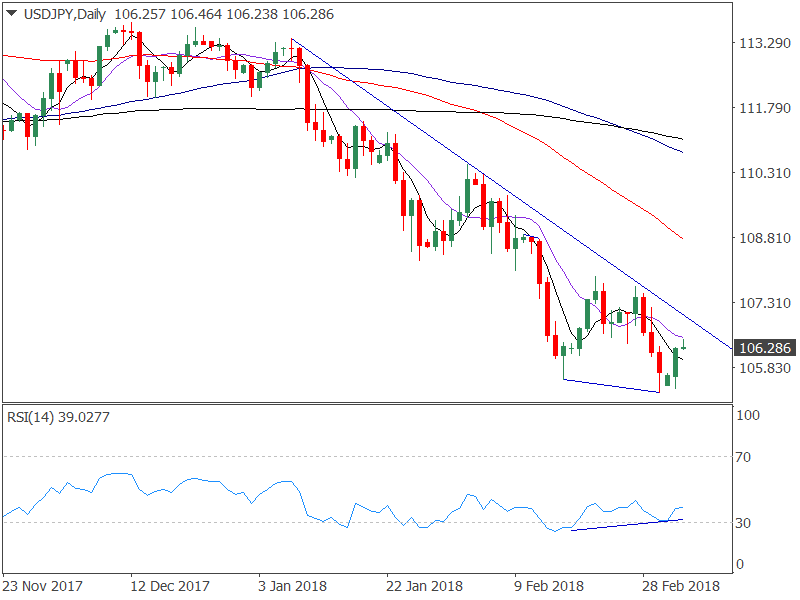
The above chart shows-
- Bullish price-RSI divergence marked by lower lows on price and higher lows on the RSI. It indicates a short-term bullish trend reversal.
- The descending trendline (drawn from Jan. 8 high and Feb. 2 high) resistance is intact.
- 5-day MA and 10-day MA trend south, indicating bearish setup.
- Bearish crossover between 100-MA and 200-MA.
View
-
The chart continues to favor the bears, except for the bullish price RSI divergence. So it is too early to call a bottom. That said, a close above the descending trendline resistance would add credence to the positive RSI divergence and open doors for 107.91.
Only a convincing move above 107.91 would mean the sell-off from the January high of 113.39 has ended and the tables have turned in favor of the bulls. - On the downside, a close below 105.25 (Friday's low) would shift attention to 103.74 (May 2013 high).
Also, the recovery in the USD/JPY will likely be short-lived if the US stocks report losses today. As of writing, the S&P 500 futures are flatlined and with trade war talks in the air, the equities could turn red anytime, hence USD bulls (JPY bears) need to be cautious.
Loading...
Loading...
© 2024 Benzinga.com. Benzinga does not provide investment advice. All rights reserved.
Benzinga simplifies the market for smarter investing
Trade confidently with insights and alerts from analyst ratings, free reports and breaking news that affects the stocks you care about.
Join Now: Free!
Already a member?Sign in

