


With a three-day weekend ahead, investors have a fast-flowing stream of earnings and a major data load to digest early Friday. Stocks head into the last day of the week sitting pretty after a five-day rally and more than halfway recovered from the recent sell-off.
U.S. markets are closed Monday for President’s Day, and they’re not alone in taking a well-deserved rest. Stock markets in Hong Kong and China will be closed until Thursday for the Lunar New Year. In overseas action early Friday, European and Asian stock indices posted across-the-board gains. European stocks are on pace to rise 3% this week. Over in Japan, the yen hit a 15-month high vs. the dollar as foreign currencies continued to outpace the greenback. This could be one factor playing into oil’s sudden resurgence.
Earnings season keeps charging along with positive news, and Friday was no exception. Shares of The Coca-Cola Co KO and Deere & Company DE moved higher in pre-market trading after both companies beat Wall Street analysts’ expectations.
DE reported a 23% increase in revenue and raised its 2018 outlook. The company now projects about a 29% increase in equipment sales, up from the previous 22%. In a press release, DE cited improved conditions in key markets. If you compare DE and Cisco Systems, Inc. CSCO, which also reported this week, it shows the market is not only healthy in the U.S., but also that we’re seeing a world recovery. These two companies are heavily dependent on foreign sales and they both had good things to say about demand abroad.
KO surpassed analysts’ projections on revenue and earnings per share, and shares rose 2% in pre-market trading. What’s interesting here is that the company’s best-performing drinks were sports drinks and water, not its iconic beverage. But don’t forget, revenue from water and that iconic drink were almost exactly equal going into earnings, according to the company profile on thinkorswim® platform from TD Ameritrade. KO shares climbed in pre-market trading, but it’s worth noting that KO reported net sales for 2017 fell 15% from the previous year.
Data today include University of Michigan preliminary sentiment, January housing starts, and January building permits. Higher interest rates are making mortgages more expensive for prospective home buyers, so housing sits right in the spotlight when it comes to measuring the possible economic impact of rising borrowing costs. Housing starts and building permits both came in well above analysts’ expectations, which could feed into perceptions that the economy continued to boom in January.
While we’re on the subject of interest rates, benchmark 10-year Treasury yields moved a bit lower early Friday, dipping below 2.88%. That’s down several basis points from the week’s high. Today’s data could have an impact on where that yield number moves in the coming hours.
The stock market recovery took another step Thursday, as major indices climbed across the board. For the second day in a row, the tech-heavy Nasdaq led the way, gaining more than 1.5%. Info tech shares rose nearly 2%, finishing second behind utilities on the sector scorecard. Industrials, consumer staples, and telecom also performed well, as investors seemed to pile into both growth and “defensive” names. The only sector missing the fun was energy, which fell slightly and is by far the worst-performing area of the market over the last month.
Thursday marked the first five-day winning streak of the year for the market, lifting the Dow Jones Industrial Average ($DJI) back above 25,000 and the S&P 500 (SPX) back above 2,700. The SPX finished the day down about 5% from the all-time high it set on Jan. 26. Remember, though, that last Friday it was down more than 11% from the high at one point in the session. So the market is more than halfway back from its lows.
Volatility calmed Thursday, but VIX didn’t really sink that much overall. It’s back below 20, a level sometimes seen as the market of high vs. average volatility. What’s interesting is on a day when volatility might sometimes have gotten nailed as stocks roared higher, VIX barely moved. It’s hanging in there pretty well and bears watching. Looking out at VIX futures for the coming months, the market is pricing in lower volatility than we have now. Still, it doesn’t look like many people expect a return anytime soon to the kind of peace and quiet seen in most of 2017.
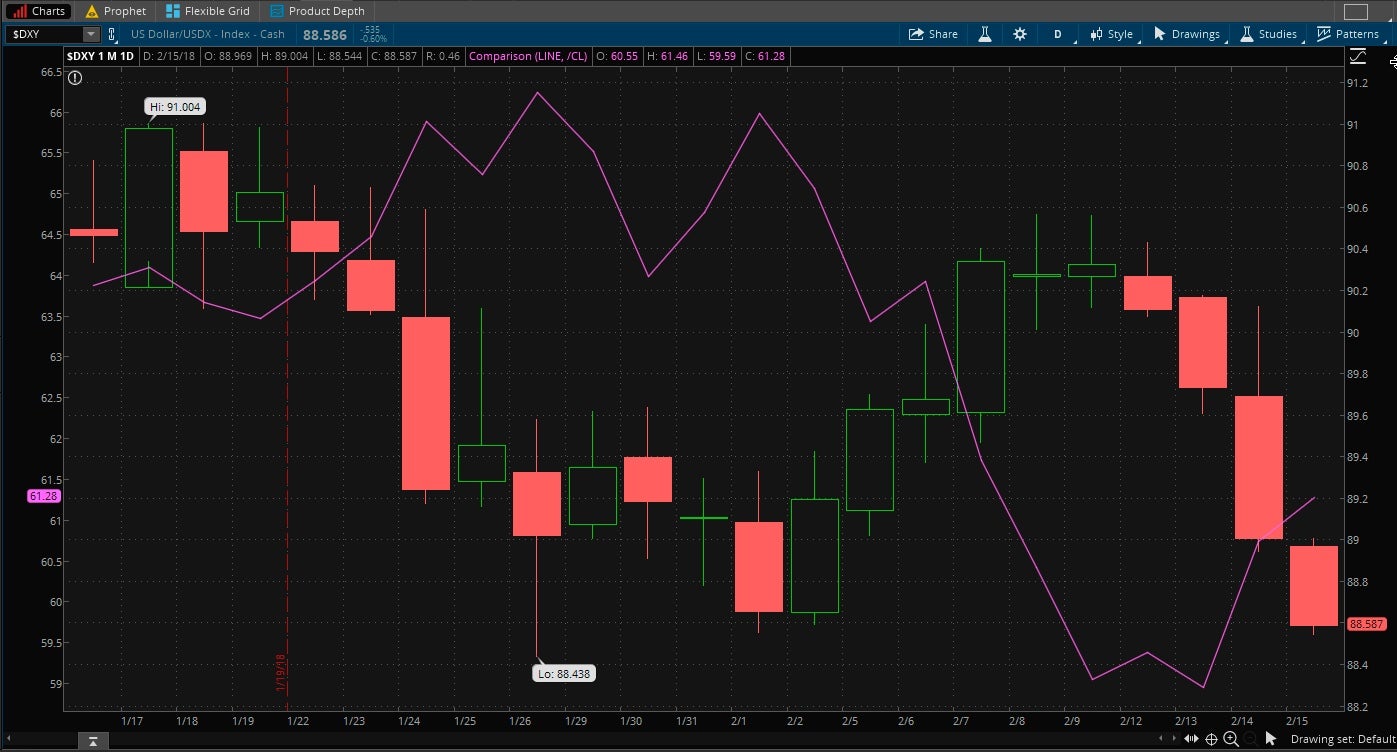
Crude oil recovered a bit from the recent losses, but remains well below its January highs. Meanwhile, the dollar index really took a dive this week, falling back below 89 (see chart). The yen, euro, and pound have all been strong compared with the dollar lately, perhaps a sign of investor faith in overseas economic strength. Some analysts think weaker than expected retail sales data for January might have played a role in the dollar’s downturn, as it raised questions about how the economy is performing. Today’s housing and sentiment data might also play into the dollar’s performance.
Preliminary University of Michigan sentiment for February is due this morning, representing the first glance at consumers’ reaction to plummeting stock markets that dominated the headlines earlier this month. Keep an eye on those numbers and the report’s analysis, especially considering the weak retail sales data for December and January. Anything in the sentiment report that sounds like it might be reinforcing the weak retail sales could potentially give investors pause. Consumer spending makes up a huge part of the economy, so sentiment does mean something even if these reports are sometimes looked at as “soft,” not “hard” numbers.
Checking the technical picture, the SPX cruised above its 50-day moving average Thursday near 2,722. It was the first time it surpassed that key technical level since the sell-off, Briefing.com noted. This push above resistance after an earlier test failed might have triggered some short covering, leading to fresh gains.
FIGURE 1: DOLLAR DERAILED. The dollar (candlestick on chart) descended to nearly three-week lows Thursday as it continued to lose ground. It’s now back at levels last seen on Jan. 26, which happened to be the last day the stock market set new highs. Meanwhile, crude oil (purple line), found some strength Thursday, perhaps in part due to the sinking dollar. Data source: CME Group. Chart source: The thinkorswim® platform from TD Ameritrade. For illustrative purposes only. Past performance does not guarantee future results.
Long Weekend Raises Caution Flag
A three-day weekend lies ahead, and that could potentially lend an air of caution today. Volatility sometimes gets elevated at times like these, and trading might be a little thinner than normal. Options contracts also expire today, another factor that could create more volatility than usual. Investors might want to be wary getting in and out of trades today, especially after the wild two weeks that just passed. The closing hour could be interesting as there potentially might be some position squaring ahead of the long weekend.
PPI Getting No Respect?
The producer price index (PPI) could be feeling like a certain late famous comedian whose most popular line was that he never got respect. That’s because after all the market fuss over the consumer price index (CPI) on Wednesday, Thursday’s PPI data for January hit the market and barely got noticed, at least judging by how stocks and bonds moved. For the month, PPI rose 0.4%, in line with the average Wall Street analyst estimate. However, core PPI — which strips out food and energy — rose more than expected at 0.4% (analysts had expected 0.2%). And year-over-year, the 2.7% rise is well above the CPI over that same time period. One question now is will producers eat their own higher costs or pass them along, which could ultimately start to affect consumer prices. One data point doesn’t make a trend, but that year-over-year figure is worth thinking about.
Ready for Spring Yet?
Natural gas apparently is. Prices have fallen sharply over the last few weeks from around $3.50 per million British thermal units (MMBtu) in late January to under $2.60 on Thursday. The weakness came despite a bigger than expected drop in weekly U.S. supplies. Natural gas is often a “weather market,” meaning it trades depending on whether demand might rise as temperatures fall. At this point, temperatures have grown milder across much of the U.S. after a frosty late January and early February.
Except for that big surge in late January, the natural gas market has been pretty tame over the last nine months or so, mostly staying historically low below $3.25. This can often be rough on companies in the energy sector that make a living extracting and selling the commodity, but it could be one of the underlying factors keeping the economy humming along by lowering input costs for everyone else. Natural gas is used by all kinds of companies, going into products like plastics, chemicals, fertilizers and paper.
Information from TDA is not intended to be investment advice or construed as a recommendation or endorsement of any particular investment or investment strategy, and is for illustrative purposes only. Be sure to understand all risks involved with each strategy, including commission costs, before attempting to place any trade.
© 2024 Benzinga.com. Benzinga does not provide investment advice. All rights reserved.
Trade confidently with insights and alerts from analyst ratings, free reports and breaking news that affects the stocks you care about.

