


Daily Chart

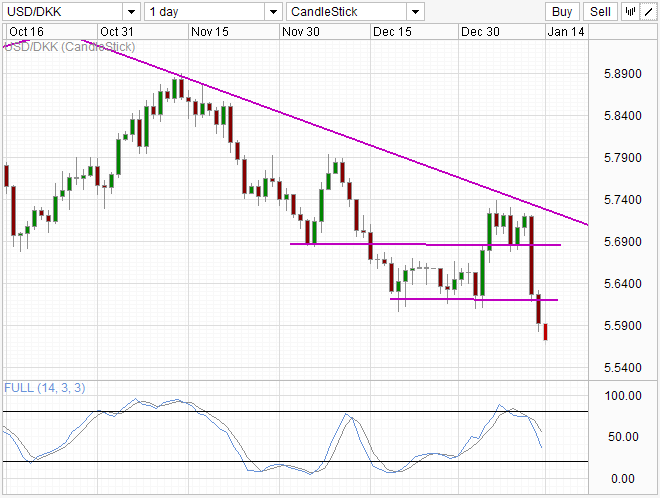
Bearish breakout underway with price bouncing lower from the downwards trendline, breaking through 2 consolidation area in the process. Stochastic also agrees with readings breaking below 80.0 after hitting the “Overbought' region.
Weekly Chart
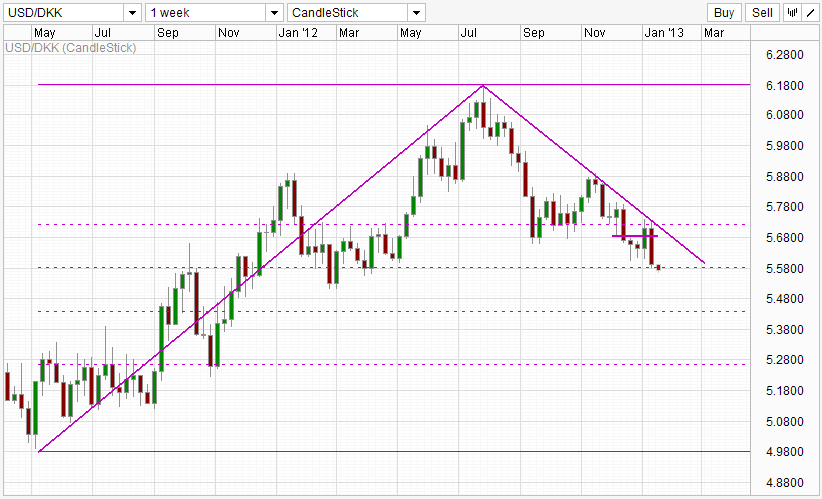
Weekly chart shows price dropping below the 50% Fib retracement, opening up 61.8% as the next significant support. Previous swing-low around 5.51 (Feb '12) and Doji candle back in Oct '11 could still provide some interim support against downside movements.
Hourly Chart
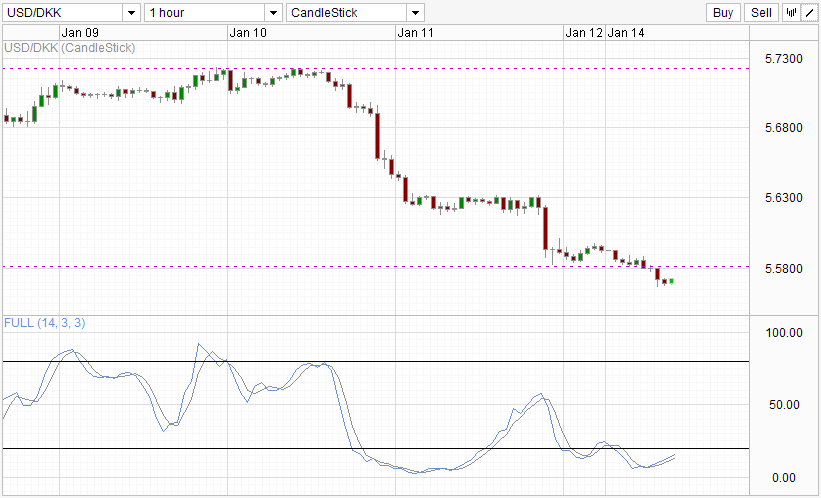
Short-term Stochastic suggest a potential pullback should readings hit back above 20.0. However, overall tone will remain bearish especially if readings swing back to Overbought while price fail to move back above the 50.0% Fib.
This article is for general information purposes only. It is not investment advice or a solution to buy or sell securities. Opinions are the authors; not necessarily that of OANDA Corporation or any of its affiliates, subsidiaries, officers or directors. Leveraged trading is high risk and not suitable for all. You could lose all of your deposited funds.

© 2024 Benzinga.com. Benzinga does not provide investment advice. All rights reserved.
Trade confidently with insights and alerts from analyst ratings, free reports and breaking news that affects the stocks you care about.

