Predicting Market Underperformance
As of Tuesday's close, the quantitative forensic accounting analysis firm GovernanceMetrics International (GMI) had given 29 mid cap stocks the worst of the five possible ratings on GMI's AGR (Accounting And Governance Risk) Equity Risk Factor, indicating that they are liable to "substantially underperform" the market over the next several months. In this article we'll look at 5 of the most actively-traded of those mid caps predicted to "substantially underperform" the market.
High Accounting And Governance Risk
Of the 29 mid caps predicted by GMI to substantially underperform the market, these five were among the most actively traded: Sandridge Energy SD, Turquoise Hill Resources TRQ, Celldex Therapeutics CLDX, Gulfport Energy Corp. GPOR, and Halcon Resources Corp. HK. Knowing that the AGR Equity Risk Factor is derived from another GMI Metric, the Accounting And Governance Risk Rating, I reviewed GMI's Accounting And Governance Risk Review report on these five stocks (via Fidelity), and saw that GMI gave its worst possible ranking, "Very Aggressive", to two of the five stocks (SD and TRQ), indicating that they had higher accounting and governance risk than more than 90% of the stocks GMI covers. According to GMI, companies rated "Very Aggressive" are 10 times more likely to face SEC enforcement actions than those rated "Conservative" (the best of its four possible Accounting And Governance Risk ratings).
Ameliorating The Risk Of Owning These Mid Caps
For those investors in these stocks who are wary of the risks, but would rather not sell their shares at this point, we'll look at a couple of different ways they can hedge against significant declines over the next several months. To illustrate, we'll use one of these mid caps, Gulfport Energy, as an example. Then we'll show the costs of hedging the other mid caps we've discussed here in the same manner.
Two Ways Of Hedging GPOR
Below are two ways for a Gulfport Energy shareholder to hedge 1000 shares against a greater-than-20% drop between now and mid April.
1) The first way uses optimal puts*; this way allows uncapped upside, but is more expensive. These were the optimal puts, as of Tuesday's close, for an investor looking to hedge 1000 shares of GPOR against a greater-than-20% drop between now and April 18th:
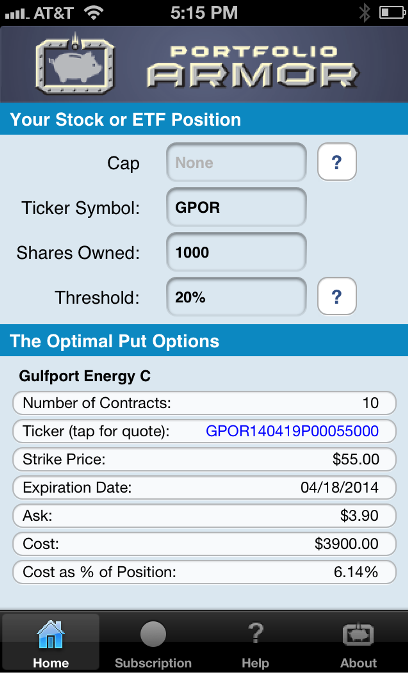
As you can see at the bottom of the screen capture above, the cost of this protection, as a percentage of position value, was 6.14%.
2) A GPOR investor interested in hedging against the same, greater-than-20% decline between now and mid April, but also willing to cap his potential upside at 20% over that time frame, could have used the optimal collar** below to hedge instead.
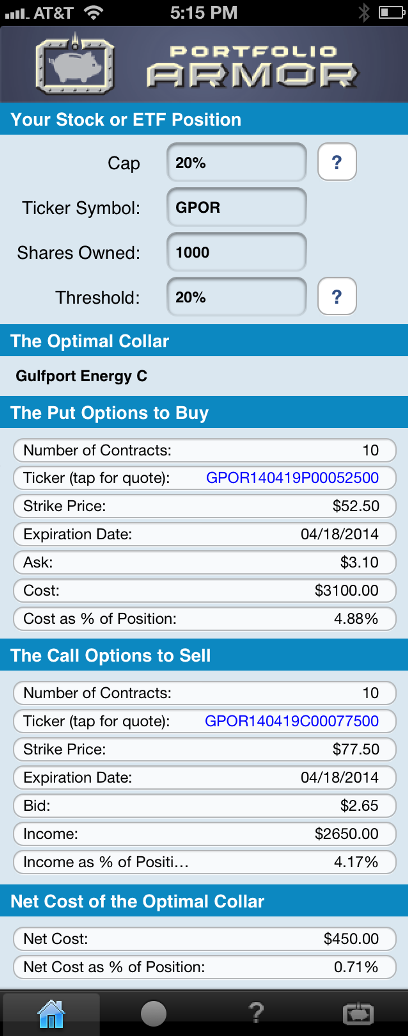
As you can see at the bottom of the screen capture above, the net cost of this collar, as a percentage of position value, was 0.71%.
Note that, to be conservative, the cost of both hedges was calculated using the ask price for the optimal puts and the put leg of the optimal collar, and the bid price of the call leg of the optimal collar; in practice, an investor can often buy puts for some price less than the ask price (i.e., some price between the bid and ask) and sell calls for some price higher than the bid price (i.e., some price between the bid and the ask).
Possibly More Protection Than Promised
In some cases, hedges such as the one above can provide more protection than promised. For a recent example of that, see this post about hedging the iPath S&P 500 Short Term VIX Futures ETN VXX
Hedging Costs For All Of the Mid Caps Mentioned Above
The table below shows the costs, as of Tuesday's close, of hedging all of the mid caps mentioned above in a similar manner as FSLR above: first, with optimal puts against a >20% drop over the next several months; then, with optimal collars against the same percentage drop over the same time frame, while capping the potential upside at 20%. The SPDR S&P 500 ETF SPY was added to the table for comparison purposes. There were no optimal puts available for Celldex Therapeutics or Gulfport Energy using these parameters as of Tuesday, because those two stocks were too expensive to hedge against a >20% decline using puts (i.e., the cost of put protection in those cases was more than 20% of position value). There was no optimal collar for SPY because there were no bids on calls for it that far out of the money.
|
Name |
Symbol |
Optimal Put Hedging Cost |
Optimal Collar Hedging Cost |
|
Halcon Res. |
HK |
14.18% |
9.45% |
|
Sandridge Ener. |
SD |
7.39% |
2.41% |
|
Turquoise Hill |
TRQ |
NA |
13.1% |
|
Celldex Therap. |
CLDX |
NA |
0.82% |
| Gulfport Energy | GPOR | 6.14% | 0.71% |
|
SPDR S&P 500 |
SPY |
0.56% |
NA |
*Optimal puts are the ones that will give you the level of protection you want at the lowest possible cost. Portfolio Armor uses an algorithm developed by a finance PhD to sort through and analyze all of the available puts for your stocks and ETFs, scanning for the optimal ones.
**Optimal collars are the ones that will give you the level of protection you want at the lowest net cost, while not limiting your potential upside by more than you specify. The algorithm to scan for optimal collars was developed in conjunction with a post-doctoral fellow in the financial engineering department at Princeton University. The screen captures above come from the Portfolio Armor iOS app.
© 2024 Benzinga.com. Benzinga does not provide investment advice. All rights reserved.
Comments
Trade confidently with insights and alerts from analyst ratings, free reports and breaking news that affects the stocks you care about.

