


USD/JPY recovery seems to have gathered pace, tracking the rising yields, but the bullish reversal is still not confirmed, indicates technical charts.
Having bottomed out at 105.55 on Friday, the pair is now trading at 107.75. Despite the 2.08 percent rise, the pair is still down 3.2 percent from the January high of 113.39.
Daily chart
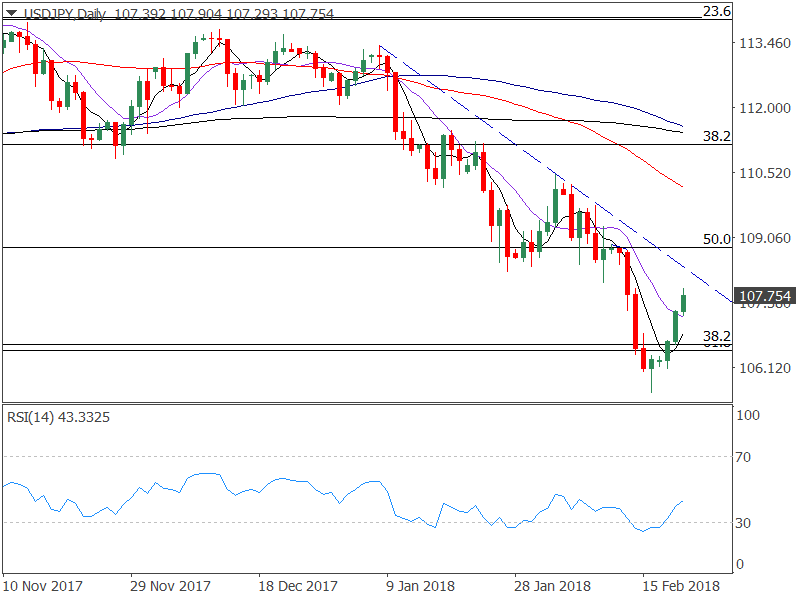
- Friday's long-tailed candle and a bullish follow-through on Monday certainly paints a picture which says a bottom has been made at 105.55.
- However, the 10-day moving average (MA) is still biased bearish. Also, the weekly 5-MA is sloping downward and is currently seen at 108.31.
- Further, the descending trendline (drawn from the Jan. 8 high and Feb. 2 high) representing lower highs and lower lows pattern is still intact. As of now, the trendline resistance is seen at 108.50.
- The pair also closed last week below the long-term rising trendline (sloping upward from the Sep. 2012 low and Aug. 2016 low). The trendline will likely offer stiff resistance around 108.10.
- The relative strength index (RSI), though rising, is still well below 50.00 (in bearish territory).
So, only a close above 108.50 would signal bullish trend reversal and open doors for a sustained rise to 110.00 and above.
The pair may close above 108.50 if the Fed minutes (due today) offer insight into why the officials added the word “further” twice to their statement on "gradual adjustment in interest rates".
Bearish scenario - A close below 107.28 (session low) would add credence to the downward sloping 10-day MA, 4-hour 50-MA and would allow a re-test of 106.00 - 105.55.
© 2024 Benzinga.com. Benzinga does not provide investment advice. All rights reserved.
Trade confidently with insights and alerts from analyst ratings, free reports and breaking news that affects the stocks you care about.

