S&P 500 rose to 2754 last Friday - its highest level since Feb. 5 and up 8.89 percent from the Feb. 6 low of 2529, but the gains could be short-lived, indicate technical charts.
Daily chart
Friday's doji candle at the confluence of 50-day moving average (MA) (red line) and 61.8 percent Fibonacci retracement of the recent drop and a bearish follow-through this week indicates the technical recovery from the Feb. 6 low of 2529 may have topped out at 2754.72 (Friday's high).
The stochastic continues to roll over from the overbought zone and the relative strength index (RSI) is back below 50.00 (in the bearish territory). That said, the 10-day moving average is still biased bullish and that distorts the bearish picture.
However, the bearish set up on the weekly chart adds credence to the topping pattern around 61.8 percent Fib seen on the daily chart and indicates the sell-off is likely to resume soon.
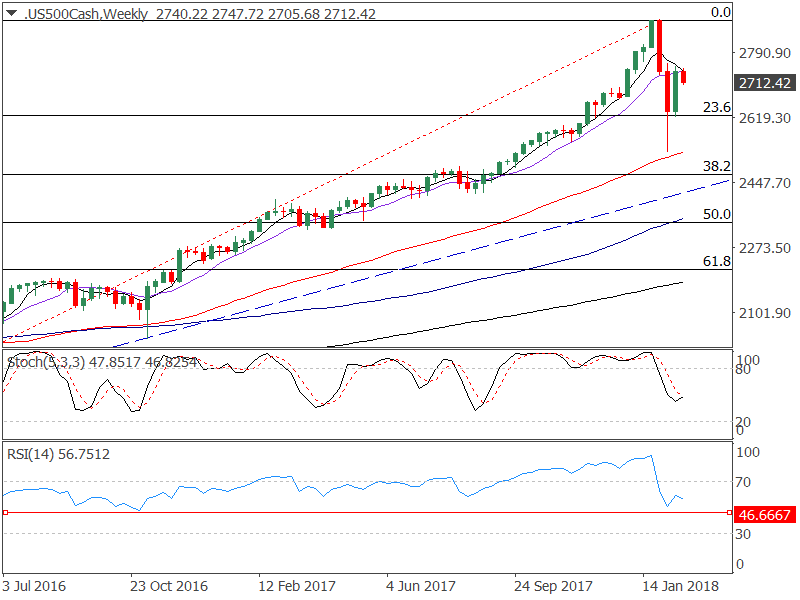
Weekly chart
The above chart shows last week's rebound from the 23.6 percent Fib has run into a bearish 5-week MA and 10-week MA crossover. Also, stochastic and RSI continues to favor the bears.
View
- The index will likely revisit 2623 (23.6 percent Fib) in the next few days. A violation there would expose the weekly 50-MA of 2527.
- Also note that throughout the bull run (Feb. 2016 to Jan. 2018), at no point were the bears strong enough to push the weekly RSI below 46.00.
- So, only RSI falling below 46.00 would signal a long-run bullish-to-bearish trend change.
© 2024 Benzinga.com. Benzinga does not provide investment advice. All rights reserved.
Comments
Trade confidently with insights and alerts from analyst ratings, free reports and breaking news that affects the stocks you care about.

