


As European finance ministers hold a conference call to discuss the Spanish bank aid deal, high beta currencies and risk-correlated assets have come under pressure. The €100 billion aid package was enough to stoke risk-appetite over the past few weeks, but that doesn't seem to be enough for keep sentiment elevated. Now that the Spanish aid deal is close to being finalized, market participants are seemingly looking for the next liquidity fix, and with little hope on the horizon, investors have started to shed riskier assets.
Most notably, this has pushed Italian and Spanish bond yields back up towards the stratosphere; accordingly, the Euro has fallen across the board and is the worst performing major thus far on Friday. The Italian 2-year note yield has moved higher to 3.670% (+17.4-bps) while the Spanish 2-year note yield has ballooned to 5.161% (+15.1-bps), now near its highest levels (lowest in terms of price) over the past three-months. Likewise, the Italian 10-year note yield has jumped to 6.049% (+7.7-bps) while the Spanish 10-year note yield has risen to 7.025% (+9.9-bps); higher yields imply lower prices.
RELATIVE PERFORMANCE (versus USD): 10:22 GMT
JPY: +0.03%
CAD: -0.13%
GBP: -0.23%
AUD: -0.25%
NZD:-0.26%
CHF: -0.40%
EUR: -0.41%
Dow Jones FXCM Dollar Index (Ticker: USDOLLAR): +0.03%(-0.77% past 5-days)
ECONOMIC CALENDAR

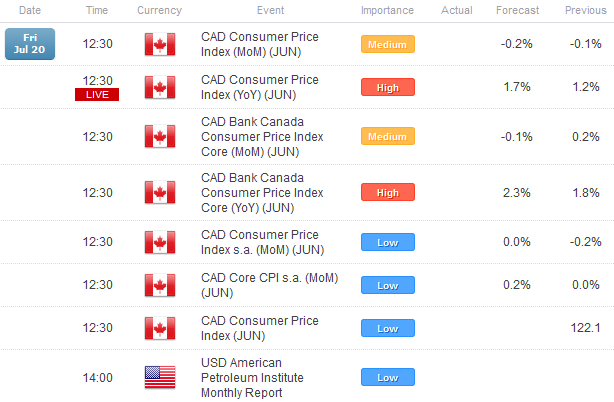
A quiet North American session is on the horizon to finish the week, with only one market moving event on the horizon, but even that shouldn't have a material impact on market conditions outside of Canadian Dollar-based pairs. At 08:30 EDT / 12:30 GMT, the CAD Consumer Price Index for June will be released, which will show a very mixed picture of inflation in Canada. On one hand, there will be evidence of some deflation in the very short-term (on a monthly-basis); but over the longer-term (on a yearly-basis), in both the headline and core readings, the report will show that inflationary pressures have increased. Accordingly, if the data is in line with expectations, the mixed report will have little impact in the hours ahead.
TECHNICAL OUTLOOK
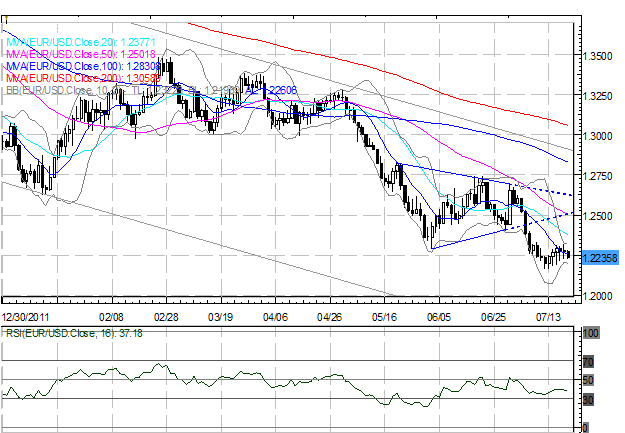
EURUSD: The EURUSD continues to flag higher, range bound with higher highs and higher lows, but that changes little when looking at the pair beyond just a few days. In fact, today's price action is starting to threaten this trend; a daily close below 1.2215 will knock out the previous lows from Wednesday and Thursday. We remain bearish as the pair has yet to complete its measured move from its May 1 decline, and over the coming six-weeks, we are looking for a sell-off into 1.1695-1.1875. Near-term resistance comes in at 1.2255/65, 1.2315/20 and 1.2360/65. Above that, interest lies 1.2400, and the crucial 1.2440/80 zone (Symmetrical Triangle support). Support comes in at 1.2215/25, 1.2195/1.2200 (Bollinger Band), 1.2175 (lows from Monday and Tuesday), and 1.2160/65 (July lows).
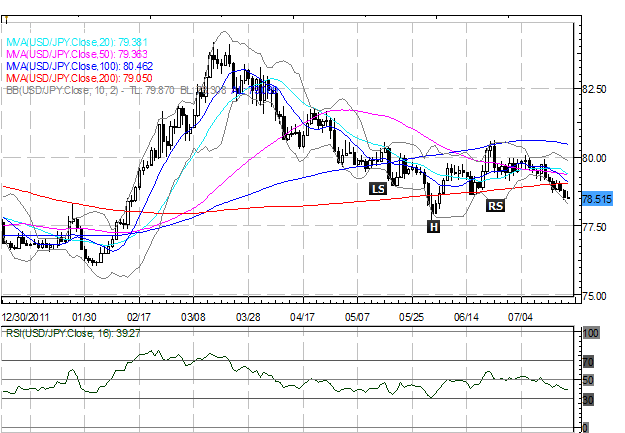
USDJPY: Is the USDJPY is working on an Inverted Head & Shoulders pattern off of the June 1 low? It certainly appeared so for a while there; but the daily close below 78.60 suggests that the pair could trade as low as 78.15/25 before buying interest returns. Still, as long as the Head at 77.60/70 holds, the pattern remains technically valid. With the Head at 77.60/70, this suggests a measured move towards 83.60/70 once initiated. Near-term resistance comes in at 79.00/05 (200-DMA). Price action to remain range bound as long as advances are capped by 80.60/70.
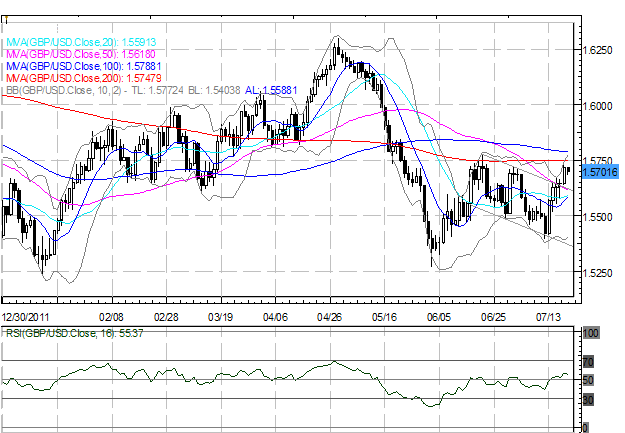
GBPUSD: The pair closed above its 50-DMA on Wednesday and broke out of a short-term descending channel, in what perhaps may be a Bull Flag on the 4-hour/daily charts. Near-term resistance noted yesterday at 1.5720/25 (former swing high) held (with the close at 1.5721), so we remain skeptical of a move up towards 1.5890/1.5905 for now. Above that, selling interest could return at 1.5745/50 (200-DMA) and 1.5775/80 (June high). Near-term support comes in at 1.5580, 1.5460/65 then 1.5390/1.5405 (monthly low, Bollinger Band).
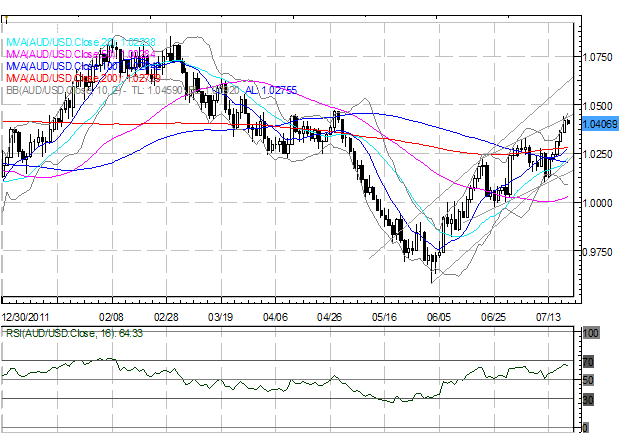
AUDUSD: The pair is working higher in two separate ascending channels, hitting resistance at 1.0430 in the less steep of the two. A daily close above this level signals a rally further up into 1.0470/75 (April high). However, short-term charts are looking overextended at current price, so it's possible there is some consolidation/downside price action before the next leg higher. Near-term support comes in at 1.0385, 1.0325/30, and 1.0135/55.
--- Written by Christopher Vecchio, Currency Analyst
To contact Christopher Vecchio, e-mail cvecchio@dailyfx.com
Follow him on Twitter at @CVecchioFX
To be added to Christopher's e-mail distribution list, send an e-mail with subject line "Distribution List" to cvecchio@dailyfx.com
© 2024 Benzinga.com. Benzinga does not provide investment advice. All rights reserved.
Trade confidently with insights and alerts from analyst ratings, free reports and breaking news that affects the stocks you care about.

