


Daily NZD/USD as of 9/27/2011

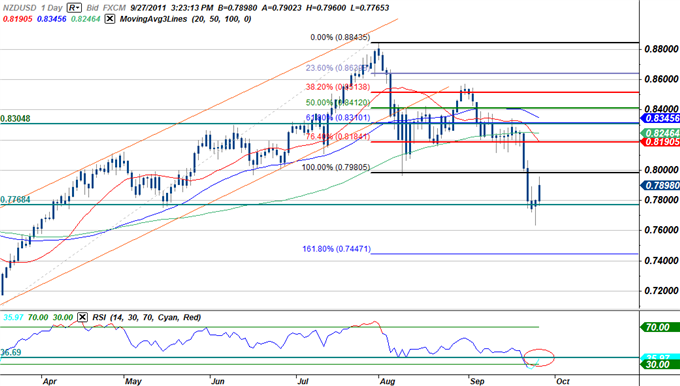
With all the recent price volatility presenting scalp setups across multiple pairs, we thought it appropriate to review our most recent setup on the NZD/USD and walk through the actual trade by trade mechanics of scalping. Note that our original setup sought to fade the recent rally off the 0.7760 support level which was fueled by news that European officials had developed a special purpose vehicle to rescue banks holding distressed sovereign debt. Although the news did see a pickup in risk appetite, the move does little to address the underlying problems facing the region. Accordingly, we expected risk to taper off with higher yielding currencies like the aussie and the kiwi the most likely to come under pressure.
We noted that daily relative strength was approaching former support at the 35 level and was likely to act as interim resistance, limiting topside moves for the kiwi. Also worth noting is the initial dip of RSI into oversold territory bodes well for further downside moves. Likewise when price action is in an upward trend, we find solace in seeing the signal line cross into overbought territory and helps support out bias.
Daily NZD/USD as of 9/29/2011
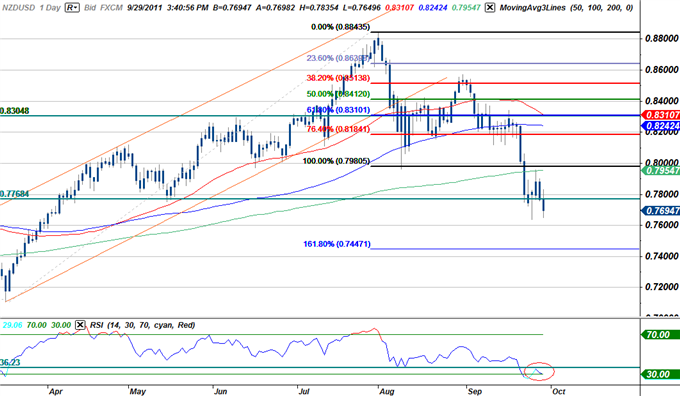
The updated daily chart above attests to the RSI rebound off former support, noting that price action continued to move lower in subsequent days. Also take note that our 50-day and 100-day SMA's have steepened their slope and now look to cross at some point in the next few days.
30min NZD/USD as of 9/27/2011

Recent kiwi price action had carved out a well defined ascending channel which encountered resistance at the 0.7950 resistance target. Our initial setup called for a break below the 76.4% Fibonacci extension at 0.7890 to initiate our first short scalp. Initial targets were held at Support Target 1 at 0.7850.
30min NZD/USD as of 9/29/2011
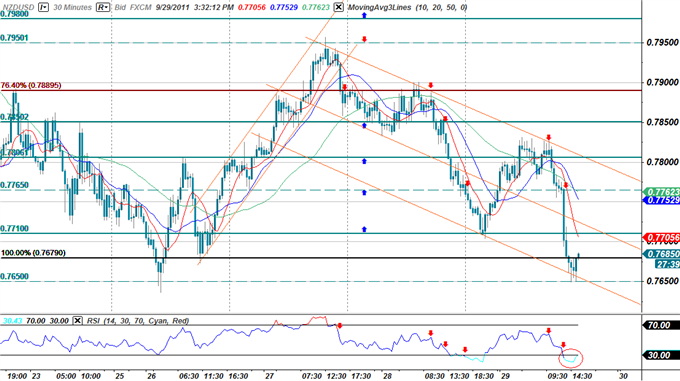
An updated intra-day chart illustrates how the scalps are to be triggered. We look for breaks of our support levels with RSI conviction, meaning not only the location of the signal line, but also the slope should also provide further justification in initiating the scalp. Note that he red arrows on the chart correspond to the RSI levels below, with each break of subsequent support being backed up by a steep sloping signal line. The arrows designate points at which the short was opened with our profit targets and stops determined by taking a percent of the hourly ATR which is cited in the key threshold gird below.
Moving forward our bias remains weighted to the downside for the kiwi with rallies providing opportunities for better short entries. Below are the updated levels for the pair moving forward.
Key Thresholds
With a 1-hour average true range of 38.46 profit targets on said scalp should remain between 28-32 pips depending on entry. We reckon a break above the topside limit at the 0.7800-figure negates the bias with such a scenario eyeing topside targets at the 76.4% Fibonacci extension taken from the August 1st and 31st crests at 0.7890 and 0.7950.
*Note the scalp will not be active until a confirmed break below 0.7680 or a rebound off the 0.7765 resistance level with RSI conviction. Once the scalp is active the levels will remain in play until such time when either of the topside/bottom limit targets are compromised.
|
Entry/Exit Targets |
Timeframe |
Level |
|
Resistance 1 Target |
30min |
0.7765 |
|
Topside Limit |
30min |
0.7800 |
|
Topside Limit Break-Target |
30min |
0.7890 |
|
Support 1 Target |
30min |
0.7680 |
|
Support 2 Target |
30min |
0.7650 |
|
Support 3 Target |
30min |
0.7620 |
|
Bottom Limit |
30min |
0.7580 |
|
Bottom Limit Break-Target |
30min |
0.7560 |
Updated 9/29/2011
Reference Values
|
Indicator |
Timeframe |
Level |
|
50-SMA |
Daily |
0.8311 |
|
100-SMA |
Daily |
0.8243 |
|
200-SMA |
Daily |
0.7954 |
|
RSI |
Daily |
30.00 |
|
Average True Range (14) |
1hour |
38.46 |
Updated 9/29/201
Related Economic Data Releases
Event risk on the pair rests with the greenback with personal income, personal spending, and the University of Michigan confidence report on tap. Consensus estimates call for a both income and spending to decrease by 0.1% and 0.2% respectively, while confidence is expected to hold at 57.8. A weaker than expected print on the data has the capacity to fuel more concerns about the domestic economy and would further support our scalp setup.
Upcoming Events
|
Country |
Date |
GMT |
Importance |
Release |
Expected |
Prior |
|
US |
9/30 |
12:30 |
MEDIUM |
Personal Income (AUG) |
0.1% |
0.3% |
|
US |
9/30 |
12:30 |
MEDIUM |
Personal Spending (AUG) |
0.2% |
0.8% |
|
US |
9/30 |
12:30 |
LOW |
Personal Consumption Expenditure Deflator (YoY) (AUG) |
3.0% |
2.8% |
|
US |
9/30 |
12:30 |
LOW |
Personal Consumption Expenditure Core (MoM) (AUG) |
0.2% |
0.2% |
|
US |
9/30 |
12:30 |
MEDIUM |
Personal Consumption Expenditure Core (YoY) (AUG) |
1.7% |
1.6% |
|
US |
9/30 |
13:45 |
LOW |
Chicago Purchasing Manager (SEP) |
56.5 |
56.5 |
|
US |
9/30 |
13:55 |
HIGH |
U. of Michigan Confidence (SEP F) |
57.8 |
57.8 |
|
US |
9/30 |
14:00 |
LOW |
NAPM-Milwaukee (SEP) |
- |
58.3 |
Written by Michael Boutros, Currency Analyst for DailyFX.com
To contact the author of this report or subscribe to their daily analysis, please send inquiries to:mboutros@dailyfx.com
You can also follow Michael on Twitter @MBForex for updates on this scalp and other trades.
© 2024 Benzinga.com. Benzinga does not provide investment advice. All rights reserved.
Trade confidently with insights and alerts from analyst ratings, free reports and breaking news that affects the stocks you care about.

