


- Ethereum momentum is mundane and limited by a descending trendline.
- Ethereum is inclined towards trending sideways in the short-term.
Ethereum brushed shoulders with $240 but failed to make headway towards $250 milestone. The uptrend started at the beginning of the week, was deep-rooted in the support at $200.
The gains from July 24 were massively enhanced following the break above the descending trendline from July highs around $320. Moreover, trading above the hour Moving Averages pulled Ethereum higher above the resistance at $220 and $230 respectively.
At press time, Ethereum momentum is mundane and limited by a descending trendline. The bears are pressing down on key support areas starting at $220. The 50 Simple Moving Average (SMA) is also in line to offer support within the same zone. At the same time, the 100 SMA 1-hour currently at $217 will prevent the price from exploring the levels heading to $200 vital support.
In a technical perspective, Ethereum is inclined towards trending sideways in the short-term. Looking at the Moving Average Convergence Divergence (MACD), the path of least resistance is sideways. However, if negative divergence rises, we can expect Ethereum to dive under $220. The same trend signal comes from the Relative Strength Index (RSI) which after retreating from levels around 70 is making a gradual recovery.
ETH/USD 1-hour chart

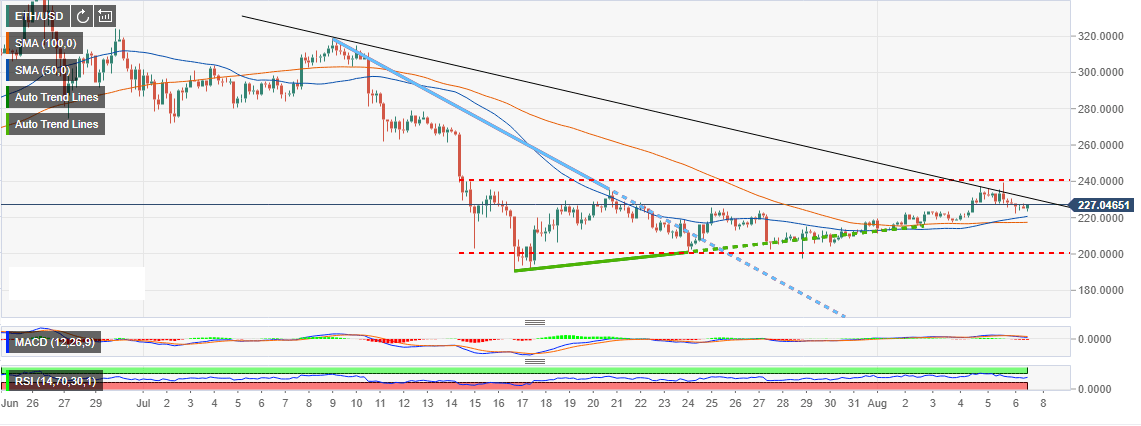
Image Sourced From Pixabay
© 2024 Benzinga.com. Benzinga does not provide investment advice. All rights reserved.
Trade confidently with insights and alerts from analyst ratings, free reports and breaking news that affects the stocks you care about.

